Cookie Consent by PrivacyPolicies.com
Quality Automation with AI and Relimetrics

Knowledge Hub

What, How, why?
User Guide
Installation

Version 2.0.3

Quality Automation with AI and Relimetrics

ReliBoard

Reliboard is a comprehensive and visually intuitive integrated dashboard of ReliTrainer for user, data and AI model management. It provides access to task logs of, datasets available in and AI models built and trained by ReliTrainer. You can monitor the ReliTrainer usage, manage user accounts, get insight about your data, assess and compare the performance of AI models easily. This user-friendly interface consolidates key metrics and insights, facilitating informed decision making in multiple aspects.

1. ReliBoard features seven pages.

2. The “Home” page provides a general overview of the dashboard. This page serves as the gateway for users to access and explore data models, task distribution analytics, and associated reports.

3. In the home menu, the user can check the count of;

  • Imagesets
  • All images
  • Models
  • Users
  • Model Types
  • Model Architectures

4. It is a user-friendly interface to navigate through the analytics features (E.g Task by Date and Types, Model Types and Architectures), making it easy for users to initiate analyses and gain valuable insights into their data and task performance.

5. The “Imagesets” page features a comprehensive table detailing the distribution of imagesets and labels.

6. In the table view, the user can check:

  • Name
  • Creator
  • Image Count
  • Date
  • Detail

7. The user can filter the data by clicking on the “Filter” icon on each column. Filter can be done by predefined options or the user can type it to the text field.

8. Filters can be removed by clicking on the “Clear” button on the Filter pop up.

9. If the user clicks the “Detail” button at the last column, imageset details will be displayed. This column provides the user with quantitative insights for data analysis and facilitates a closer examination of each label category alongside corresponding images.

10. The graphs on the top show the distribution of labels of the selected imageset and the table on the bottom shows all details of each image.

11. The user can check or filter the images by:

  • Name
  • Width & Height
  • Channel
  • Username
  • Date

12. The “Models” page presents a table with filtering options, enabling users to compare the performance of models architecture tailored to specific model types for a given imageset.

13. The user can compare models' performance based on a specific imageset.

14. The page view can be customized by applying various filters available in the table, tailoring it to meet the specific user requirements.

15. The user can check and compare the models by:

  • Name
  • Type
  • Architecture
  • Imageset
  • ROI Group Name
  • Num Classes
  • Training Results (E.g. Validation Accuracy Validation IOU, Validation Map50)
  • Date

16. The “Model Comparison” page serves as an AI model comparison, enabling users to assess the performance of a single model type using a single image set and label set.

17. In the table view, the user can explore the impact of hyperparameters on the performance results.

18. In the graphic view, performance metrics are showcased to facilitate a comparison of all models filtered based on the specific model type.

19. Insights into the effect of hyperparameters on the model's performance are visually represented through graphics.

  • Val IOU
  • Val Acc
  • Val Map50
  • Epoch
  • Learning Rate
  • Momentum

20. The “Tasks” page allows users to filter task types (training or prediction) to examine model hyperparameters for each task type.

21. Visualize the impact of hyperparameters of models on a single imageset and/or on a specific task type. 

22. Customize the page view by applying various filters available in the table, tailoring it to meet the specific user requirements:

  1. Task Type
  2. Imageset
  3. ROI Group Name
  4. Hyper Parameters (E.g. Epoch, ResX…)
  5. Username
  6. Status

23. The “Users” page presents the list of users and details about their activities, allowing for easy status tracking:

  • User name
  • User role
  • Is Active
  • Date
  • Delete

24. “Create User” button enables creating a new user by filling in the necessary details.

25. The “Logs” page records all issues and errors generated by the training server during AI tasks. This comprehensive log is crucial for debugging the system when an error is reported by the customer, allowing for efficient identification and resolution of issues.

26. Customize the page view by applying various filters available in the table:

  • Source Api
  • SourceFunction
  • Message
  • Level
  • Date
Quality Automation with AI and Relimetrics

ReliVision Components

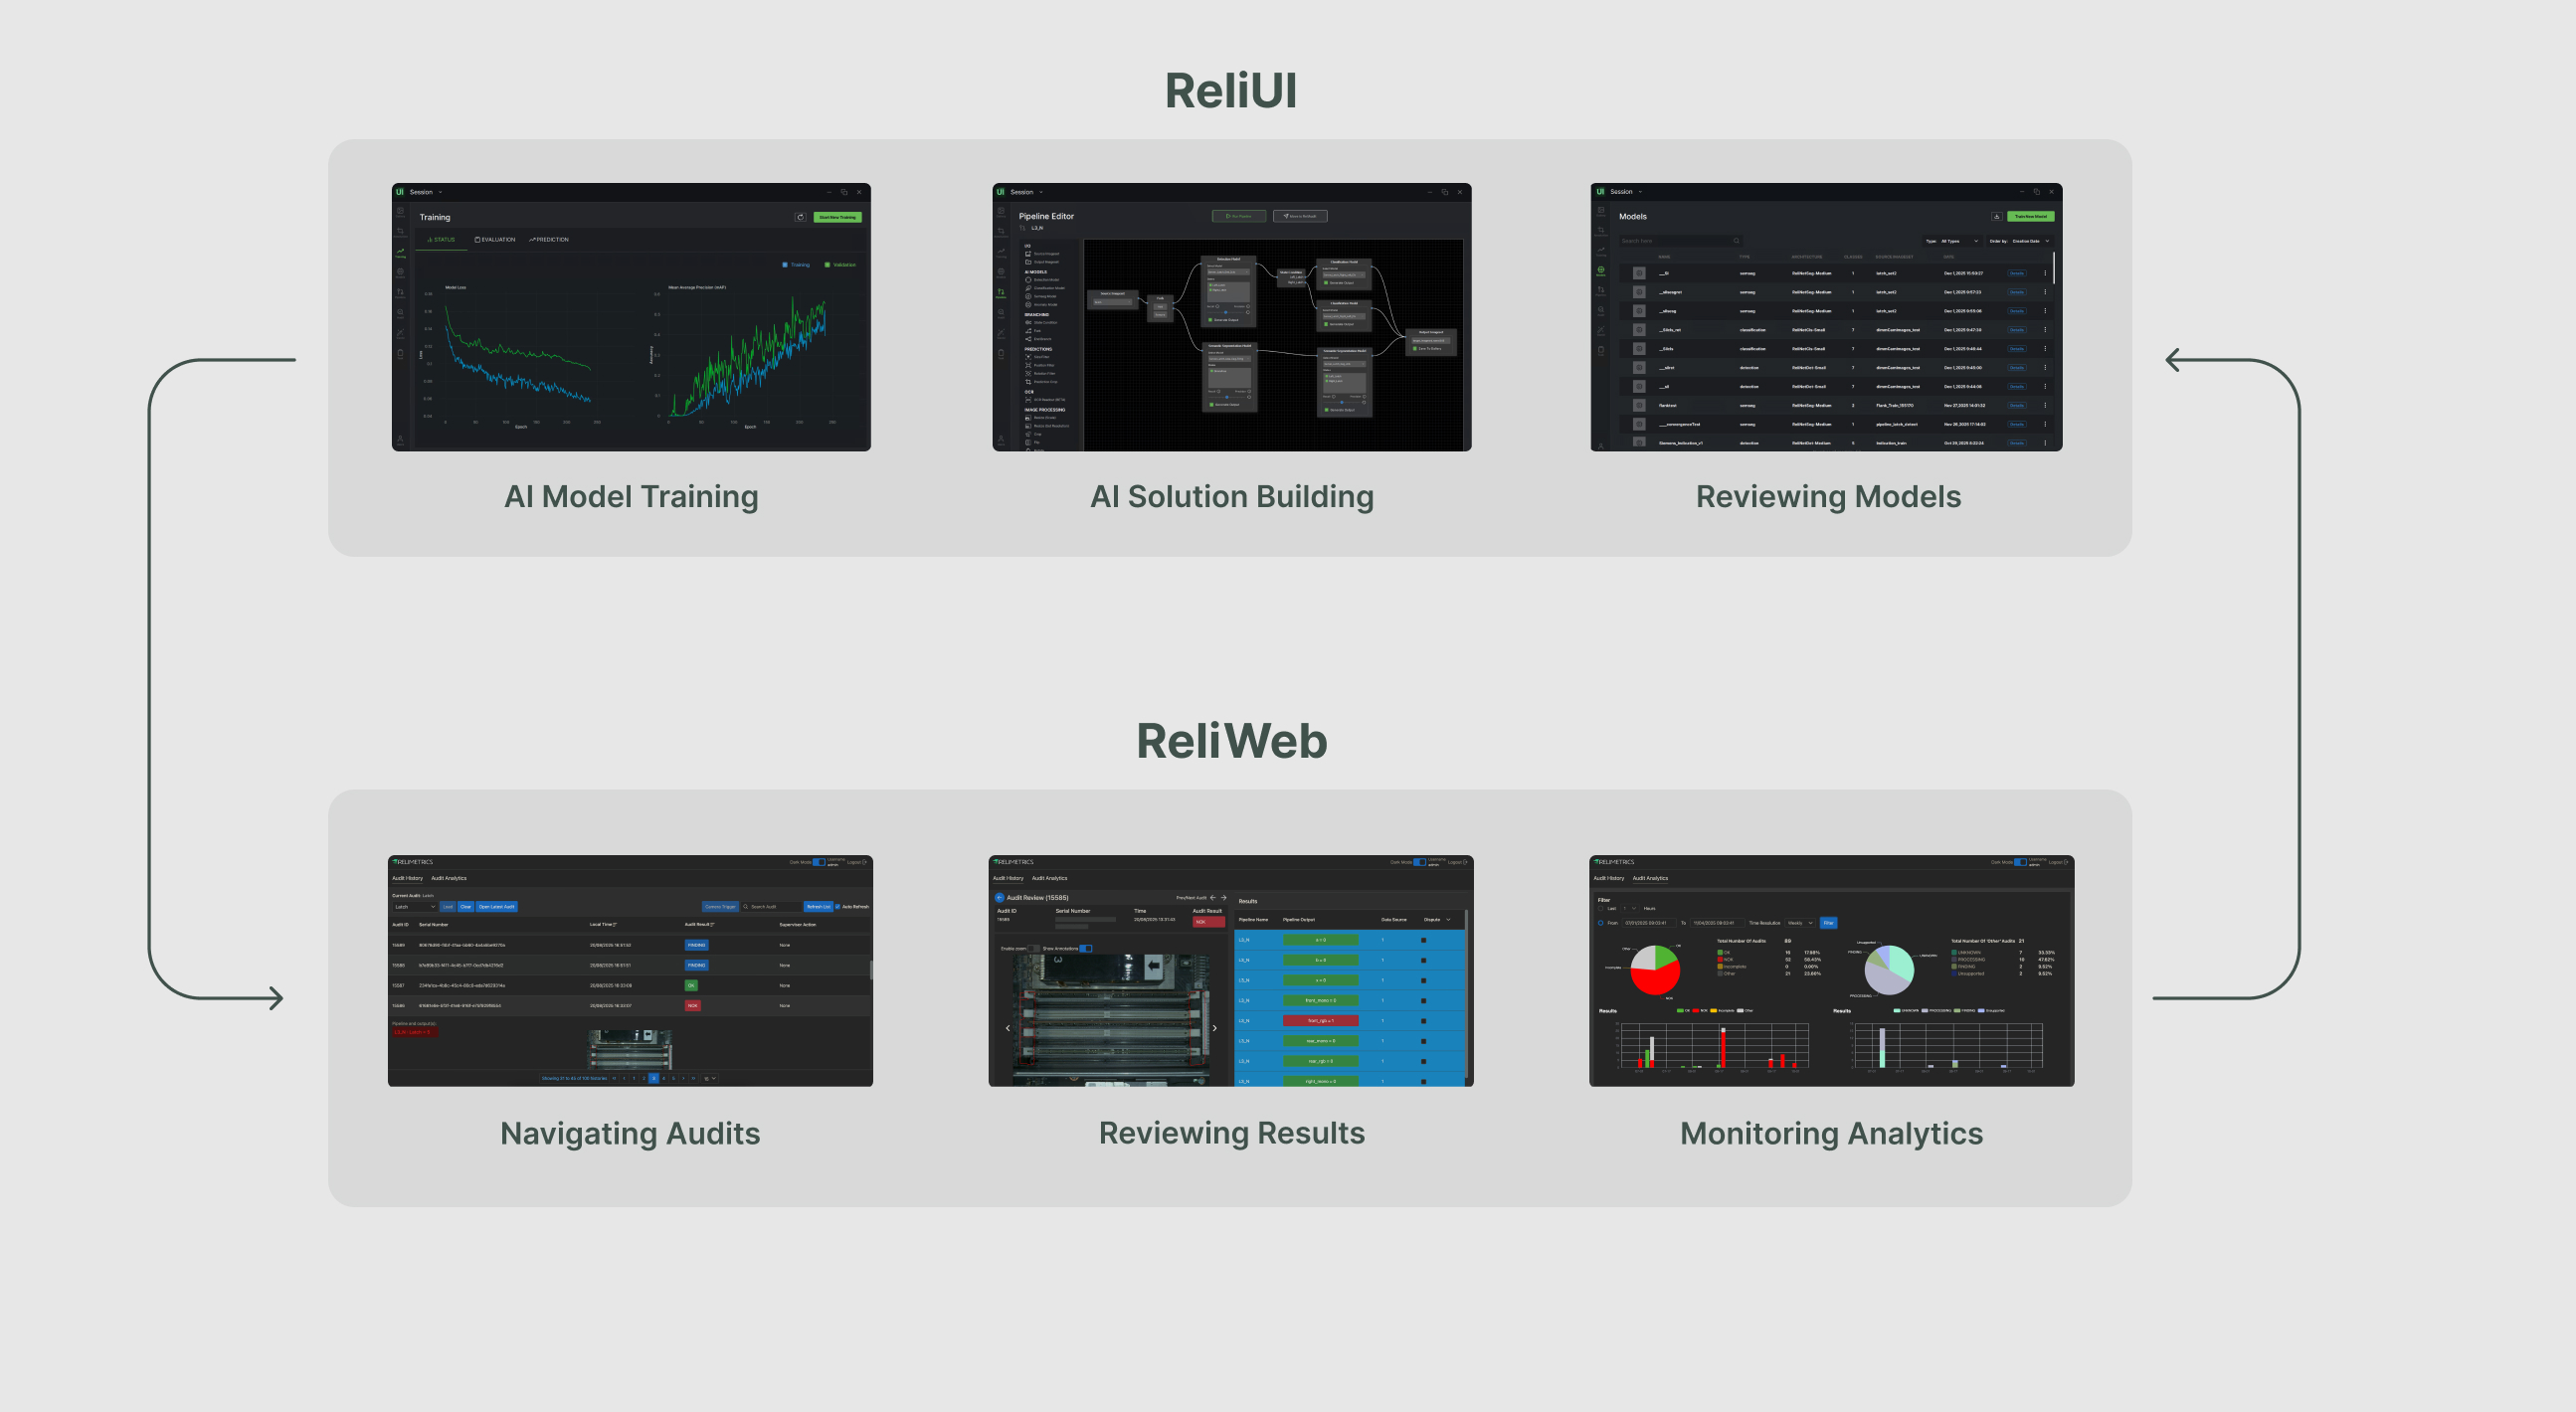
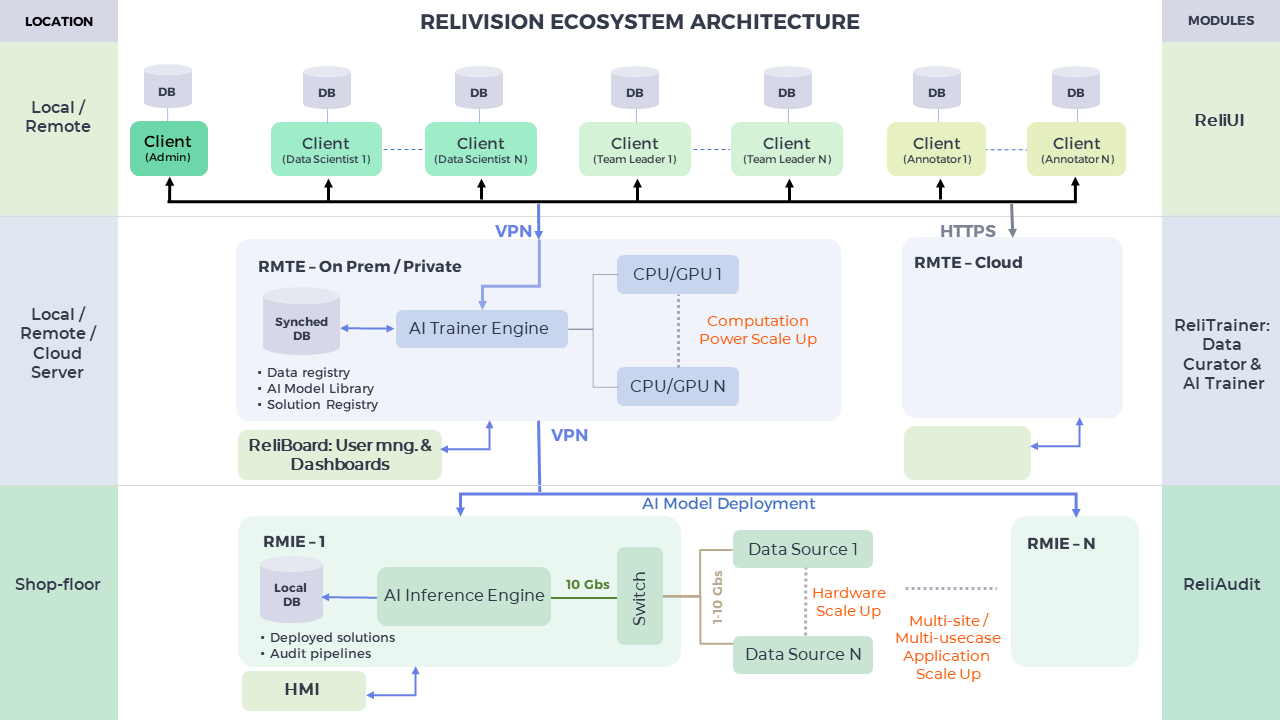
The ReliVision ecosystem is composed of the following modules:

1. ReliUI: Standalone free application with

  • data annotation capabilities

  • training and pipeline editor screens for licensed ReliTrainer

  • user interface for deployment to licensed ReliAudit 

2. ReliTrainer Server (ReliTrainer + ReliBoard)

  • ReliTrainer: AI model and pipeline building, training, retraining and deployment backend.

  • ReliBoard (web-based): ReliTrainer web interface for

    • asset (datasets, AI models) review

    • AI model comparison

    • user management

    • system log review

3. ReliAudit Server (ReliAudit + ReliWeb)

  • ReliAudit: Audit backend for running deployed pipelines on data fed by external DataAcq.API’s. ReliAudit uses load.py and delete.py scripts for loading, configuring and deleting audits. It has standard endpoints to be used for integration with external data acquisition systems. It comes with a sample DataAcq.API that implements folder monitoring.

  • ReliWeb (web-based): ReliAudit web interface for 

    • reviewing individual audit results

    • reviewing audit statistics

    • providing (accept/dispute) feedback

Quality Automation with AI and Relimetrics

Access Portal

1. The login screen presents two options: “Annotation Only” or “Trainer”, allowing users to choose their preferred role based on their access needs and intended actions within the platform.

2. If the user selects “Annotation Only”, they will be directed to the session page where they can begin using platform features such as Gallery, Annotation, and Training.

        3. The user can import and export data, manipulate datasets, and perform annotations.

        4. If the user selects “Trainer”, they will be redirected to the server URL. After clicking the “Next” button, an error message will appear if the server is not licensed. Simply follow the instructions to get a license key and start the server, otherwise you will be directed to the login screen directly

        5. Once the tool is activated with a valid license key, the user will need to enter the login credentials.

        6. All features of ReliVision (Gallery, Annotation, Training and Pipeline) will be available for the user.

        Quality Automation with AI and Relimetrics

        Data Curation

        Data Curation functions of ReliVision are available through the ReliUI, a standalone desktop application that offers the most common industry standard annotation formats, including LabelMe, CoCo, Yolo-DarkNet, Yolo-V3, Yolo-V4, Yolo-V5, as well as acting as the user interface for ReliTrainer functions. With ReliUI, you can:

        • Create/Import Sessions

        • Import/Export Data

        • Manipulate Datasets

        • Annotate Data

        • Export Data

        ReliUI: Data Curation
        Quality Automation with AI and Relimetrics

        Create a New Session / Import a Session

        1. To initiate any operation within the tool, the user must first create a new session by clicking on the “Create a New Session” button.

        2. The user can perform various operations on the created session by right-clicking on it.

        • Load
        • Delete
        • Rename
                • Export

                3. The user can import a session by clicking on “Import Session” button.

                4. The user has the possibility to choose between importing locally or from the server.

                5. Once selected, click on "Next" choose the directory where the session is saved, and finally click on "Import”.

                6. All created / imported sessions will be displayed on the main screen. The user can view details for each session, including the number of image sets, session type, and permissions.

                ReliUI: Data Curation
                Quality Automation with AI and Relimetrics

                Importing/Exporting Data

                Import Raw Dataset

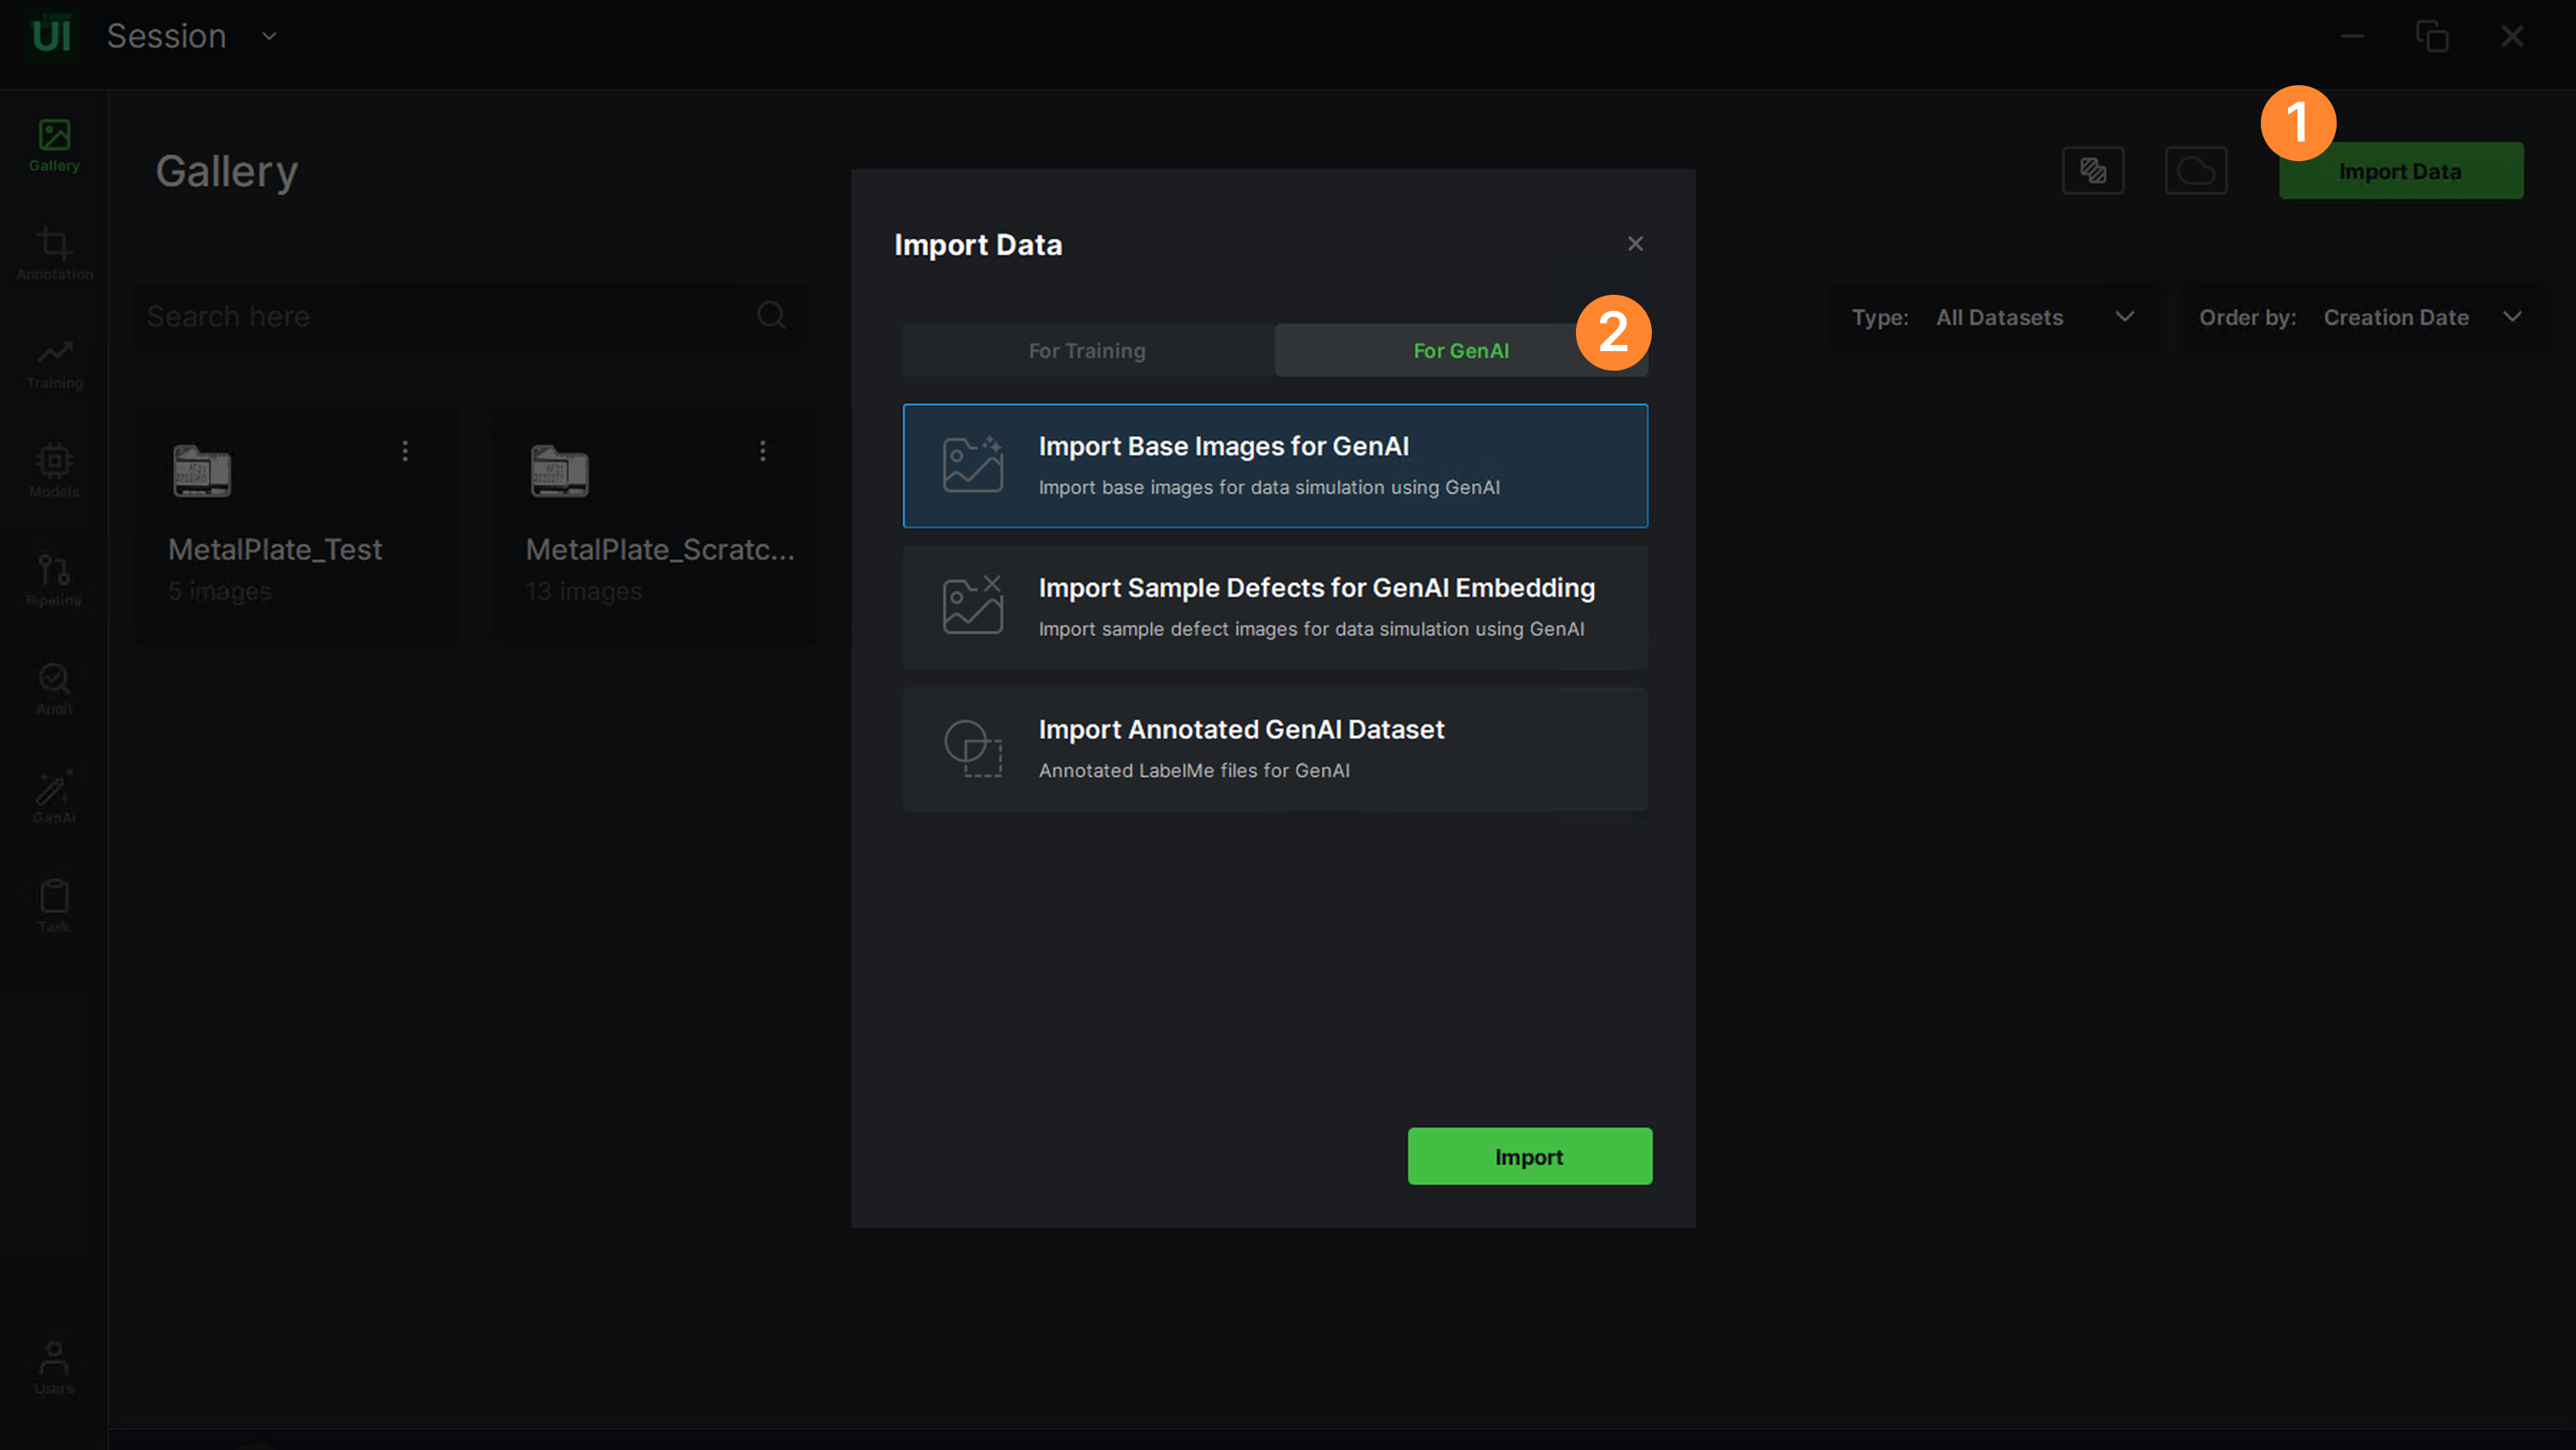
                1. The Gallery screen shows the datasets with the thumbnails. The user can create a new folder and import images or import annotated data. The user can import data by clicking on the “Import Data” button

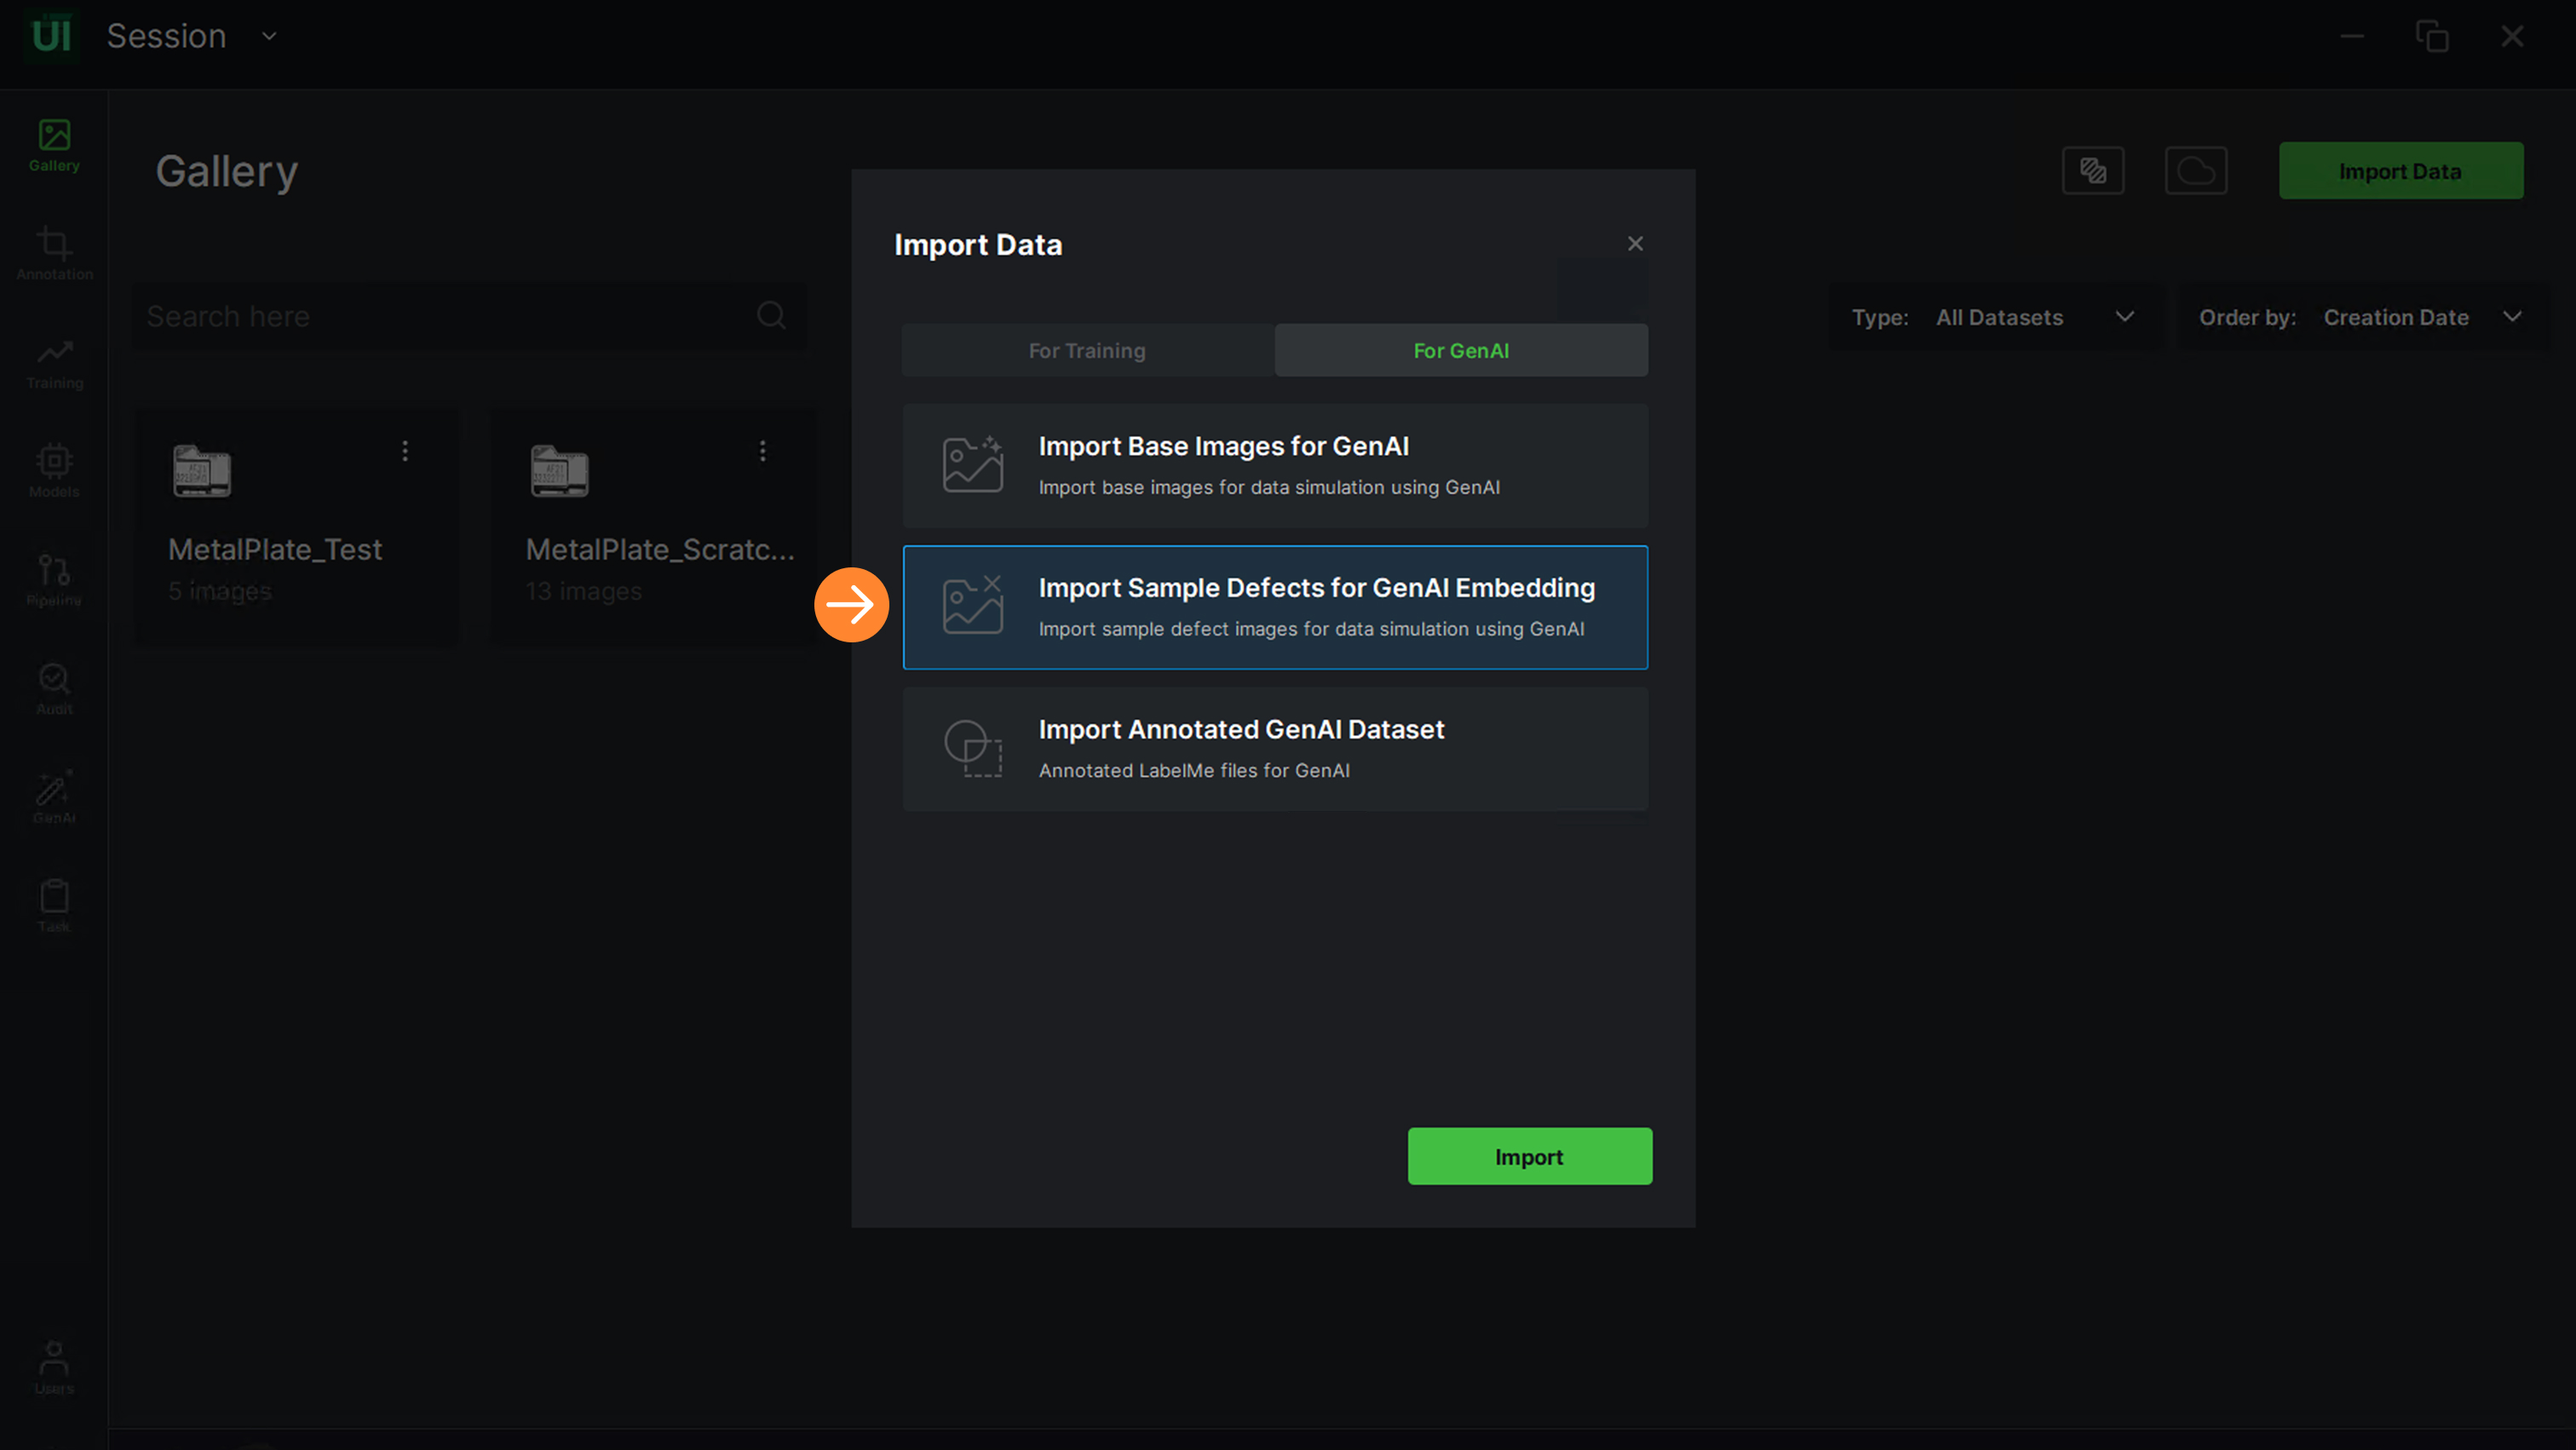
                2. The user can Import Data with the options below:

                • Import Images enables users to import files into a new imageset
                • Import Image Folders enables users to import folders with unannotated images
                • Import Annotated Dataset enables users to import annotated data formats below:
                • LabelMe
                • COCO
                • YOLO
                • Classification
                • Import From ReliAudit imports audit images from ReliAudit
                • Create Empty Imageset enables users to import an empty imageset

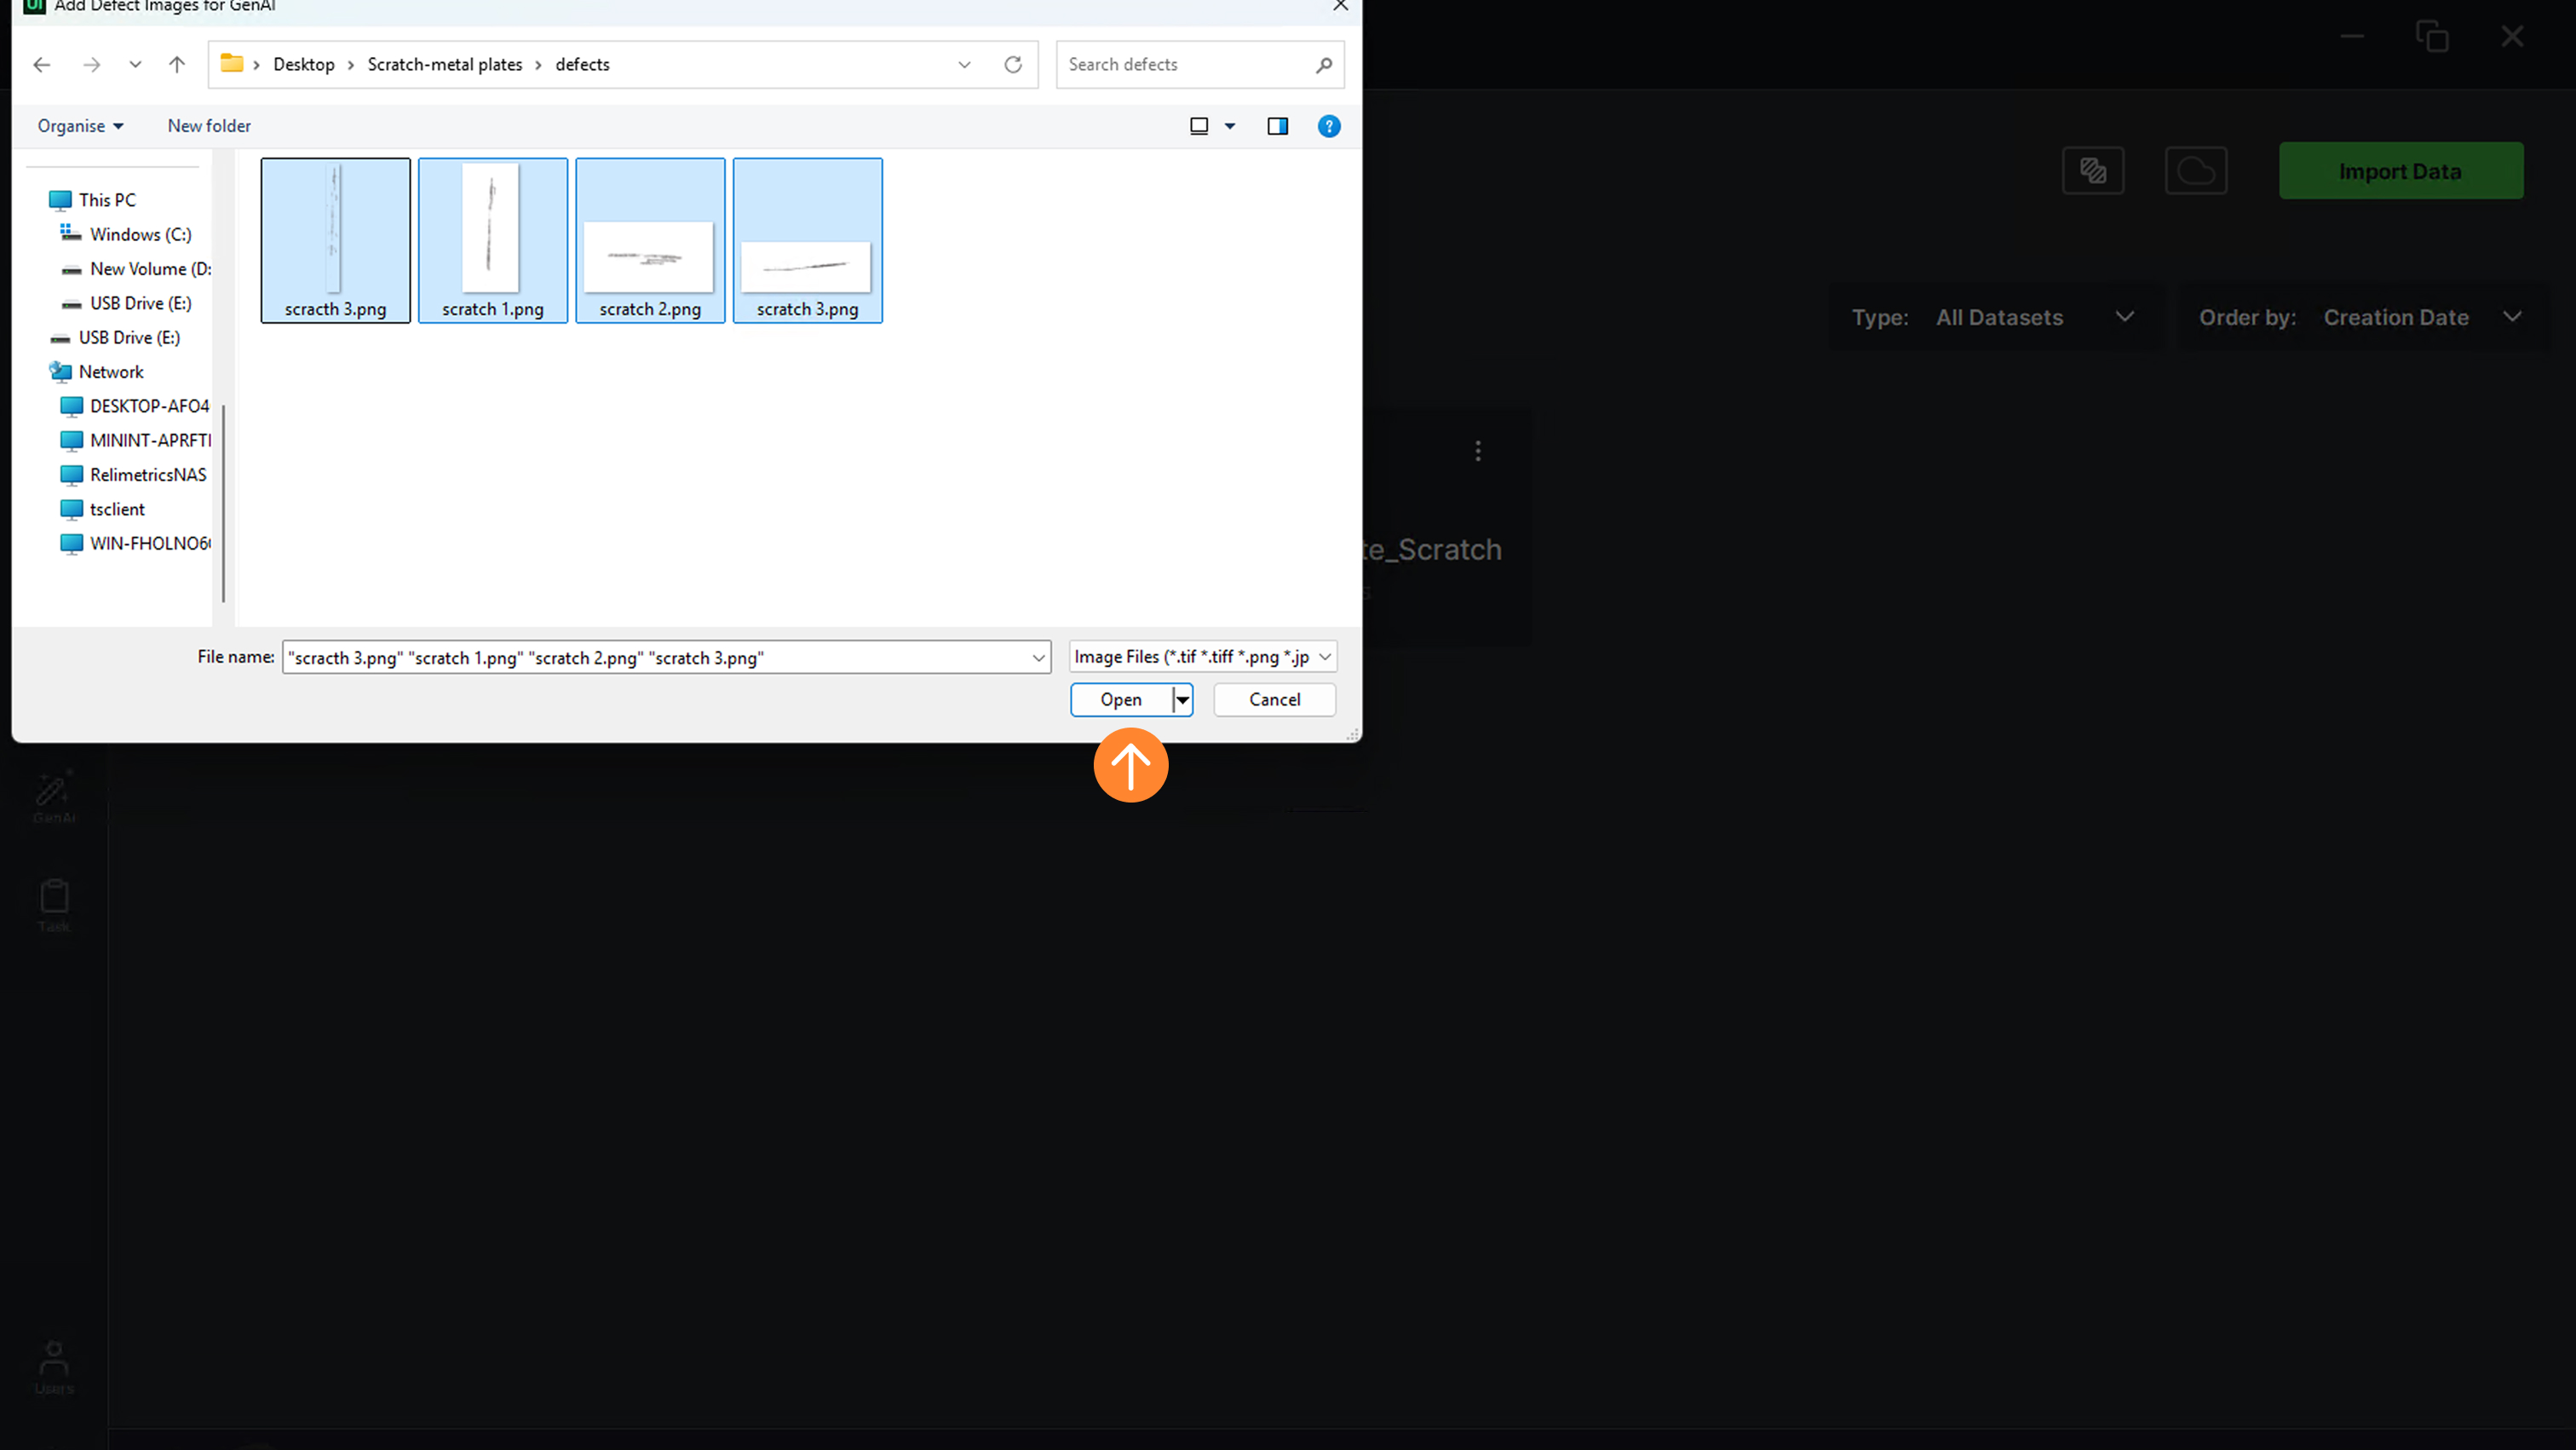
                3. When the user selects the “Import Images” option and clicks the “Import” button, the import process initiates

                4. The user should select images from the directory. Once images are selected, click on “Open”

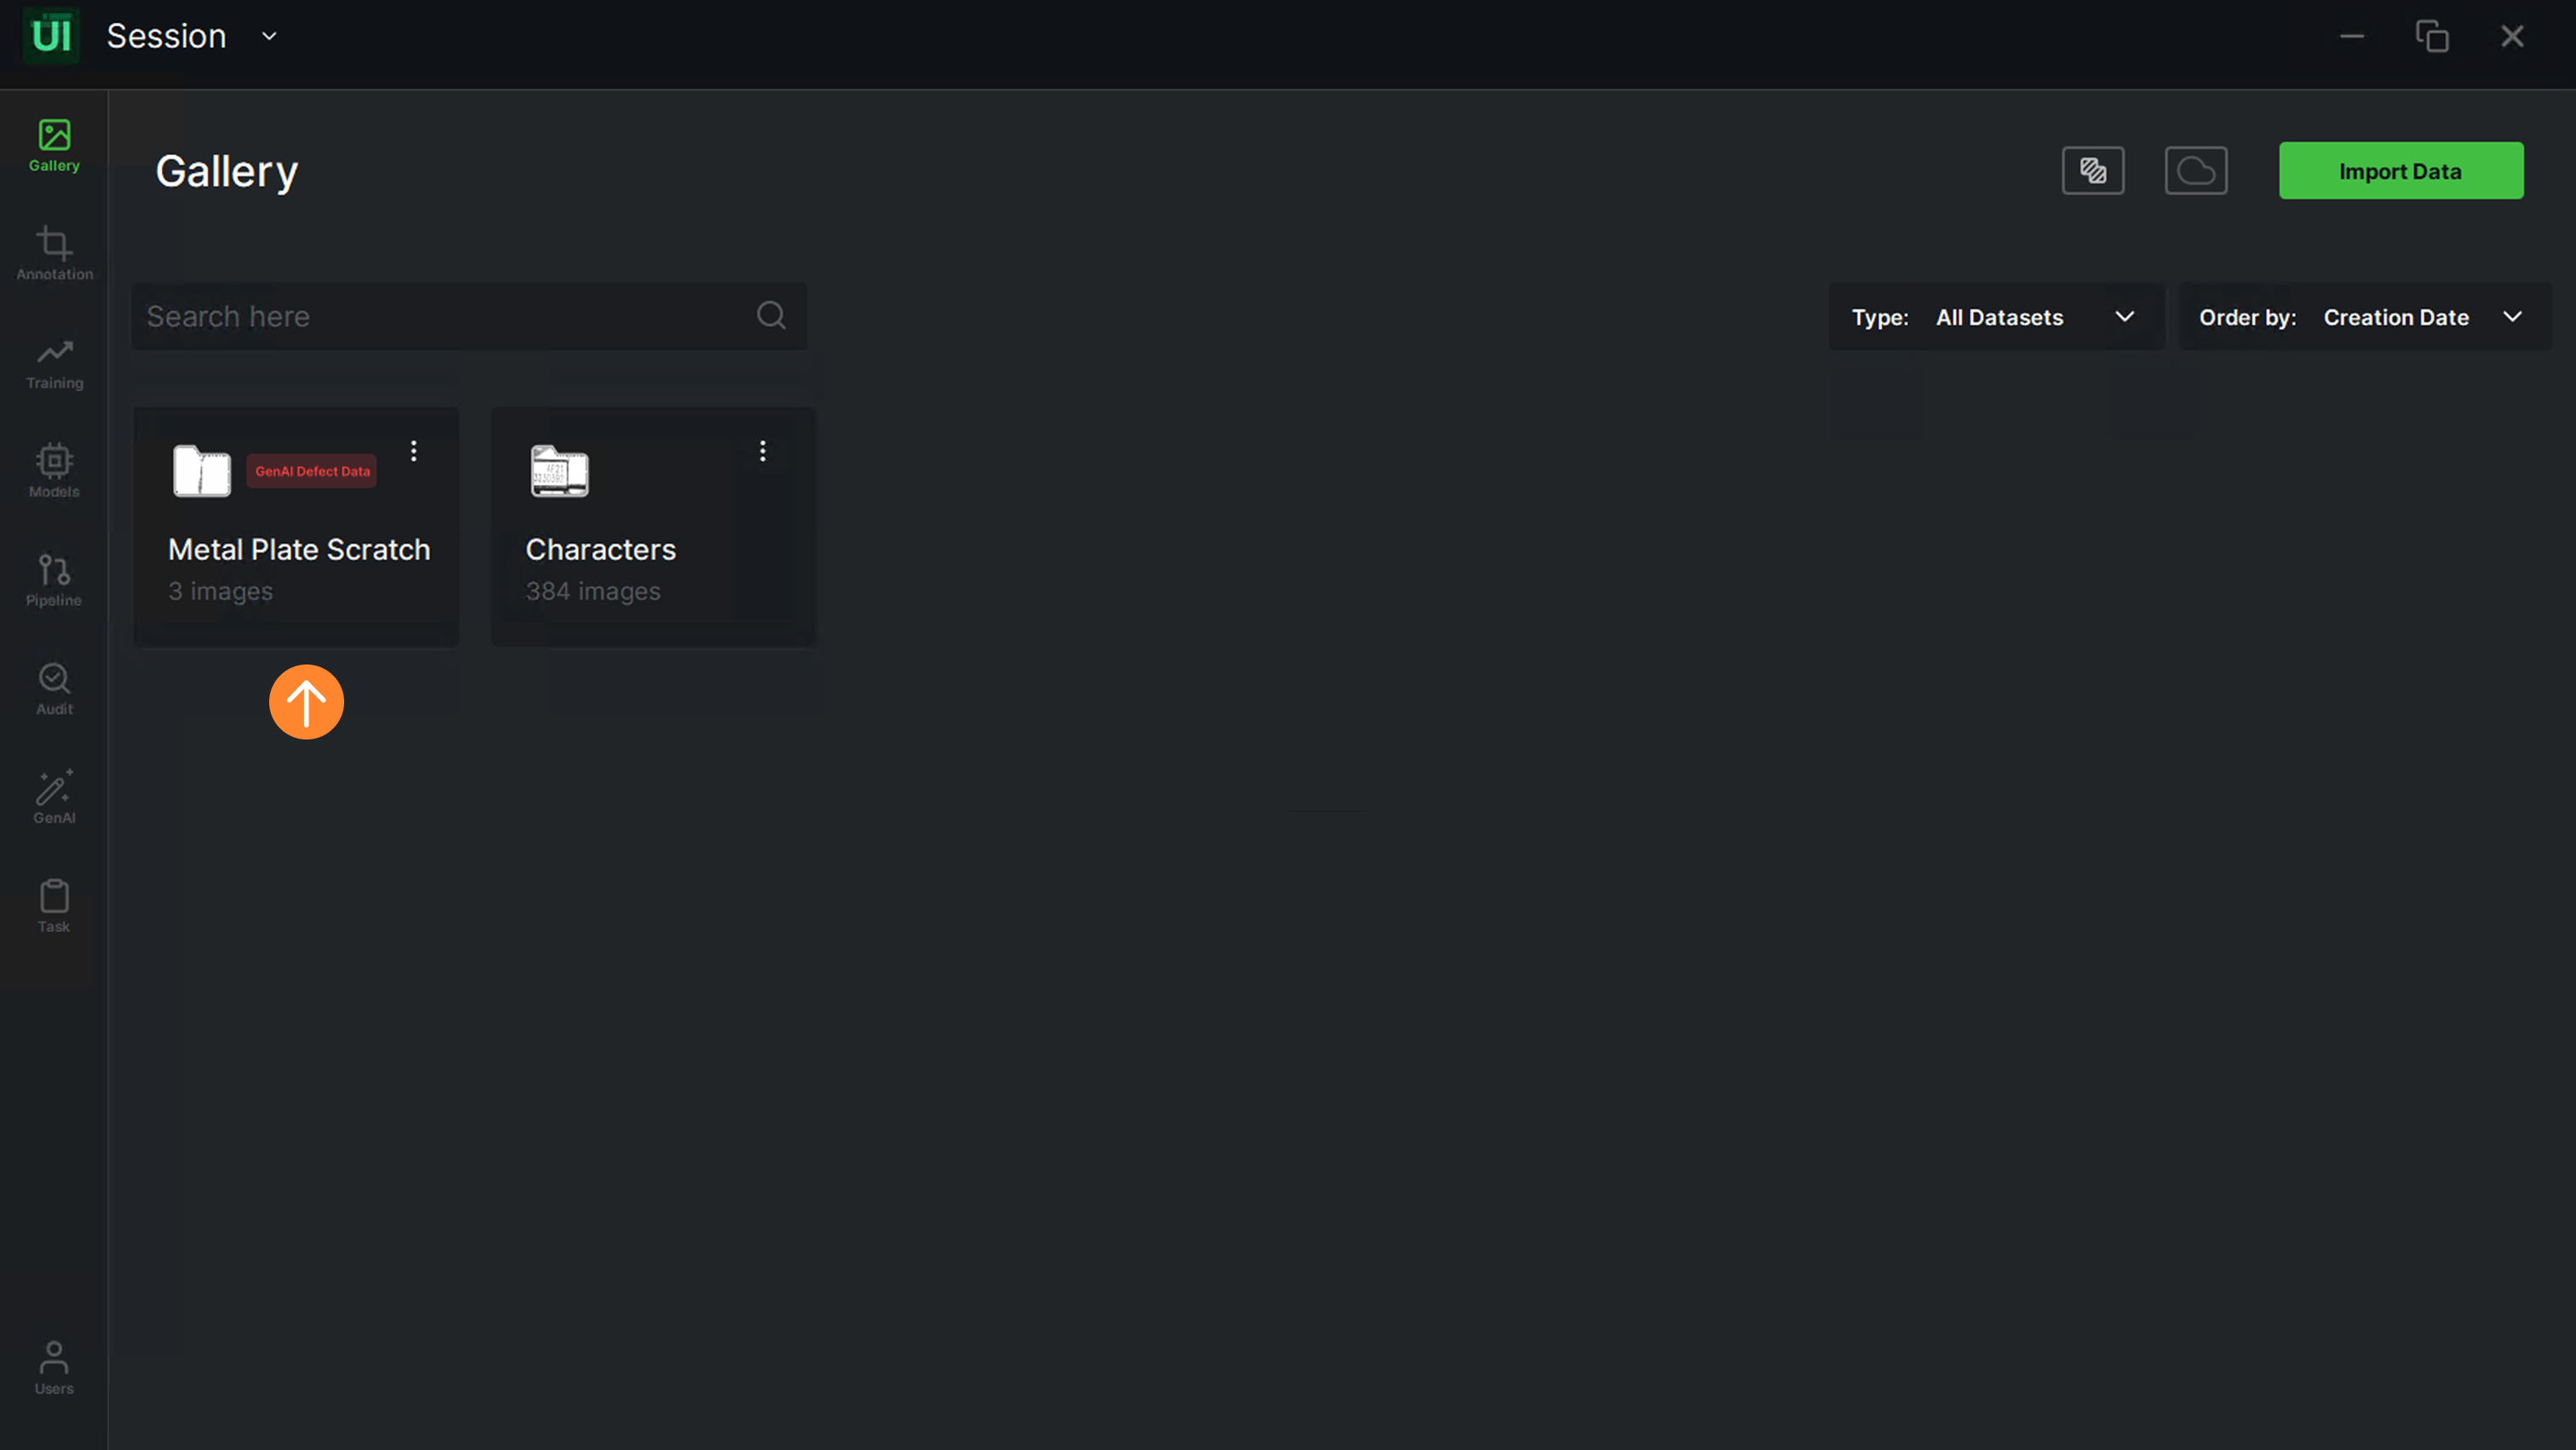
                5. The imported data will be shown as a new dataset on the Gallery screen

                6. The user can check the images by double-clicking on the dataset folder. Users can:

                • Display images
                • Split datasets into training and test sets automatically with a random split or manually balance classes in train/test sets
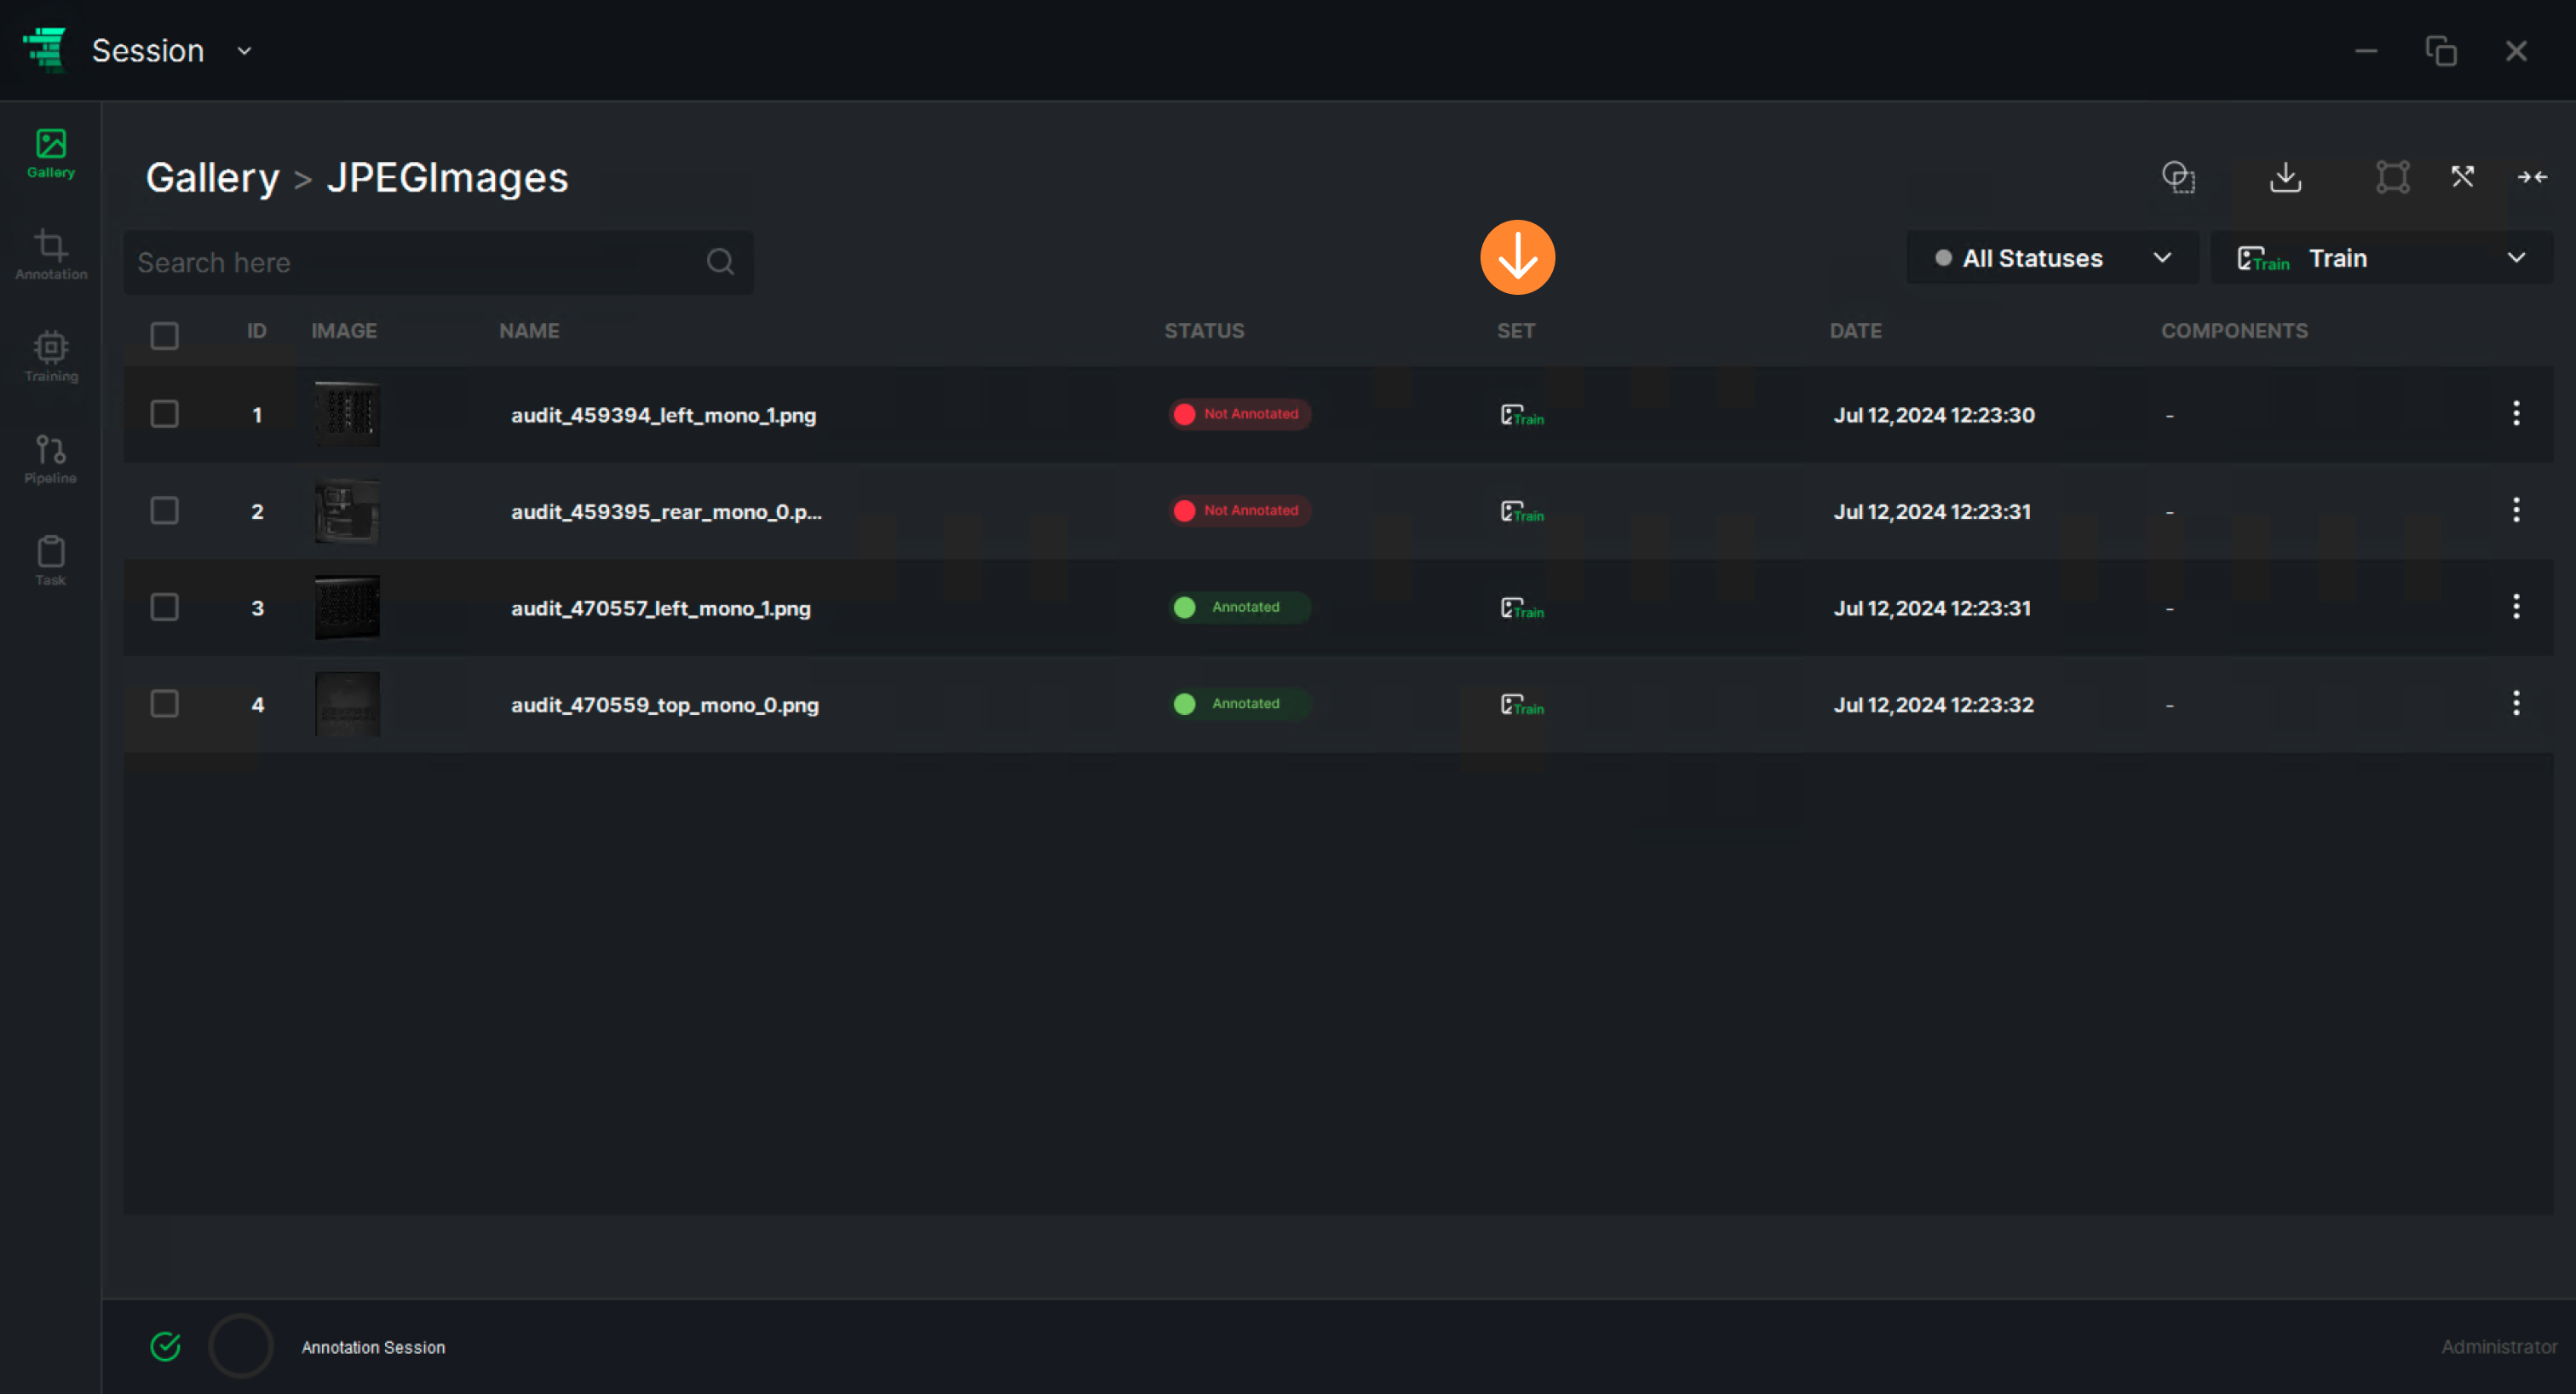
                • Filter images to train/test/unassigned sets and statuses to annotated/not annotated
                • Select image for annotation

                Import Annotated Data

                1. The Gallery screen shows the datasets with the image thumbnails. The user can create a new folder and import images or import annotated data. The user can import data by clicking on the “Import Data” button

                2. When the user selects the “Import Annotated Dataset” option and clicks the “Import” button, the import process initiates

                3. The user can select one of the following annotation formats:

                • LabelMe is the native format of Label Me
                • COCO is the common JSON format for machine learning
                • YOLO is the favored annotation format of the Darknet family of models
                • YOLOv3 is the third version of YOLO family formats
                • YOLOv4 is a format used with the Pythorch part of YOLOv4
                • YOLOv5 is a modified version of YOLO Darknet annotations
                • Classification imports image data organized in subfolders and automatically assigns each subfolder name as a label

                4. When the user selects the “COCO” option and clicks the “Import” button, the import process initiates

                5. The user should enter the folder directory. Once a file is selected, click on “Open”

                6. The imported data will be shown as a new imageset on the Gallery screen

                7. The user can check the annotated images by double-clicking on the imported folder. If any image is selected, the user can see the defined states and ROIs

                Export Data

                1. To export data, the user should choose a dataset folder from the Gallery. There are two options:

                • Click on the “More” icon () and select “Export” option to export all data
                • Double-click on the imageset. Once images are displayed, the user can select from the options: only this page, all images, or specific ones and then click “Export”

                2. When the user chooses the “Select only this page” option, the images on the current page are selected

                3. When the user chooses the “Select all images” option, all images in the folder are selected

                4. The user can export individual images or selected ones:

                • Click on the “Apply Operations” icon and then select “Export”
                • Right-click on the chosen images and then select “Export”

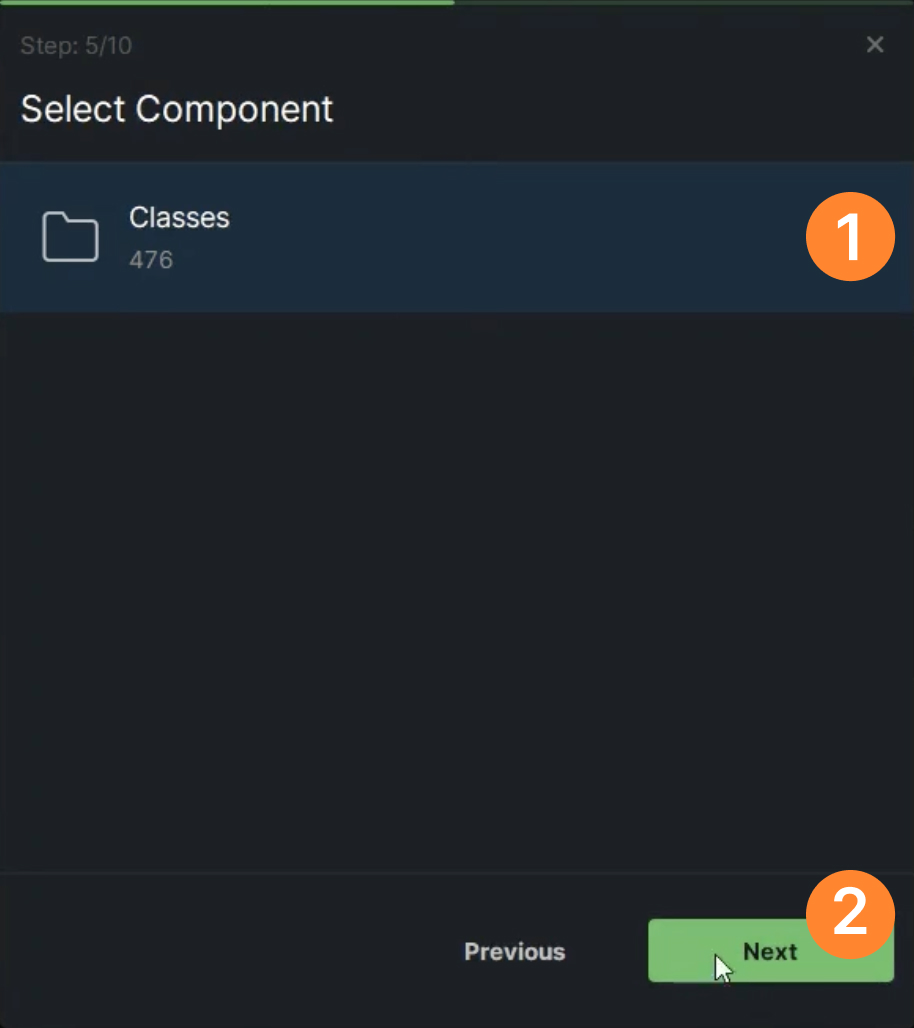
                5. Components can be selected among the existing ones. Once “Classes” is selected, click on “Export”

                6. The user can select the “Export Images” option to export images and “Add File Names” option to add file names to the exported data

                7. The user can choose one of the formats below:

                • LabelMe
                • COCO
                • YoloDarknet
                • Yolov3
                • Yolov4
                • Yolov5

                8. When the user selects “COCO” or any format and then clicks on “Export”, the export process initiates 

                9. The user should choose a directory and then click on “Select Folder” to save the data

                10. The exported image folder and their corresponding annotations file are shown in the designated directory

                11. The user can check if the data has been correctly exported and saved in the designated directory

                ReliUI: Data Curation
                Quality Automation with AI and Relimetrics

                Dataset Operations

                Extract ROIs

                1. The Gallery screen shows the imagesets with the thumbnails. The user can extract ROIs of an image folder. Once extracted, the Gallery will display an image folder containing these ROIs. To export this folder, simply click on “More” icon () and select “Extract”

                2. Group names correspond to ROI groups within the imageset. By checking the checkbox “Group Name”, the user can export all ROI groups. The user can individually select ROI groups by clicking on the component name and then “Extract”

                3. Once extracted, the Gallery will display an image folder containing these ROIs

                4. The user can check the imageset by double-clicking on the imported folder. If any image is selected, the user can see the ROIs

                5. The user can export these ROIs by clicking on “More” icon () and selecting “Export”

                6. The user should select “Label Me” or any format and then click on “Export” to start the exporting process

                7. Among the existing components, users can make selections. The user can either export ROIs along with the images by checking the “Export Images” button or export ROIs separately without the images. Once the component names “Classes” and “Export Images” are selected, click on “Export”

                8. The user should choose a directory and then click on “Select Folder” to save the data 

                9. The user can check if the data has been correctly exported and saved in the designated directory

                Merge & Download Dataset

                The user can operate the below options in the Gallery screen;
                - Merge image sets
                - Download image sets from the server 
                - Crop & Rotate images

                1. The user has the option to merge image sets either by clicking on the “Merge” icon on the top-right or by selecting the “More” icon () in the folder’s options menu

                2. Once clicked, select the desired image sets and specify the Merge output folder

                3. If the user clicks on “Delete input imagesets” option, selected input image sets will be deleted

                4. Once all selections are done, click on “Merge” button

                5. The merged image set will be displayed in the gallery

                6. The user can download/retrieve image sets from the server by first entering the URL and choosing the desired data from the available choices

                7. Once selected, clicking “Next” will initiate the downloading process

                8. The new image set is added to the gallery. The user can check images by double-clicking on the image set folder

                9. The user can “Crop & Rotate” an image set by selecting the “More” icon () in the folder’s options menu

                10. Enter the parameters and click on “Crop” or “Load defaults” buttons and then “Extract”

                11. The cropped and extracted imageset will be displayed in the Gallery

                12. The user can check images by double-clicking on the image set folder

                ReliUI: Data Curation
                Quality Automation with AI and Relimetrics

                Data Annotation

                ROI Annotation

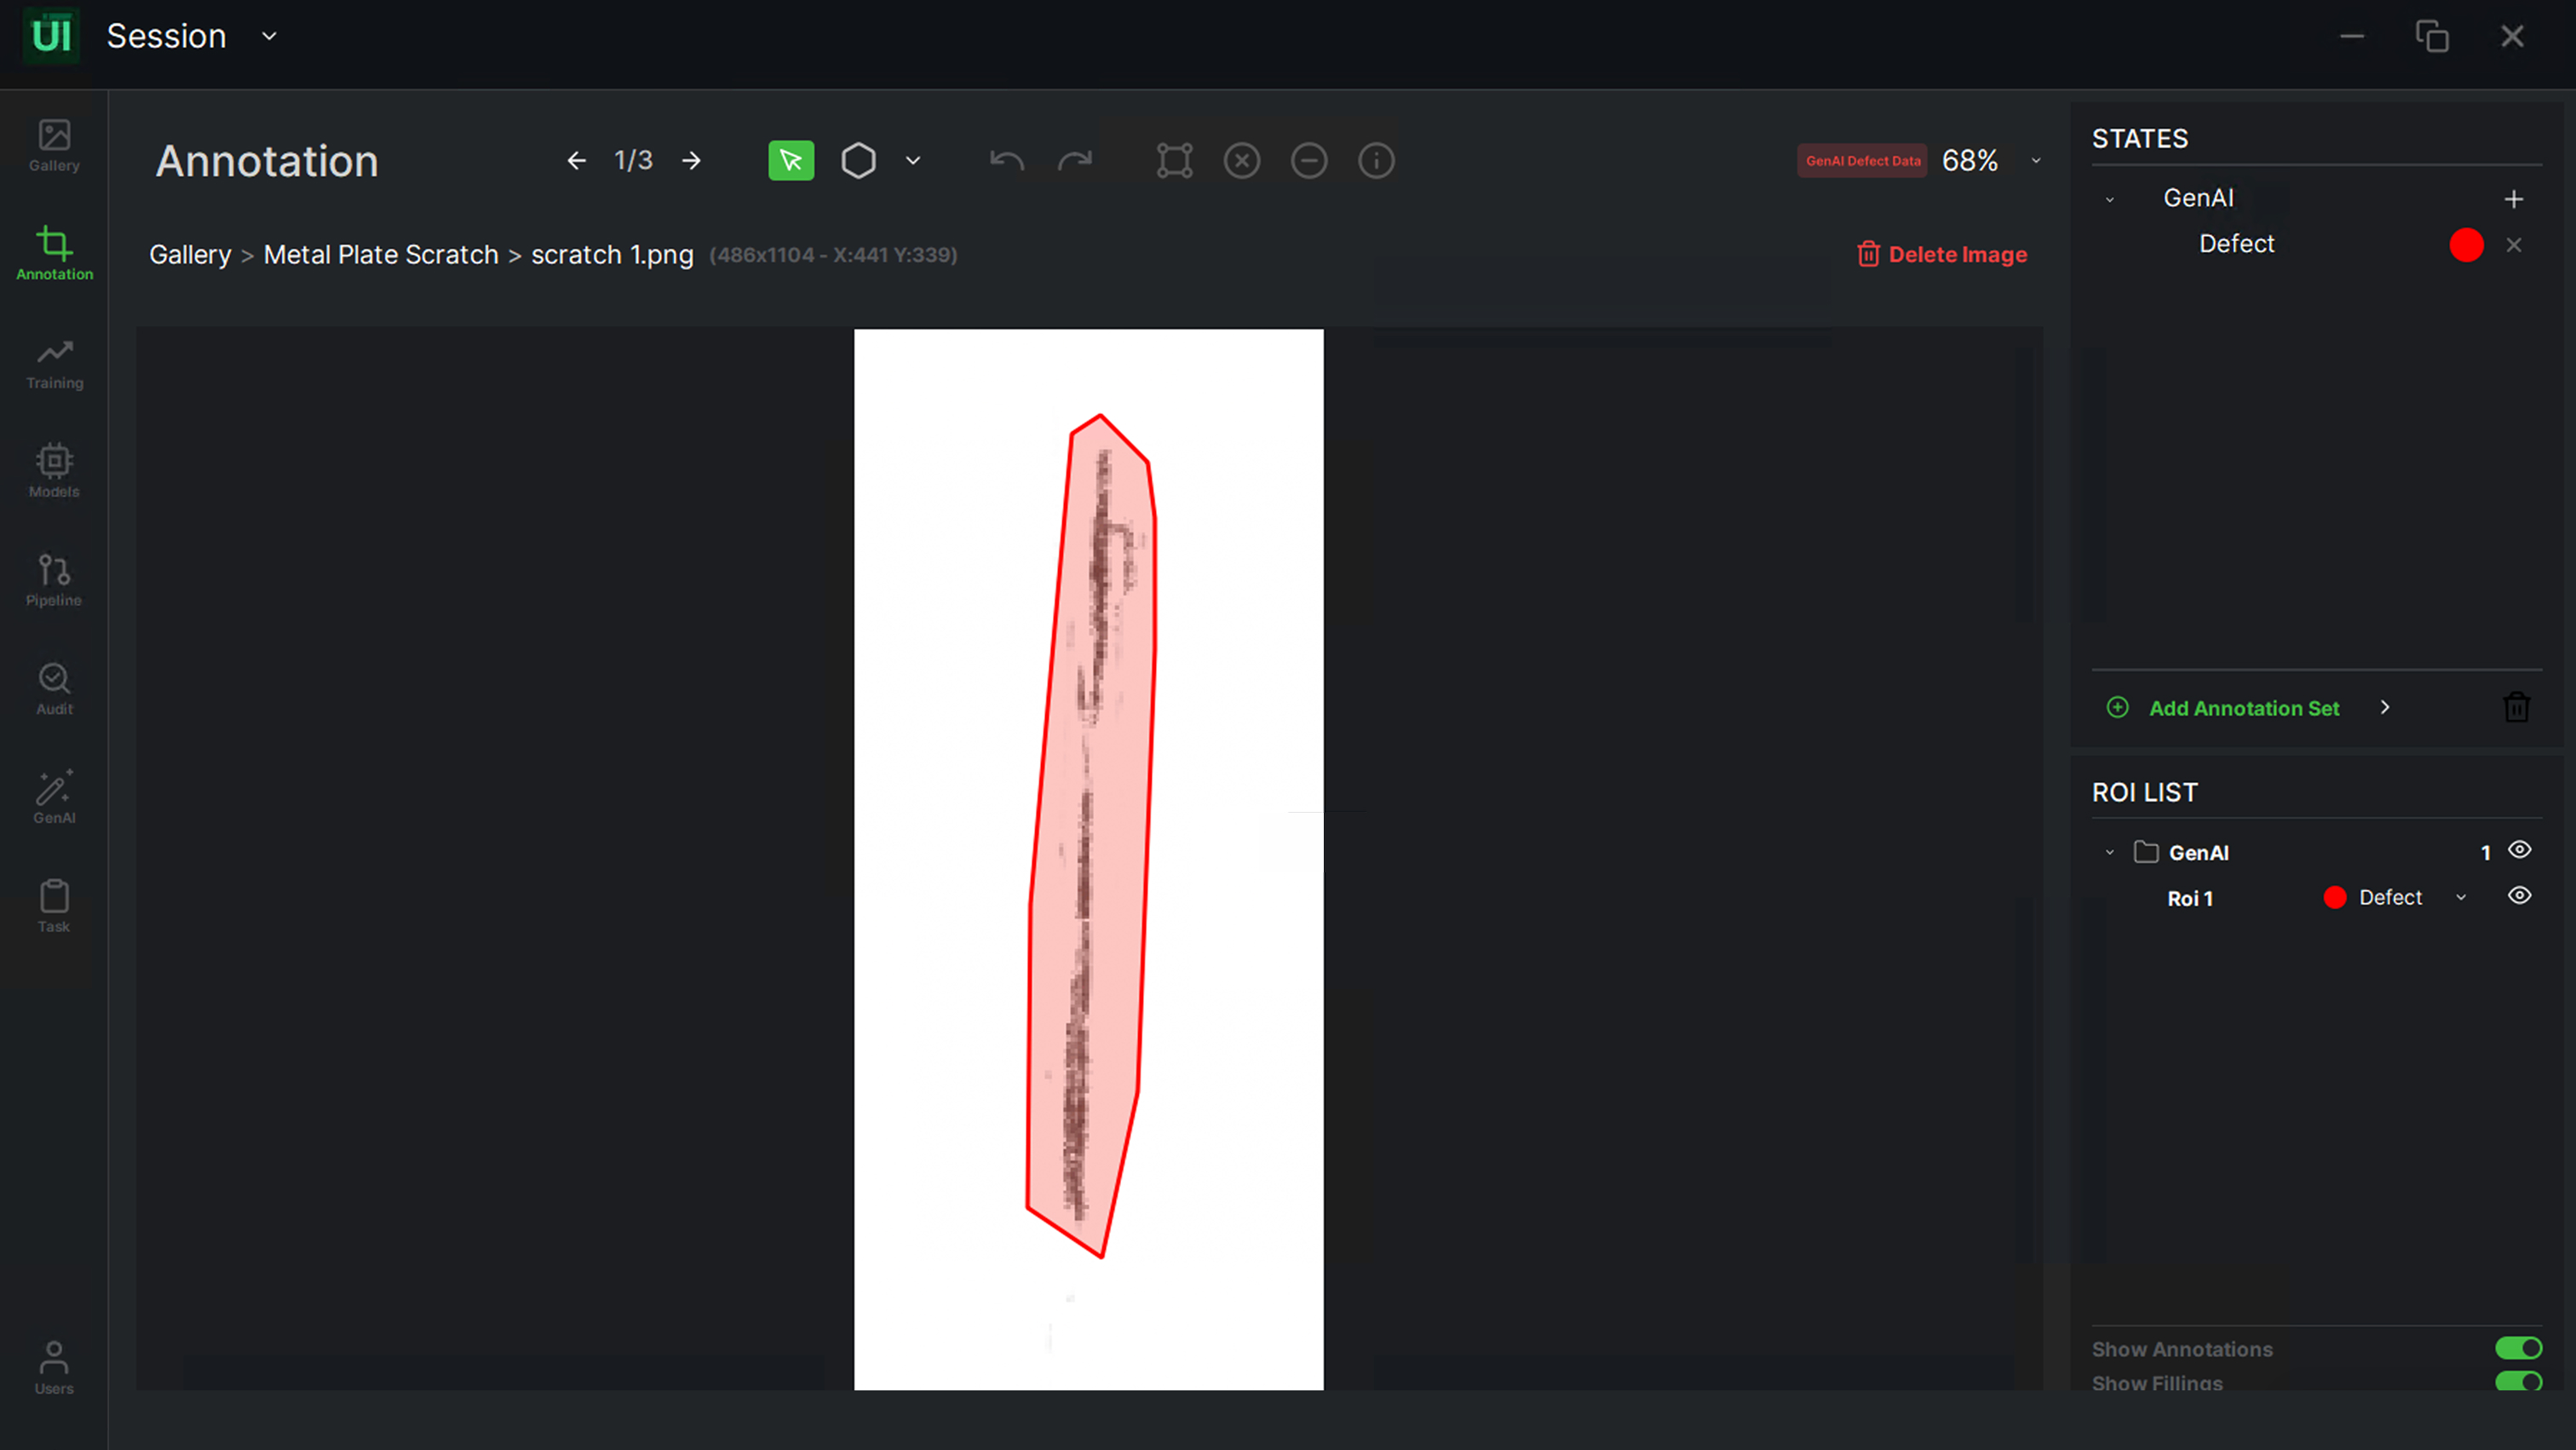
                The image annotation screen offers drawing and editing tools that enable users to manually annotate an image. These operations are carried out within the context of the currently displayed image. The user can:
                • Navigate between images within an active image set
                • Zoom and pan an image using CTRL + Mouse Wheel
                • Generate regions of interest using basic shapes like rectangles and polygons
                • Specify classes and states for these regions of interest
                • Choose distinct colors for each class and/or state by color picker
                • Adjust existing regions of interest by modifying their properties (name, size, position, states), duplicating, or deleting them
                • Create a parent-child hierarchy to semantically group regions of interest

                1. In the Gallery, the user should select a dataset to initiate the annotation process

                2. The user can start the annotation by clicking any image from the image folder

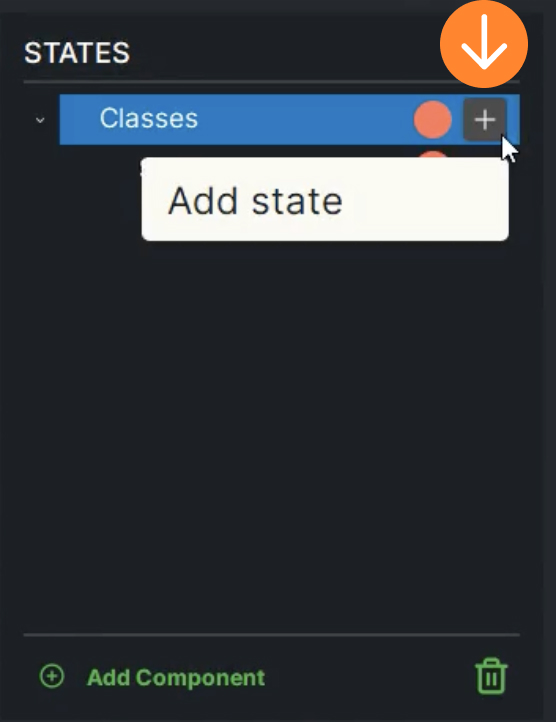
                3. The right-side menu plays an essential role in the annotation screen, consisting of two primary sections: States and ROI List. In the States section, the user can create, edit, or remove components (classes). States can be added to any predefined class. To create a new component, the user simply clicks on “Add Component”

                4. First, the user should define the component name (E.g. Classes) and add new states (E.g. OK, NOK) click on “Add New Label” and finally click on “Create”

                5. Once the component is created, the user can add a new state by clicking on the (+) icon to include additional states

                6. A different color can be assigned to every component or state through the color picker

                7. Annotation Toolbar is located horizontally at the top of the Annotation Screen. Each tool in the toolbar is represented by an icon. The user should select the “Draw” icon to create ROIs

                8. Based on the use case, the user can choose the appropriate annotation shape options below:

                • “Rectangle” is for area annotations
                • “Polygon” is for roughly or perfectly outlined annotations
                • “Whole Image” is for annotation without the region specification of the object

                9. If the “Rectangle” option is selected, the user should define the ROI by drawing it

                10. If the “Polygon” option is selected, the user should define ROI by connecting straight lines

                11. Once an ROI is drawn, the user can select the appropriate defined class/state from the provided list

                12. Once all the ROIs in the current image are defined, the user can proceed to the next image by either clicking on the arrows at the top or by using the shortcut CTRL+D

                13. By clicking on any ROI, the user can modify its dimensions by adjusting its size as needed. Also, the user can delete an ROI by selecting and then pressing the “Delete” key on the keyboard

                14. The user can copy and paste the same ROI by clicking on “CTRL+C”

                15. Once the annotation is completed, the image's status is automatically changed to “Annotated” in the status column

                Whole Image Annotation

                Annotating the whole image without region specification

                1. In the Gallery screen, the user should select a dataset to initiate the annotation process

                2. The user can start annotation by clicking any image from the image folder

                3. The user should select “Whole Image” option to annotate the image without any region specification

                4. After choosing the “Whole Image” option from the annotation toolbar and then clicking on the image, a pop-up for states/components will appear. Simply click “Add Component” to continue with the annotation process

                5. First, the user should define the component name (E.g. Classes) and add new states (E.g.Router) click on “Add New Label” and finally click on “Create”

                6. The user can change the color of the component through the color picker

                7. Once all the ROIs in the current image are defined, the user can proceed to the next image by either clicking on the arrows at the top or by using the shortcut CTRL+D

                8. Once a “Whole Image” ROI is drawn, the user can select the appropriate defined class/state from the drawn box. Also, the user can delete an ROI by selecting and then clicking the “Trash” icon in the top toolbar. Annotation can be repeated with identical steps for all images

                9. Once the annotation is completed, the image's status is automatically changed to “Annotated” in the status column

                10.  The user can double check the annotated images by clicking on the imageset

                Review and Manage Annotated Dataset

                The user can edit, review or manage annotated images. The user can:
                • Display images
                • Split image sets into training and test sets automatically with a random split or manually balance classes in train/test sets
                • Filter images to train/test/unassigned sets and statuses to annotated/not annotated
                • Load New Images
                • Apply Additional Operations
                • Select an image for annotation
                • Edit ROIs States
                • ROI list details: show/hide annotations, show/hide fillings

                1. In the image list, “Edit ROIs States” allows the user to change the state of ROIs

                • From the available “ROI Groups”, the user can make the selections. When the component name “Classes” is chosen, simply click on “Next” to proceed
                • When the “Select all ROIs” checkbox is marked, it allows the user to choose all ROIs collectively. Alternatively, specific ROIs can be individually selected or deselected from the list
                • The user should first choose one of the defined states to assign a state as a new ROI for the dataset. After selecting a state, click on “Copy” to confirm the assignment

                2. The dataset will be updated with the “New state/states”. The user can review them in the ROI LIST

                3. “Load New Images” allows the user to upload images locally

                4. The user should select an image from the directory. Once an image is selected, click on “Open”

                5. The imported image will be shown in the image list

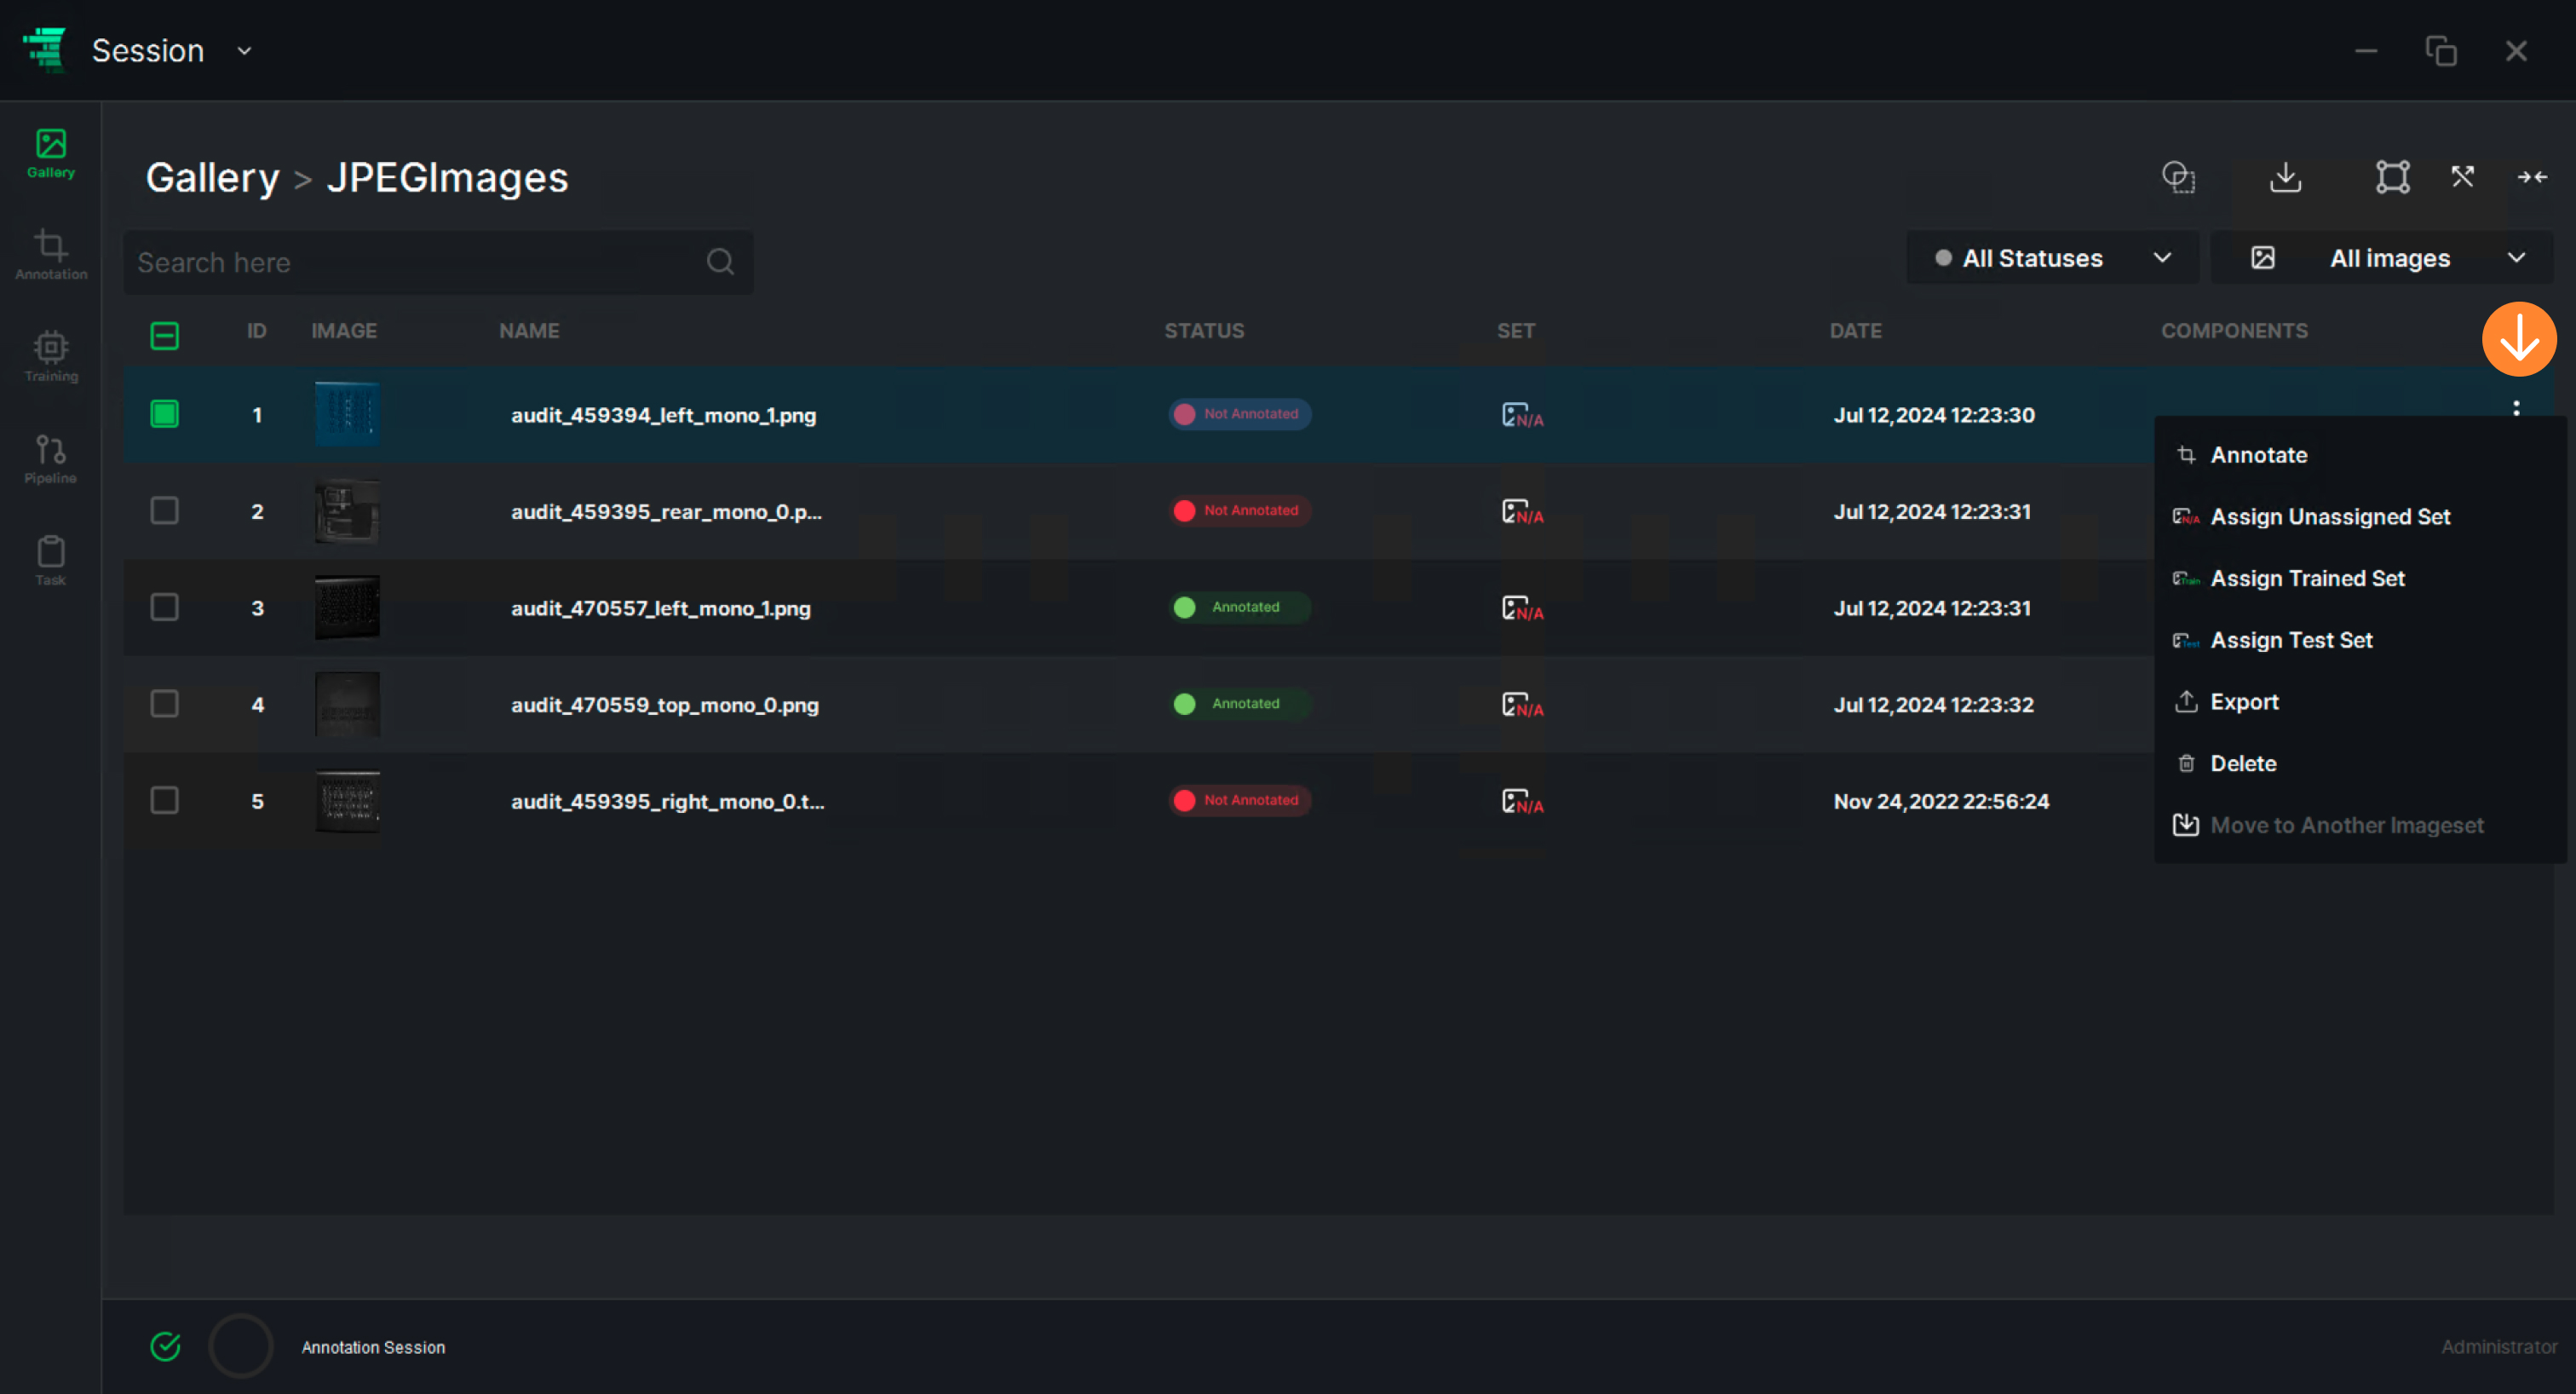
                6. “Apply Operations” allows the user to perform multiple operations. To enable this function, the user should choose “Only this page” or “Select all images” option to select images

                7. Once “Apply Operations” dialog box is displayed, the user can:

                • Export or Delete images by clicking on these selections
                • Move images to another dataset by selecting Move to Another Imageset

                8. “Split Images” allows the user to split images before the training as Train/Test Sets with three options

                9. As the dataset is split, the image status will change from “Unassigned” to “Train/Test Sets”

                10. “Clear Sets” allows the user to clear all the current statuses. The new statuses of the images will change to Unassigned Set

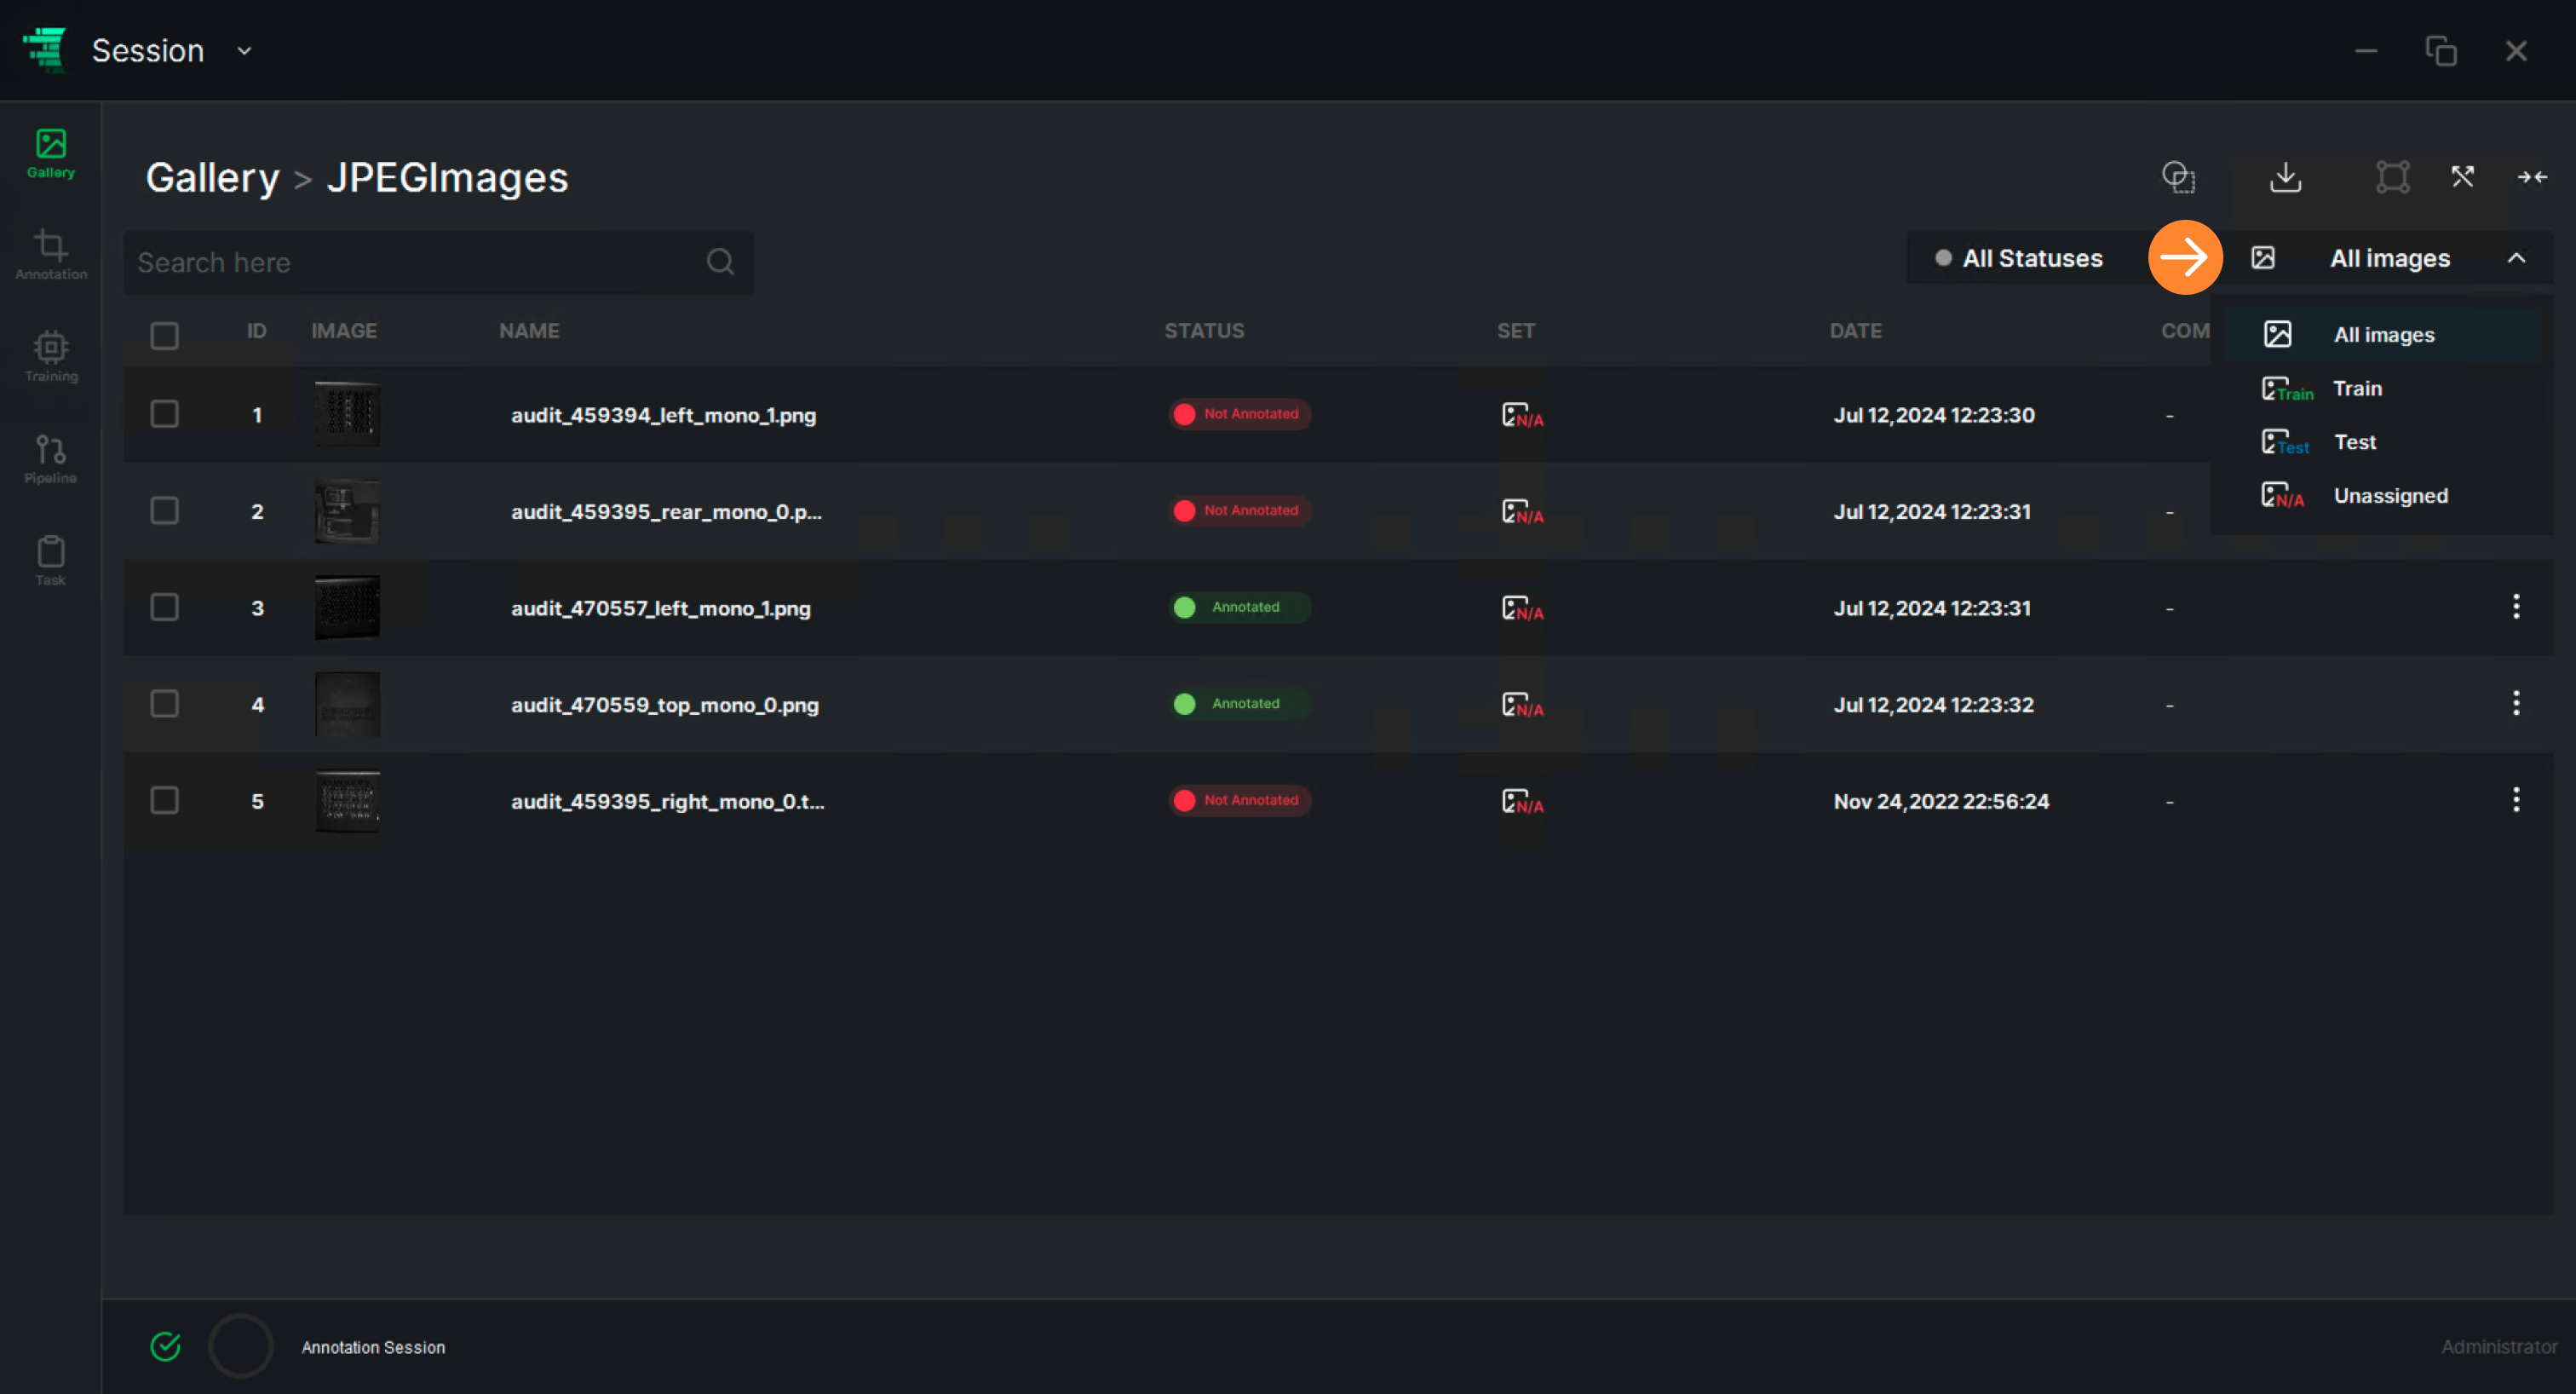
                11. “All Statuses” option enables the user to filter images based on “Annotated” or “Not Annotated” statuses. Upon selecting either of these options, the list view will be automatically updated to reflect the chosen filter

                12. “All Images” allows the user to filter the images by selecting Train/Test/Unassigned statuses. Upon selecting either of these options, the list view will be automatically updated to reflect the chosen filter

                13. If the user clicks on the “More” icon () on the right, a dialog box will be displayed containing functions similar to “Apply Operation”

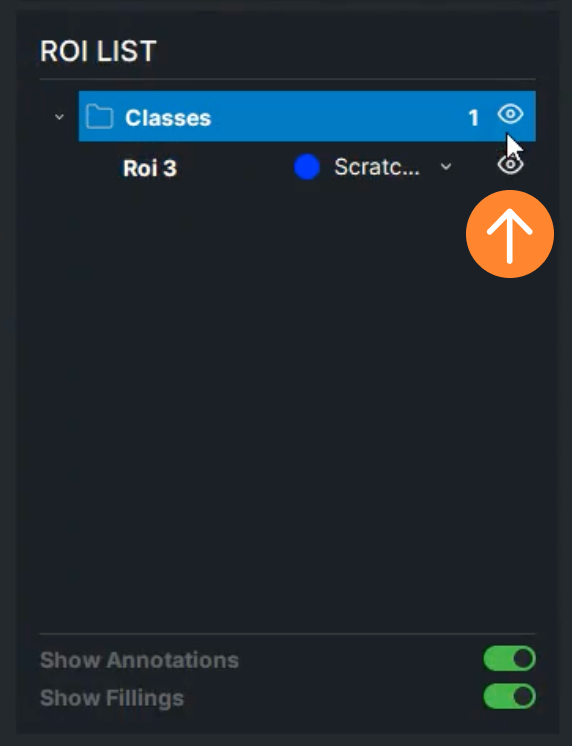
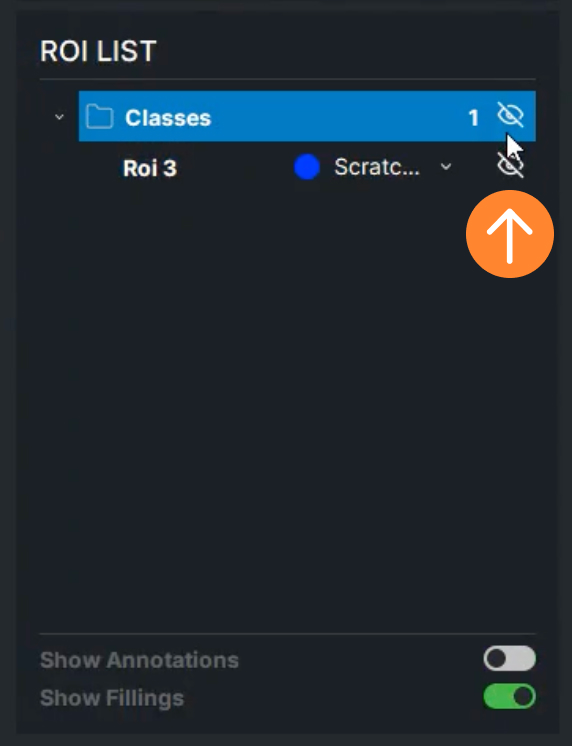
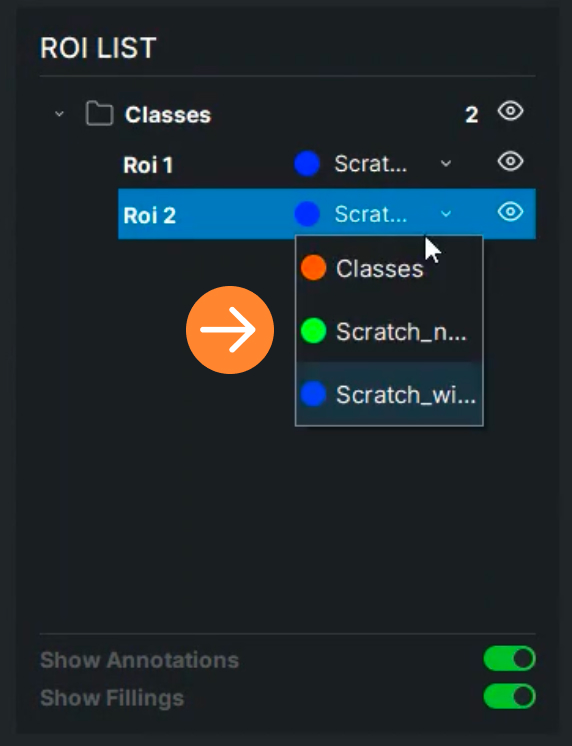
                14. In the annotation screen, ROI LIST displays the defined Regions of Interest. The user has the option to switch the visibility of these ROIs by clicking on the “View” icon

                15. The user can change the ROI states by selecting options from the dropdown menu

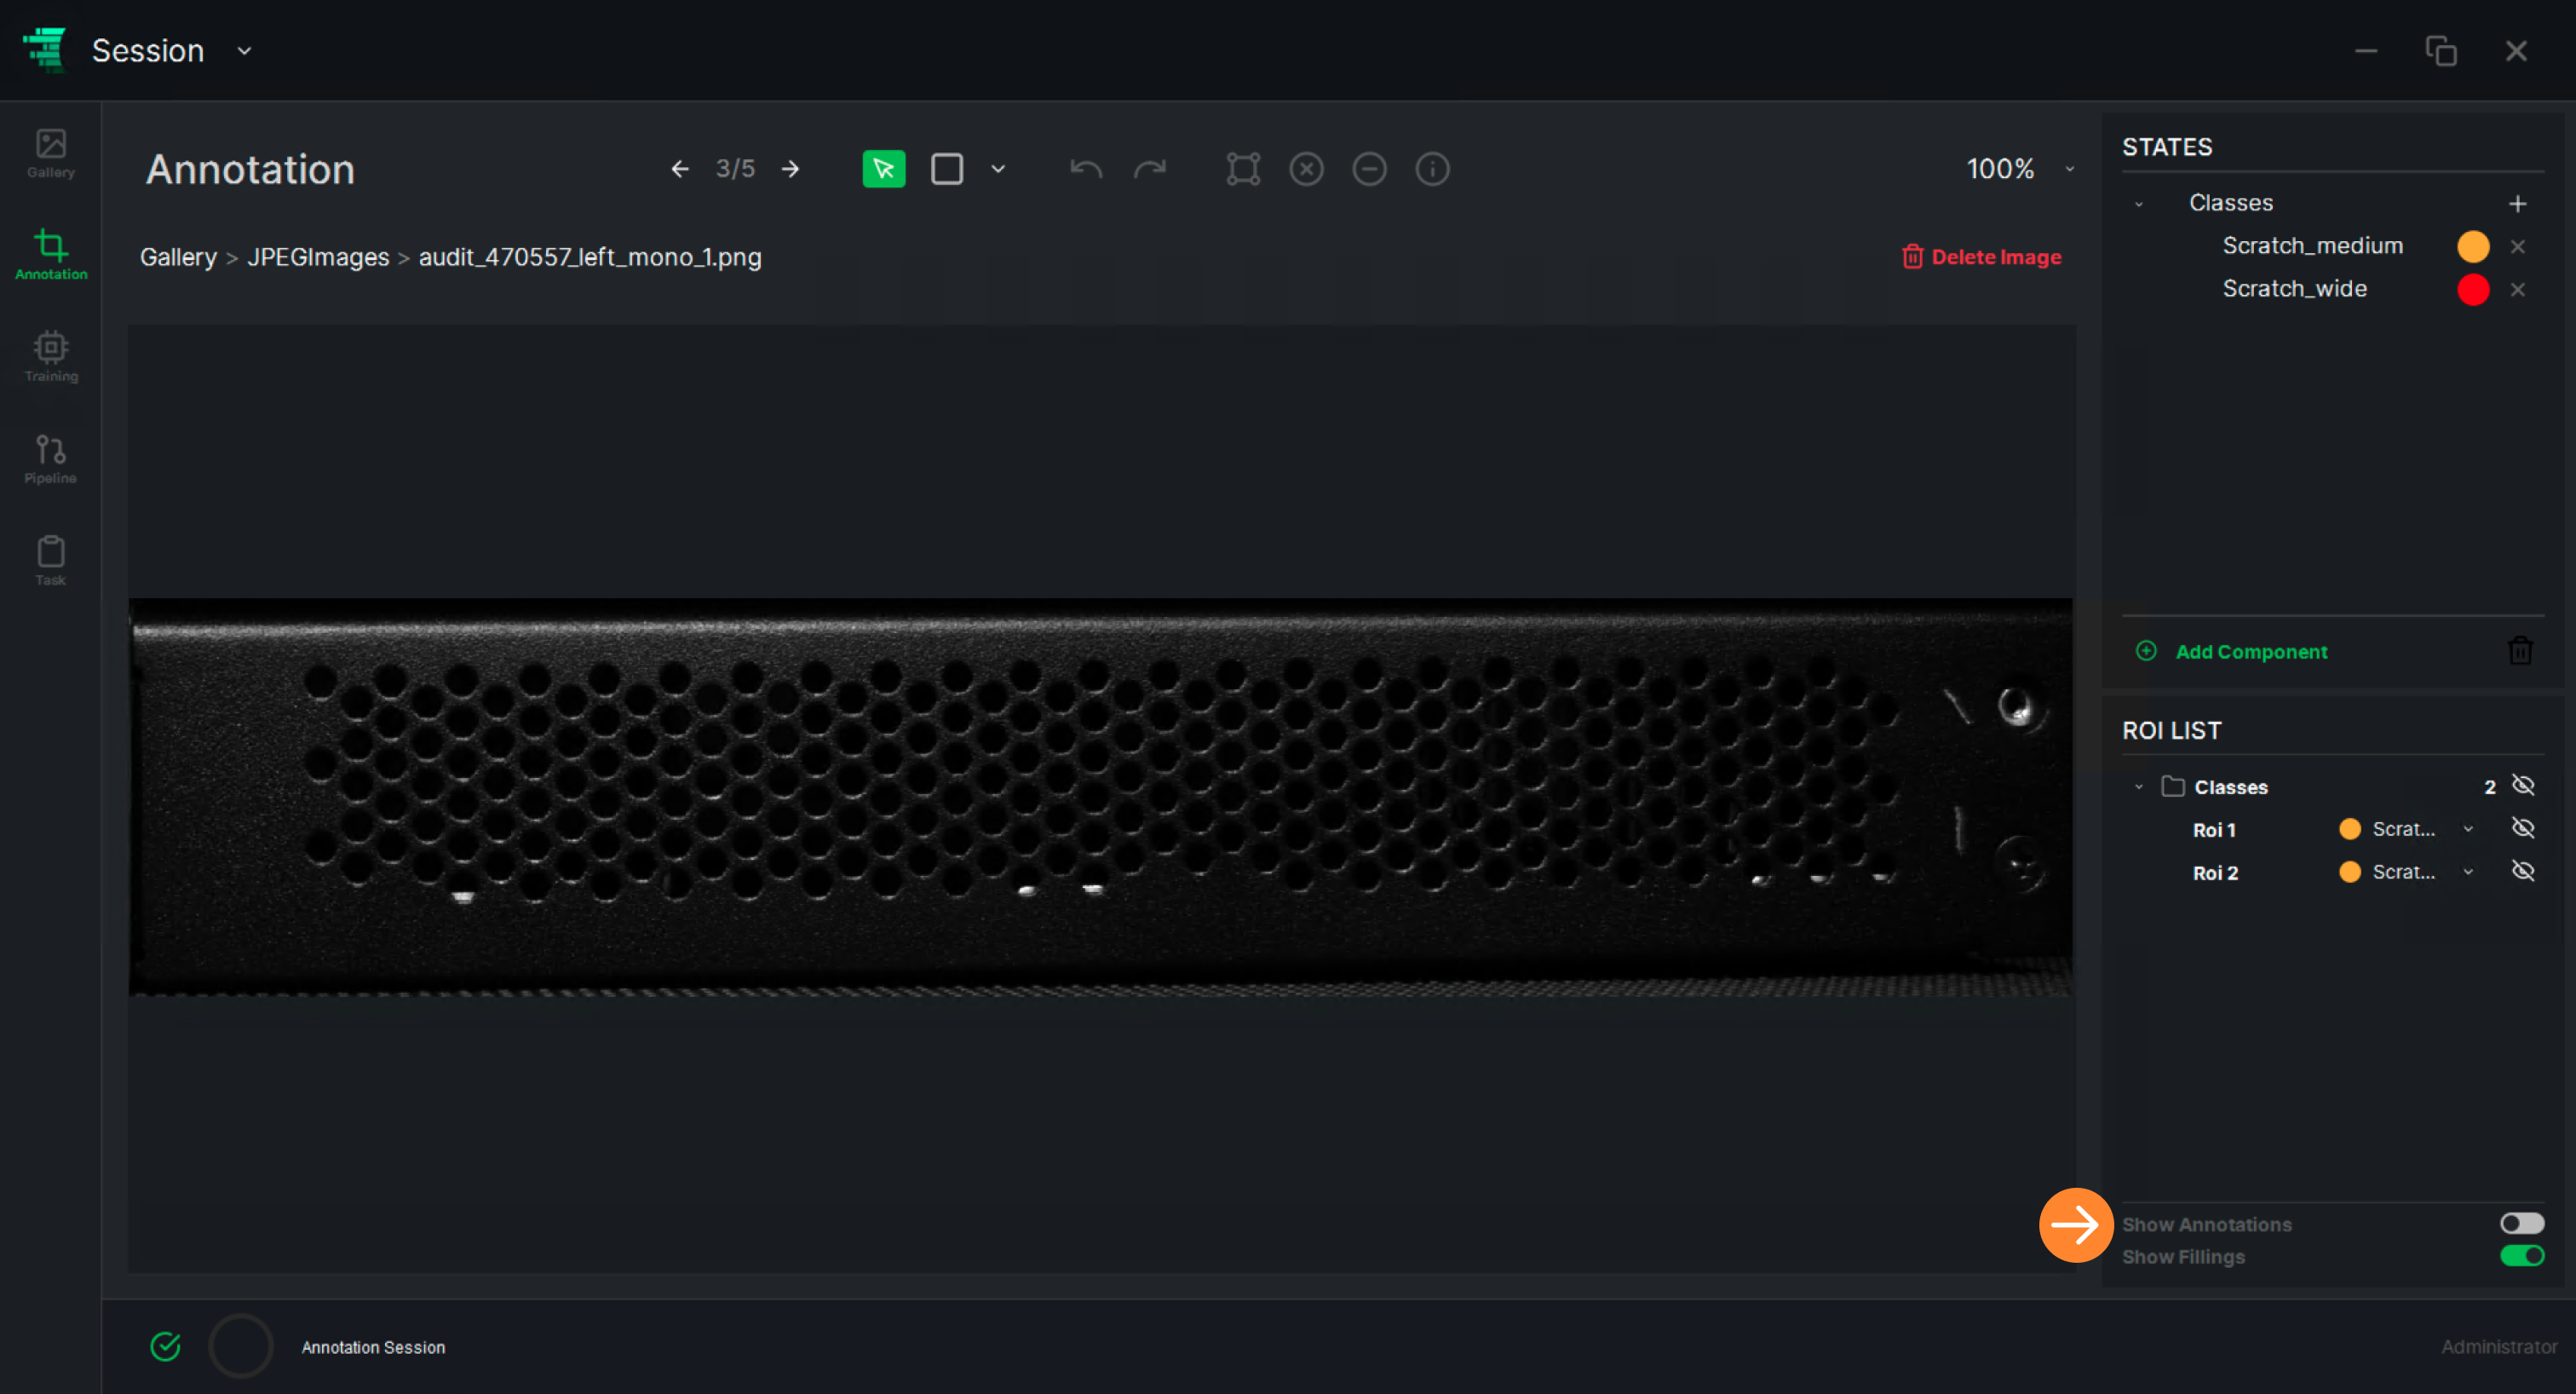
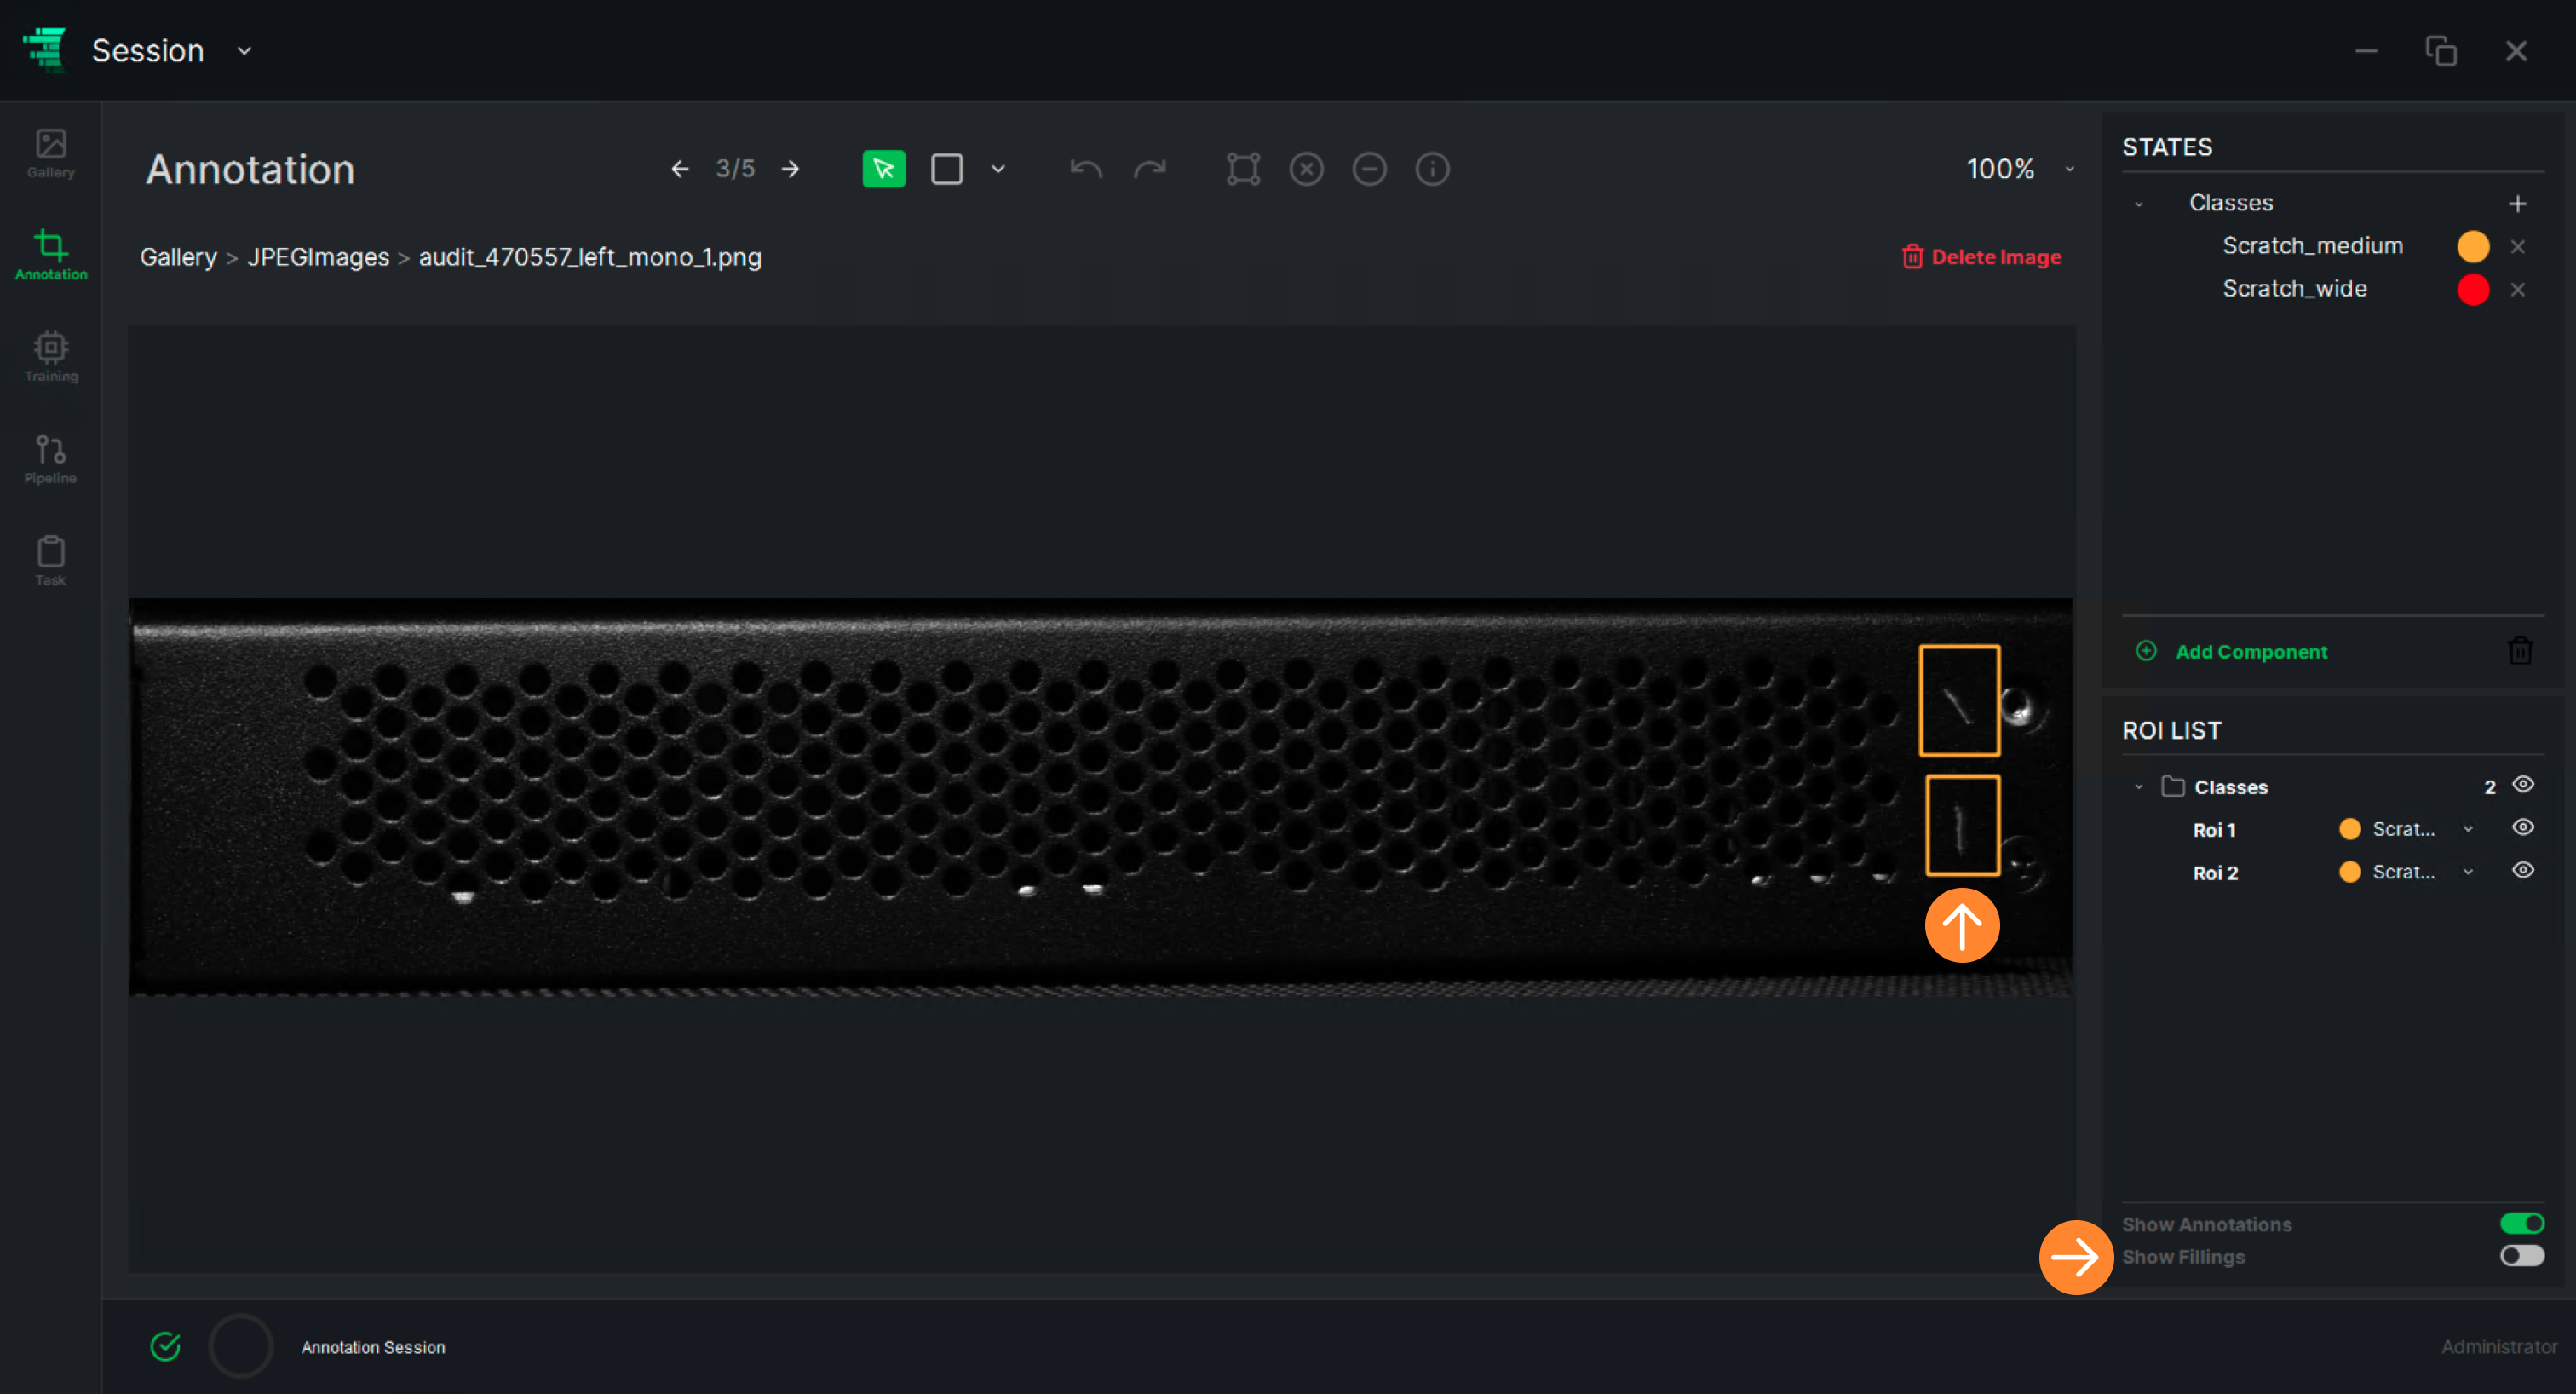
                16. “Show Annotations” switch button allows the user to show/hide annotations

                17. “Show Filling” switch button allows the user to show/hide the ROI fillings. If the fillings are hidden, only the edges will be displayed

                Quality Automation with AI and Relimetrics

                AI Model Train / Test

                AI powered solution design-train/test-build functions of the ReliVision are provided by the ReliTrainer which is accessible through the user friendly ReliUI application. You can train detection, segmentation and classification models, test your models, build complex visual analytics pipelines using your trained AI blocks (AI models) together with Basic blocks (Digital signal/image processing - DSP/DIP - functions). 

                Refer to ReliTrainer user guide for further details. AI Model Train/Test functions are available with a licensed ReliTrainer.

                Quality Automation with AI and Relimetrics

                Deployment

                AI powered visual analytics solutions that are built, trained and tested, can be deployed to ReliAudit through the user friendly ReliUI interface. The deployed solutions are run, managed and monitored at the edge by the ReliAudit. The user feedback received from the ReliAudit can also be pulled back to ReliTrainer via ReliUI for retraining. 

                Refer to ReliAudit user guide for further details. Deployment functions are available with a licensed ReliAudit.

                Quality Automation with AI and Relimetrics

                ReliTrainer: Design & Train

                Design-Train functions of ReliTrainer module provide AI powered solution designing, training and testing services. These services are provided through the desktop application ReliUI that communicates with the ReliTrainer module.

                The pipeline editor is central to AI powered end-to-end solution designing, training and deploying with ReliVision. A pipeline is composed of AI blocks (AI models) and Basic blocks (Digital signal/image processing - DSP/DIP - functions). Basic blocks cover fundamental algorithmic operations such as the openCV functions and statistical operations. AI blocks are AI models trained to perform inspection specific tasks, e.g. detection, classification, segmentation. The pipeline editor allows users to build complex processing and analysis pipelines using an intuitive drag-and-drop interface by selecting from an increasing menu of Basic blocks and any AI block the user has trained. The pipelines, thus built, are deployed to ReliAudit.

                Training an AI block

                Select a pre-implemented SoA AI model from ReliVision’s rich AI model library to train to perform supervised detection (based on YOLOv5, YOLOv7), classification (based on Resnet, Convnext, Mobilenet, GPUnet), semantic segmentation (Unet3Convnext4xDS).

                Set the training hyperparameters (number of epochs, image resolution, learning rate, momentum, weight decay) or use the default values.

                Select an annotated dataset and start training by simply hitting the “Train” button and monitor its progress via loss and accuracy curves. The system outputs the best performing model when the training is manually aborted or the maximum epoch number is reached. The validation set performance of the output model is reported in the Evaluation screen.

                Testing an AI block

                Select a trained AI module to run on any annotated dataset available in the data registry.Run prediction and review individual outputs as well as summary performance metrics (IOU, mAP) in case there is a reference label set.

                Pipeline Editor

                Pipeline Editor is designed to allow you to build complex inspection processes by combining AI blocks (segmentation, detection, classification, etc.) and digital signal/image processing functions as a series of interconnected operations. 

                - Empower users to create, manage, and optimize customized inspection pipelines tailored to their needs
                - Build a pipeline using an intuitive drag-and-drop interface
                - Execute a pipeline
                - Preprocess the data using options from the menu
                - Save data to the server after processing
                - Download data from the server to the Gallery
                - Use the processed data for AI-related tasks 

                ReliTrainer: Design, Train, Deploy
                Quality Automation with AI and Relimetrics

                Live View

                Choose a camera for live view and take images.

                Build a dataset that can be annotated using Data Curation functions for training.

                ReliTrainer
                Quality Automation with AI and Relimetrics

                Training an AI Block

                ReliVision offers a rich set of state-of-the-art pre-implemented AI models for detection, semantic segmentation and classification tasks. Each set of models comes at different complexity levels offering to trade off between performance and speed. You can adjust the training hyper-parameters (number of epochs, image resolution, learning rate, momentum, weight decay) or use the default values. The training dataset is automatically split into training and validation subsets, which you can also manually change. You can monitor the loss and the validation performance as training proceeds, as well as abort at any point.

                All functions are accessible through the ReliUI’s training screen. 

                1. In the Gallery screen, the user can check the images and the annotations before starting the training

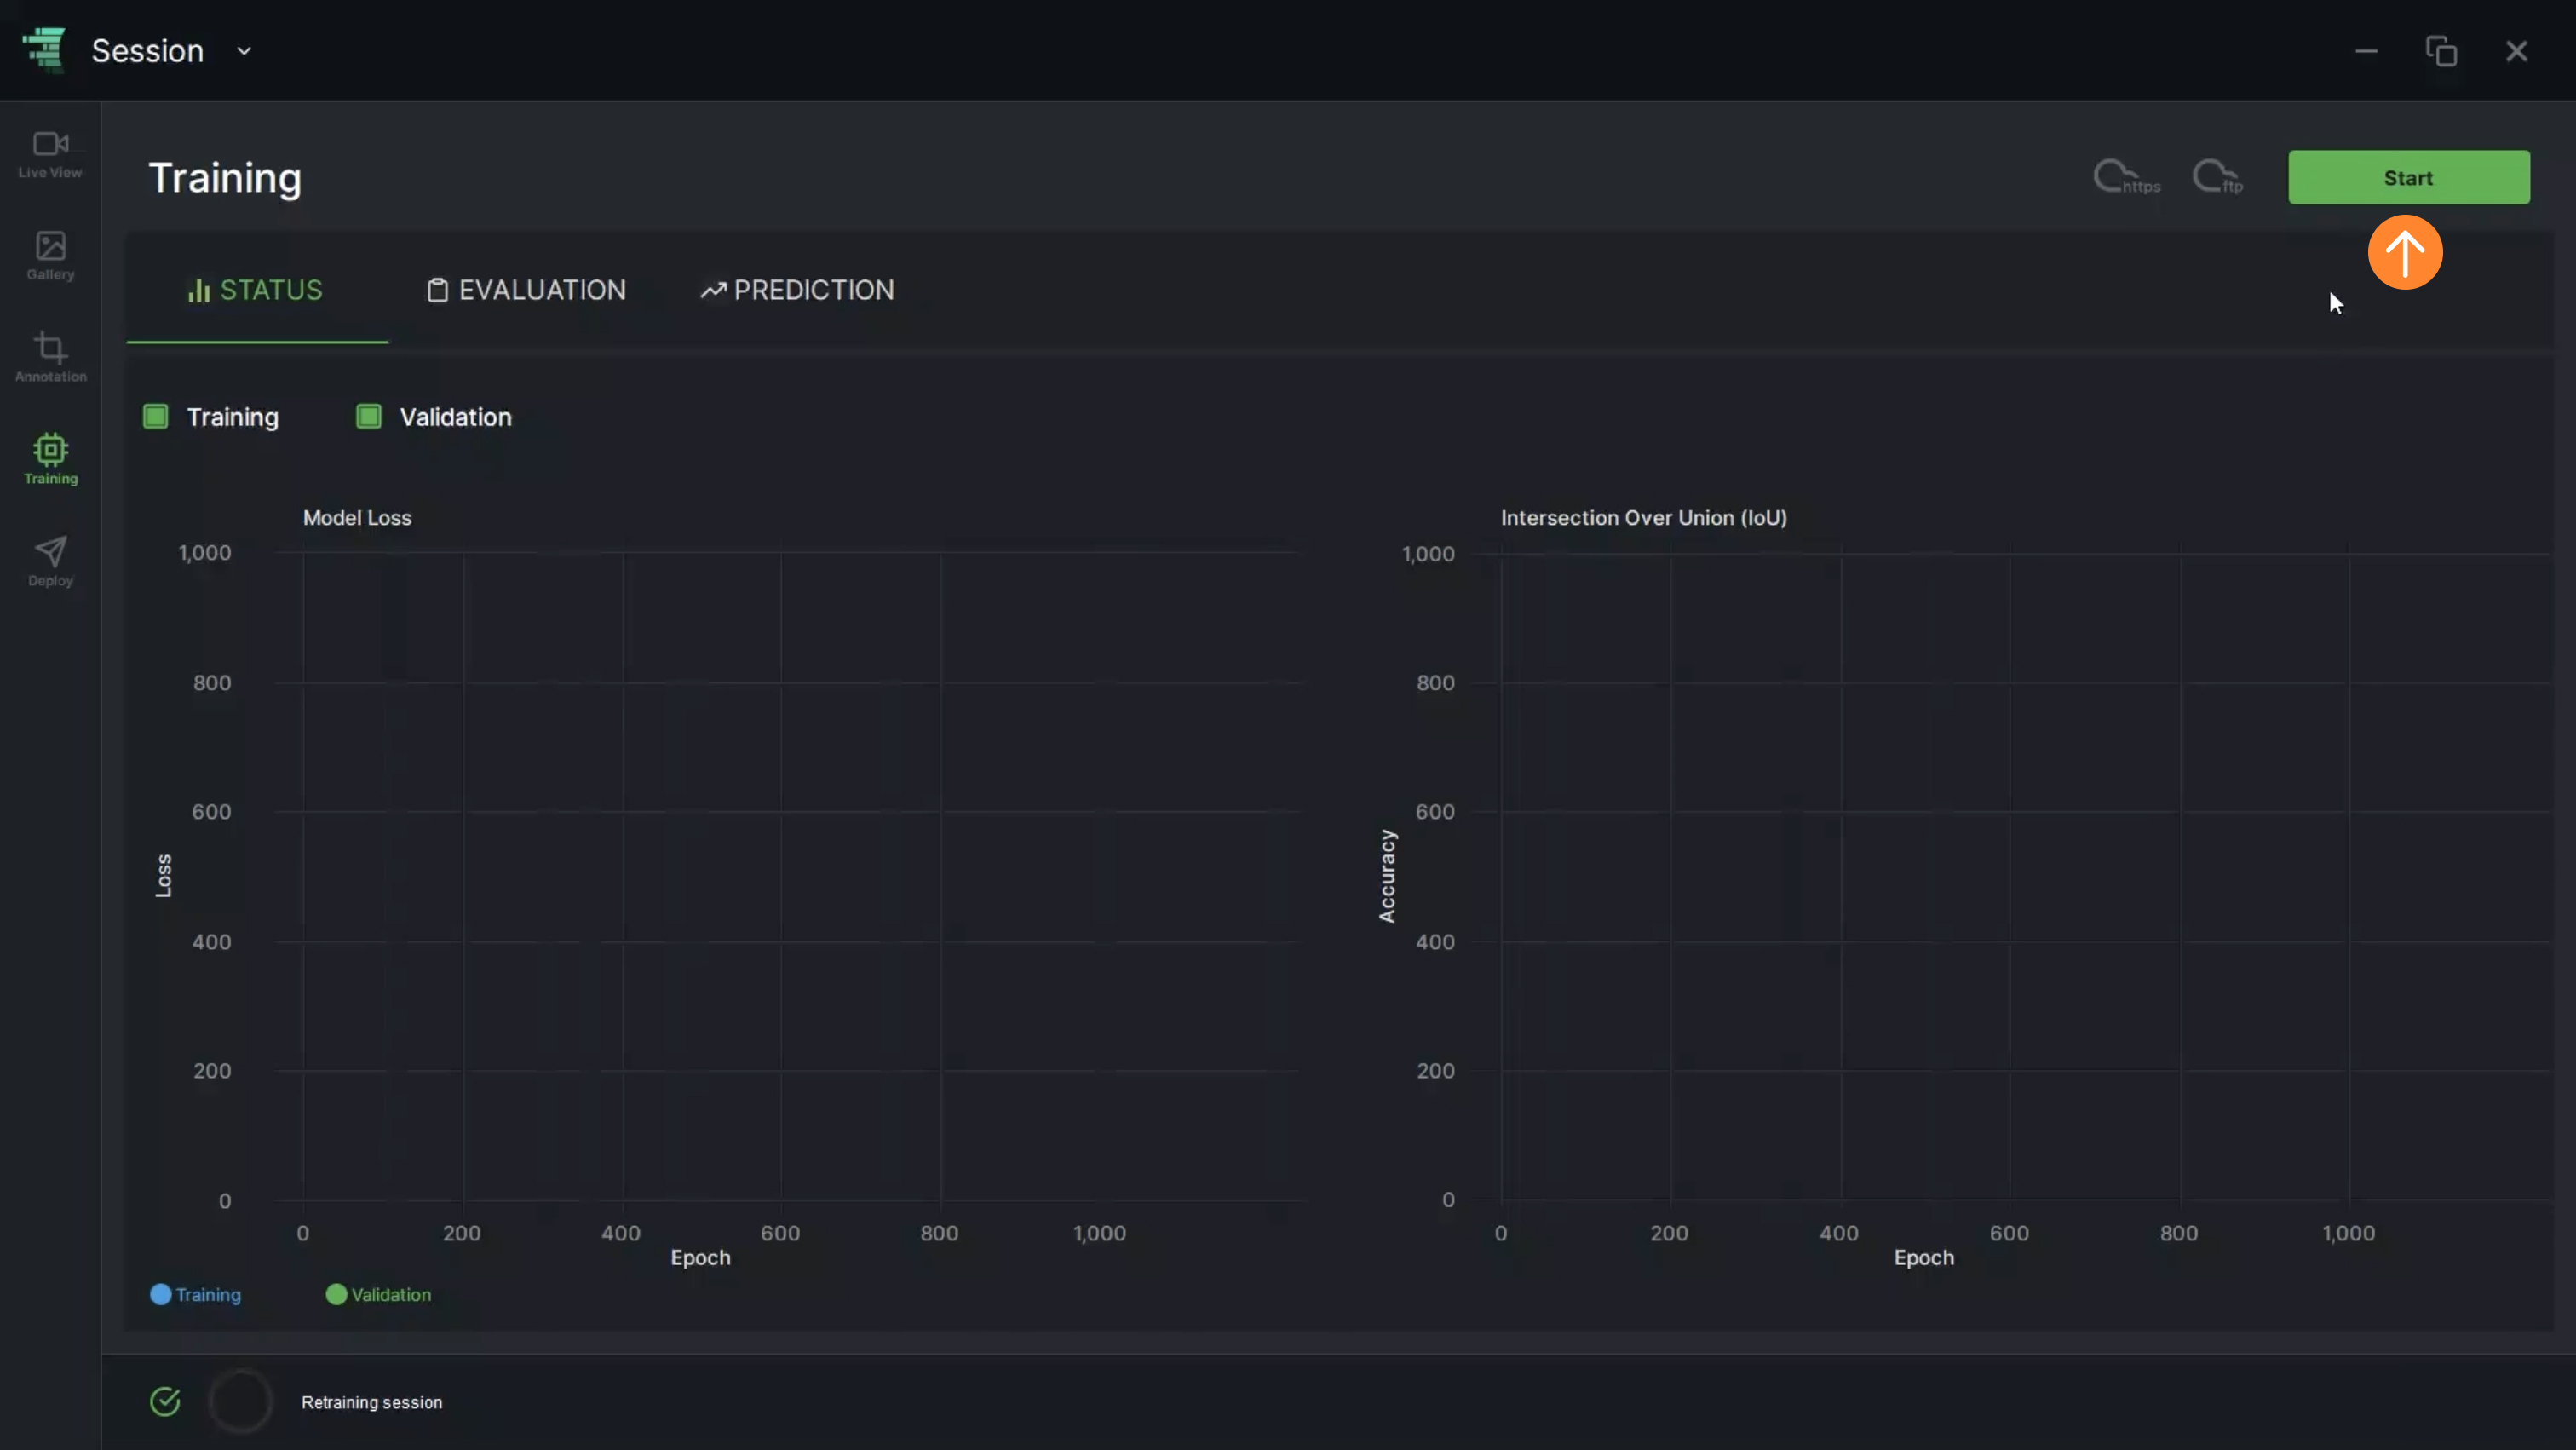
                2. In the left menu, go to “Training” and click on “Start” to train the model from the scratch

                3. The user should select “AI Training” to train a model from scratch and click on “Next”

                4. A Training Type should be selected from the options below:

                • “Detection” is utilized in the process of identifying and categorizing object regions
                • “Classification” is utilized for classifying regions of interest (ROIs)
                • “Semantic Segmentation” is utilized to precisely detect object shapes
                • “Anomaly Detection” is utilized to identify irregularities in the input images

                5. If an object detection model will be trained, the user should choose “Detection”. After selecting it, click on “Next” to proceed

                6. If the imageset hasn't been split previously, it should be divided into a Train Set and a Test Set at this stage. Once the split is completed, the user can proceed by clicking the “Next” button

                7. If the user forgets to annotate the data, a notification will appear on the screen, stating that the image set has no annotation.

                8. After selecting the component name, click on “Next”

                9. Detecting the optimal architecture for the training is done automatically. Settings can be reconfigured from “Advanced Options” if needed

                10. The user can select a network architecture between the “Advance Options” options:

                • “ReliNetDet-Small” can be chosen for a small-size network
                • “ReliNetDet-Medium” can be chosen for a normal-size network

                Once it is selected, click on “Next” 

                11. The user should define a model name (e.g. Scratch_Detector) according to the use case, then click on “Next”

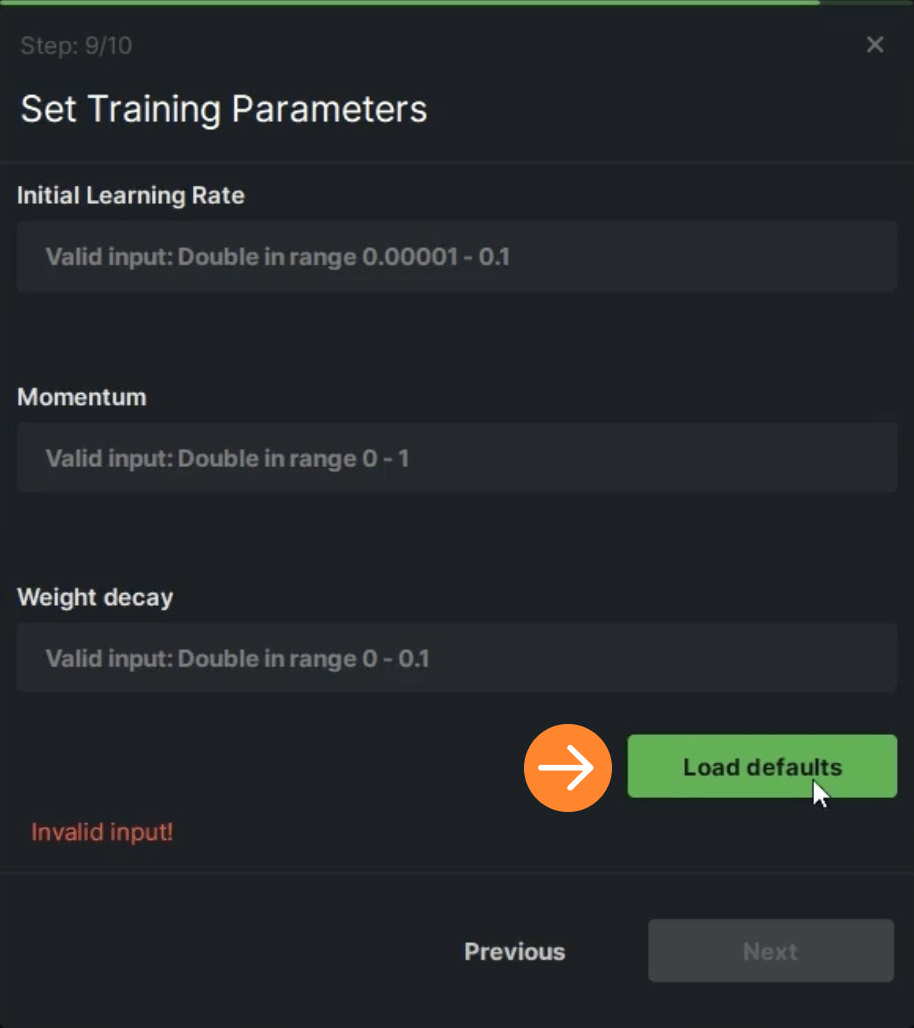
                12. “Load Defaults” button allows the user to set the training parameters automatically. Additionally, the user has the option to manually input custom parameters

                13. The user can add the additional training parameters by clicking on the “Load Defaults” button. Then, simply click on “Next” to proceed

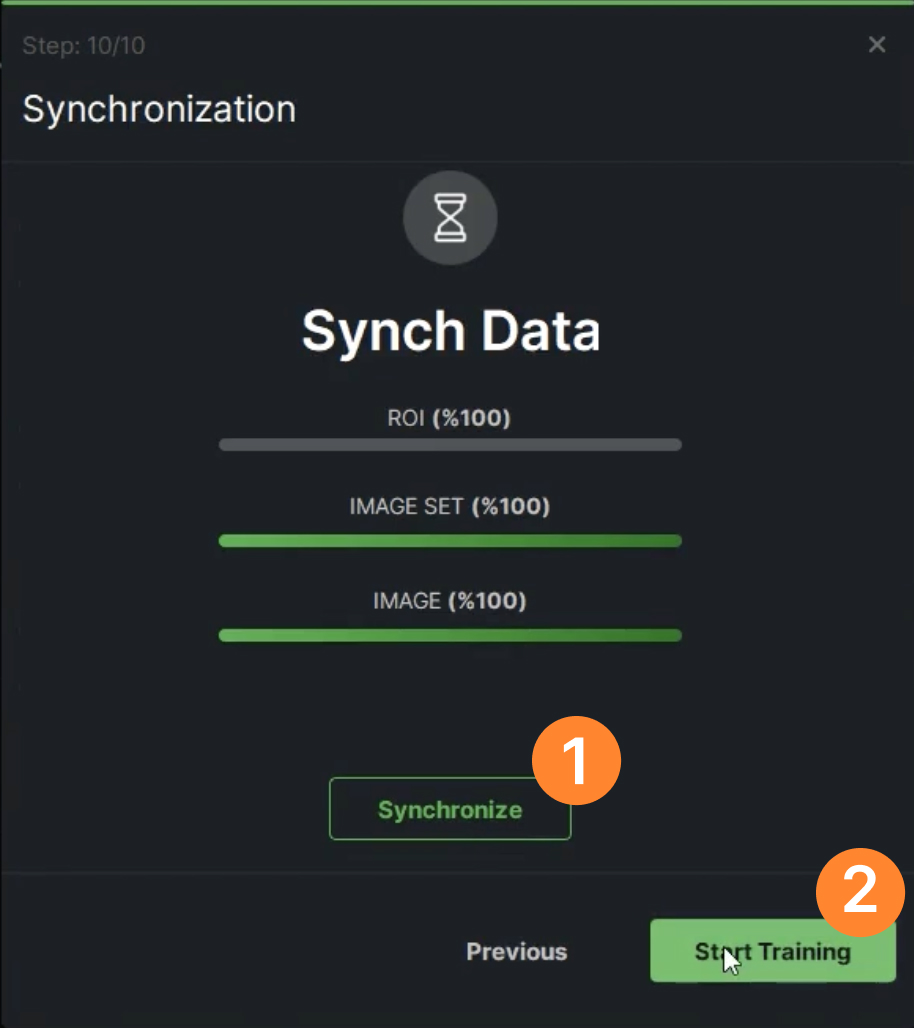
                14. The user should synchronize the data before training by clicking on “Synchronize” button

                15. When the data synchronization is done, click on the “Start Training” button

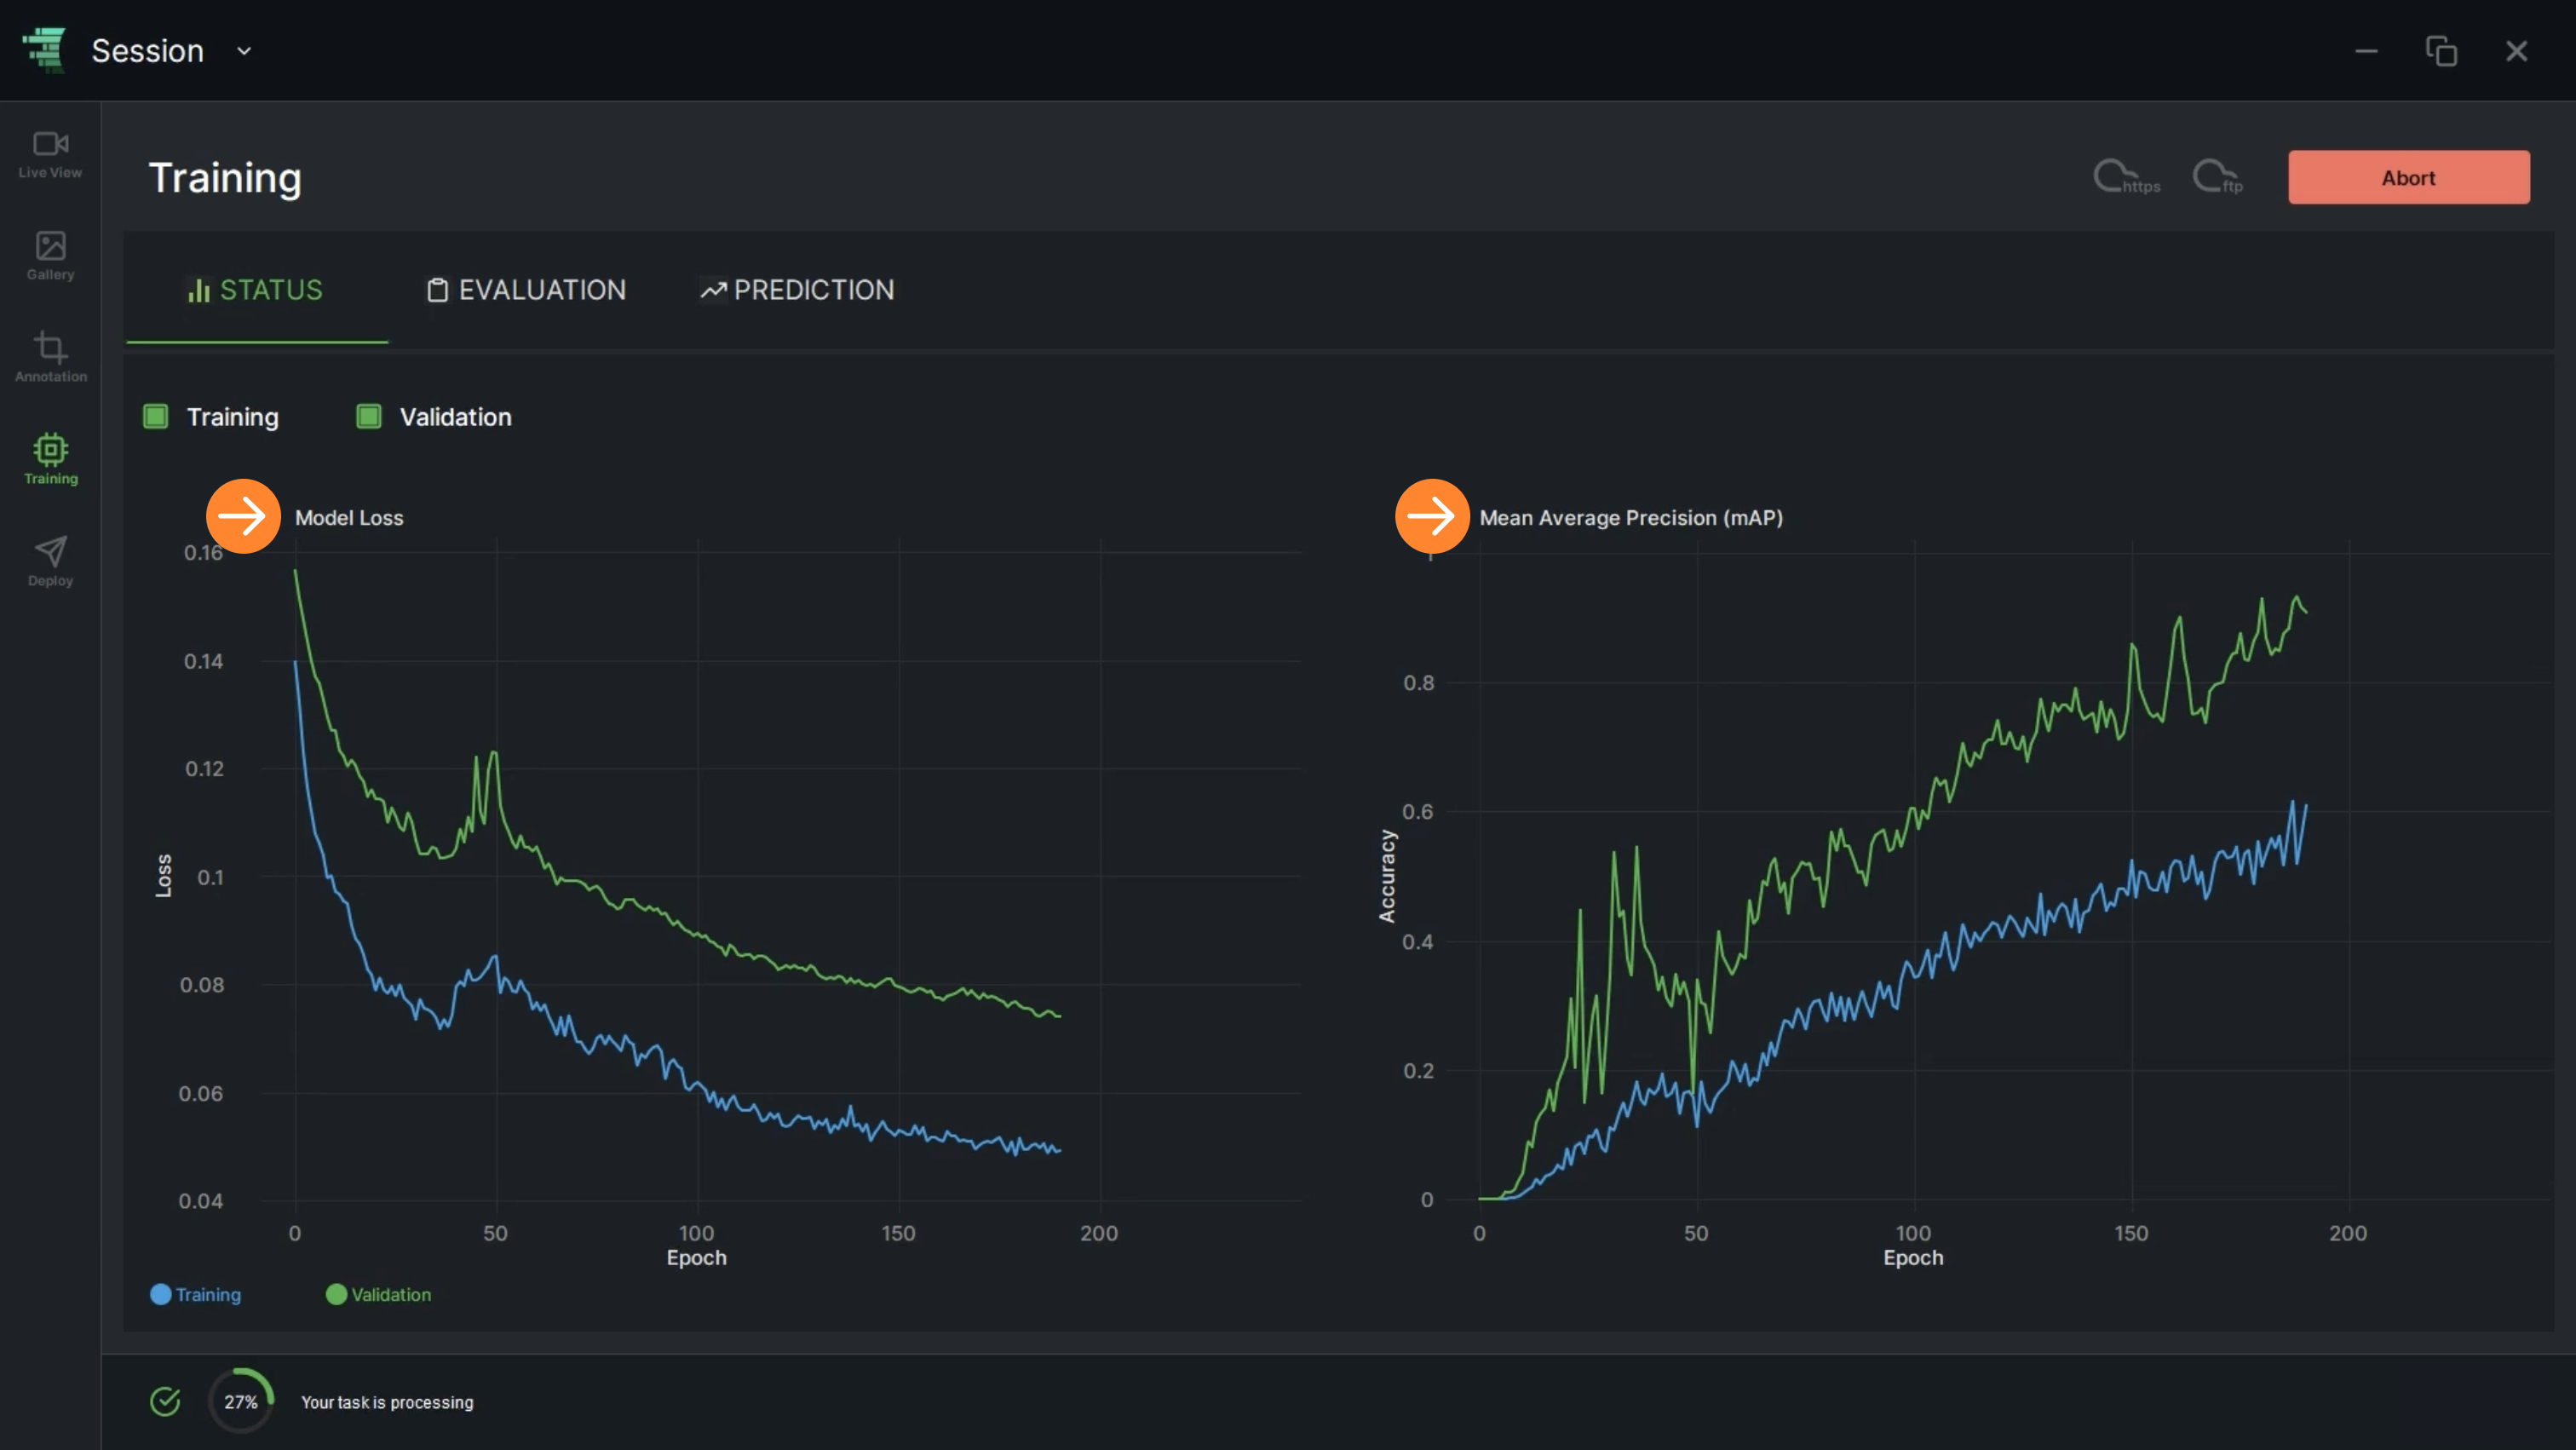
                16. In the Status tab, Model Loss and Mean Average Precision plots can be checked in real-time

                • Model Loss Curve: This is a graphical representation that illustrates how the loss of the model changes over epochs during both the training and validation phases. The loss curve provides valuable insights into the model's performance and convergence throughout the training process
                • Training Loss Curve: This curve shows how the loss decreases during the training phase. It provides information on how well the model is fitting the training data (blue curve)
                • Validation Loss Curve: This curve shows how the loss changes during the validation phase, using data that the model hasn't seen during training. It helps assess the model's generalization ability (green curve)
                • mAP: This is the mean or average of the AP values calculated for each object class. It provides a single measure of the model's performance across all object classes. Higher mAP values indicate better overall performance
                • Accuracy: It measures how often the model correctly identifies objects (both true positives and true negatives) out of all objects present in the image. It is the ratio of correct predictions to the total number of predictions

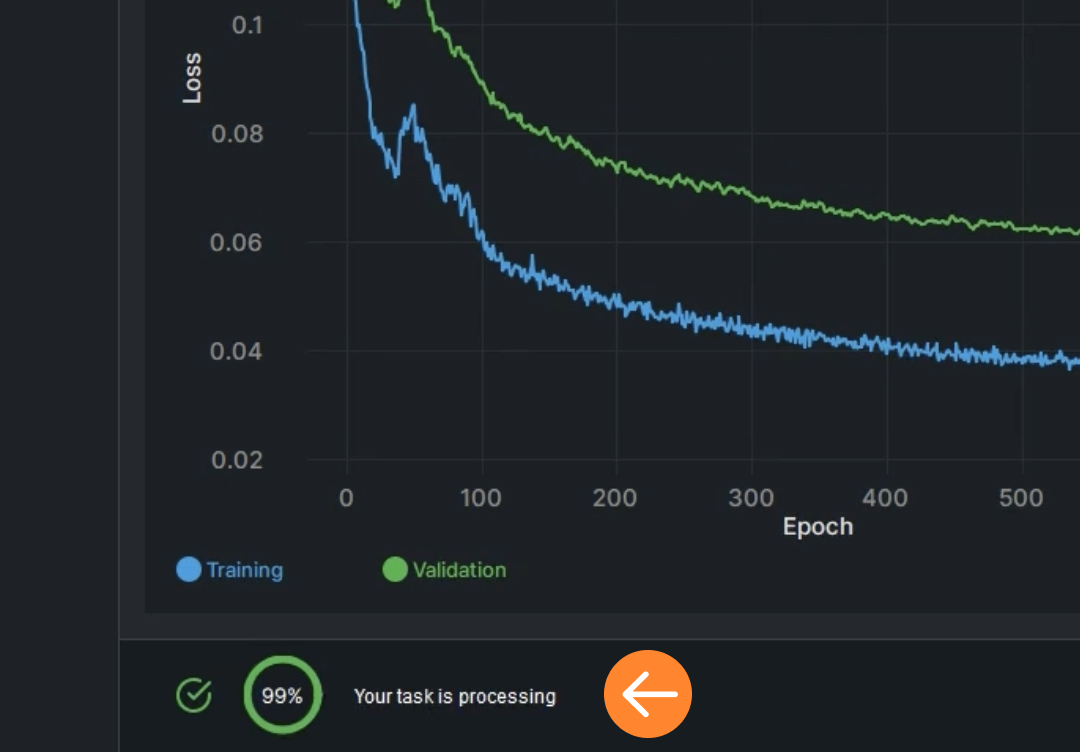
                17. The user can monitor the progress of the training by checking the Status bar

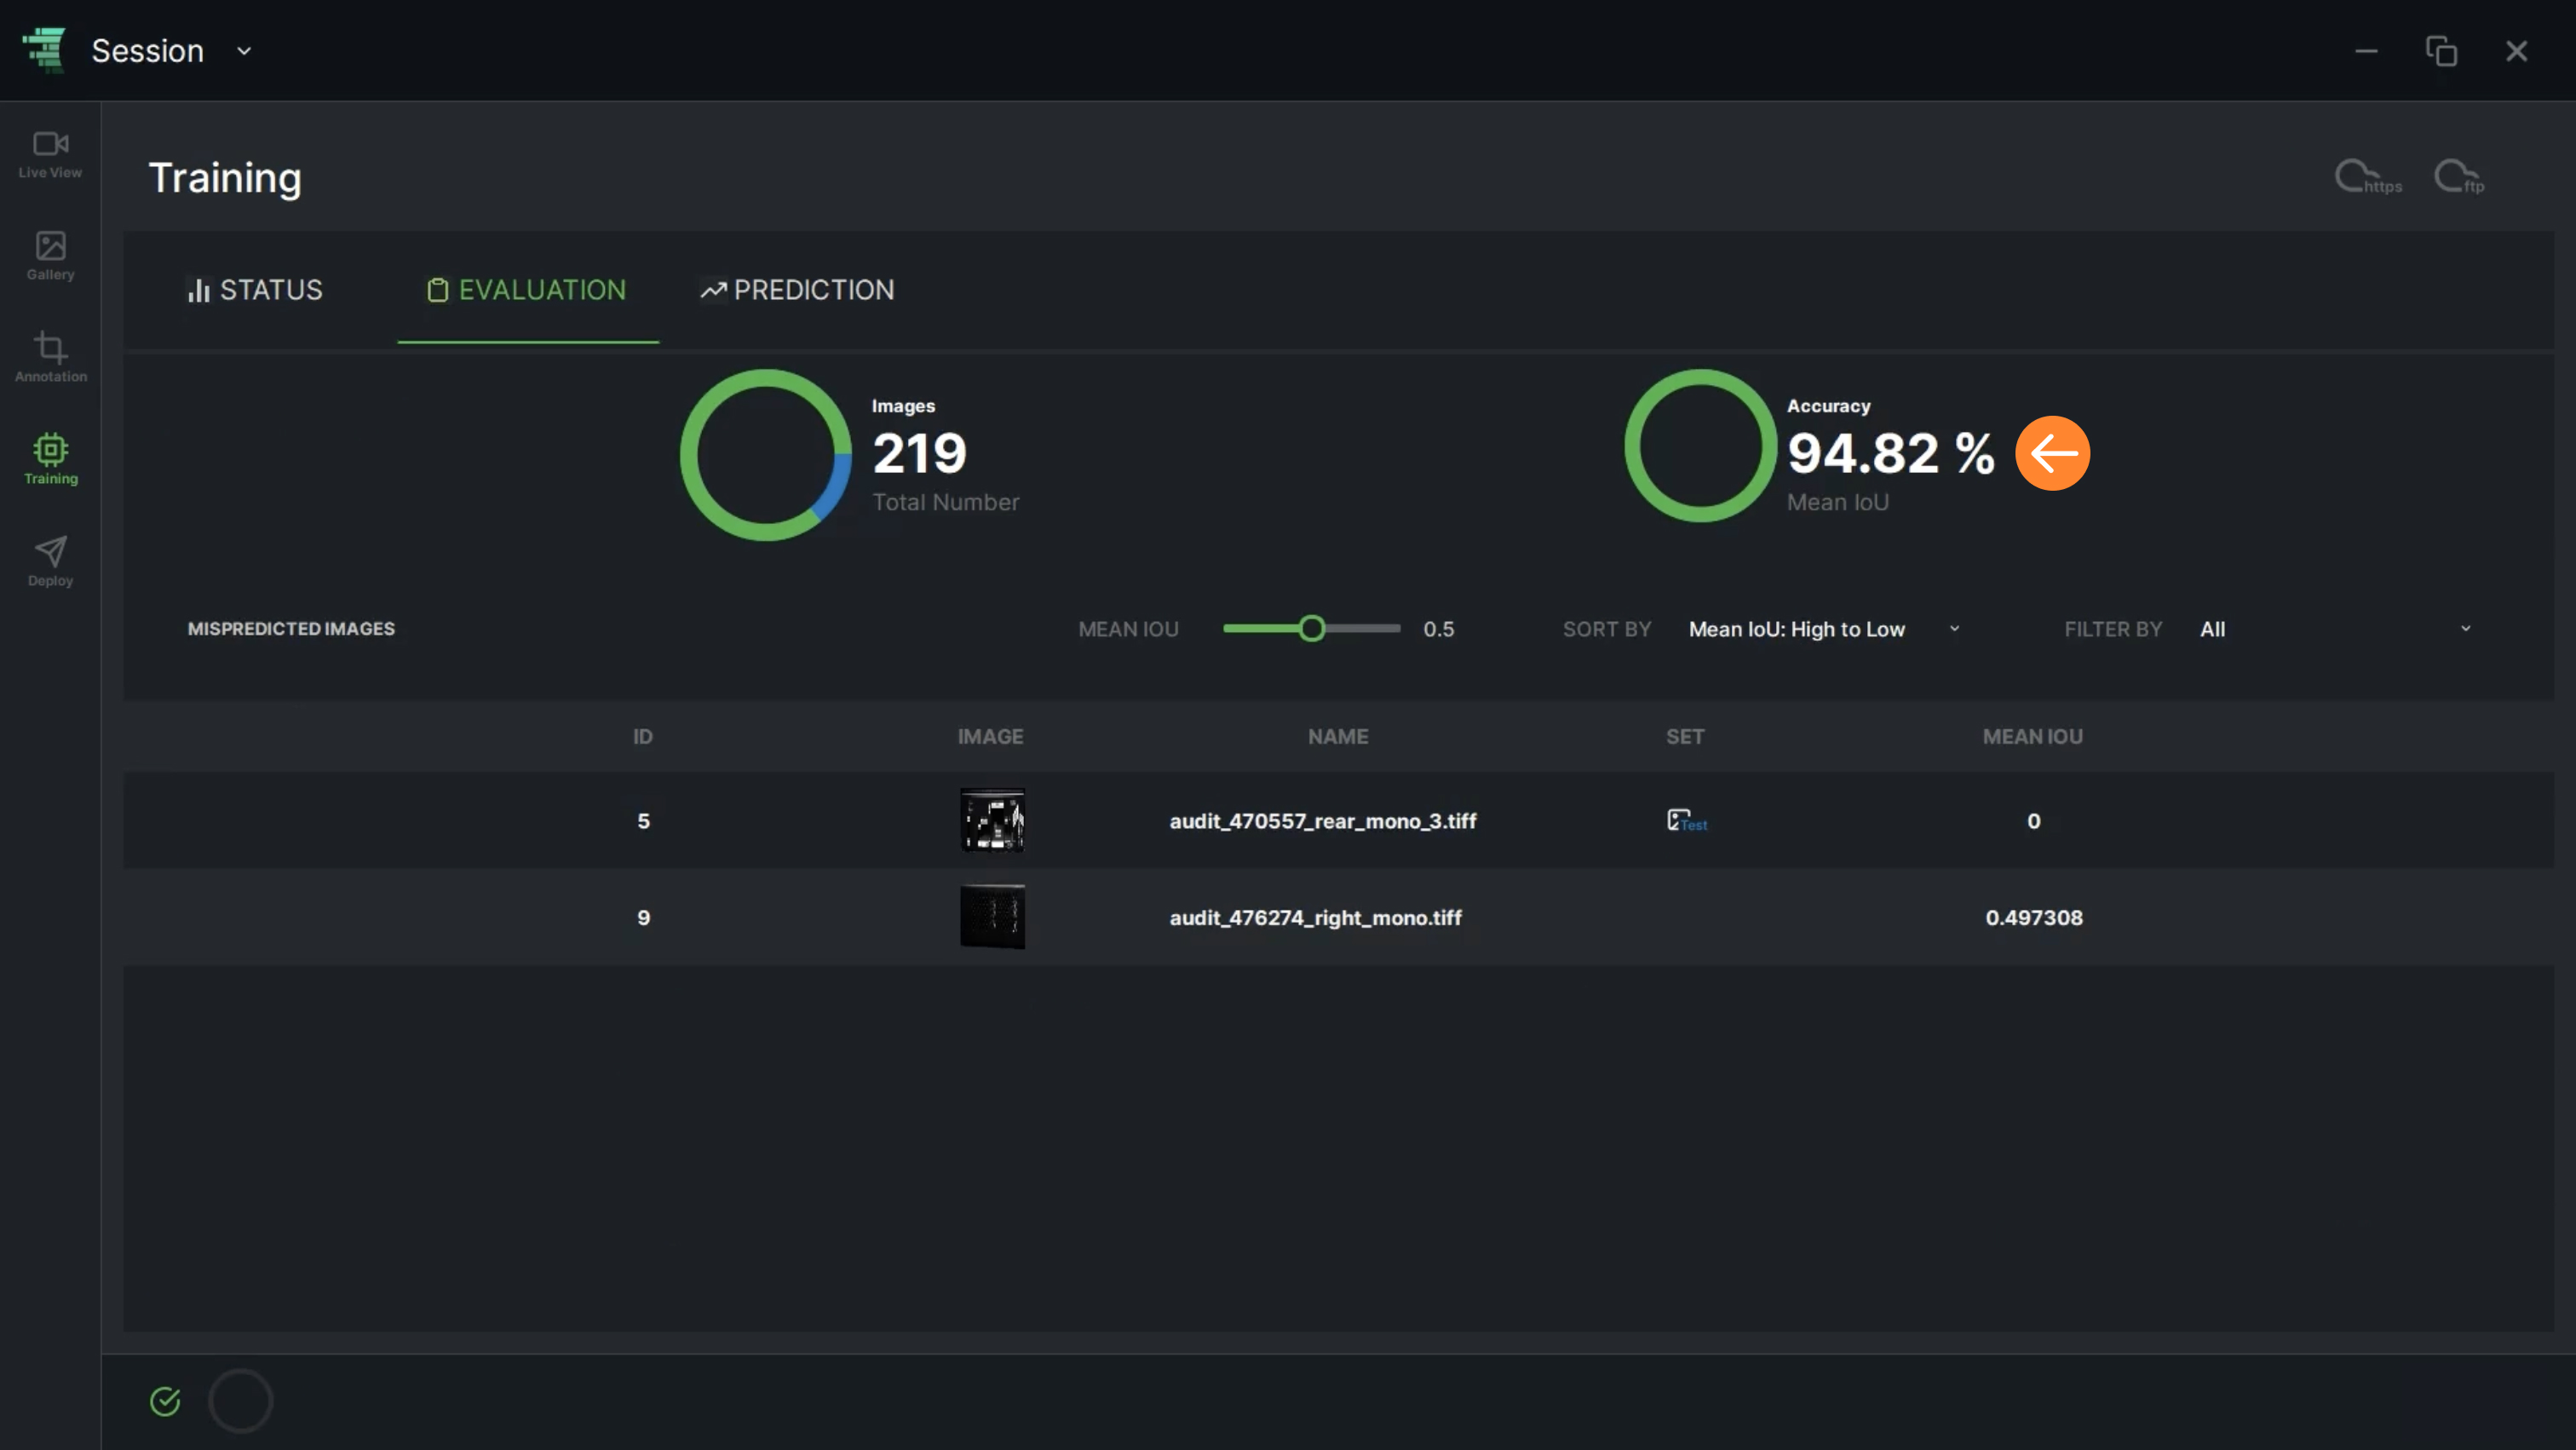
                18. Once the training has finished, click on “Evaluation” tab to see the training statistics:

                1. Total number of images
                2. Accuracy
                3. Mean IoU

                19. Mean IoU can be changed by moving the slider

                • “Mean IoU” is the average of IoUs
                • “IoU” measures the overlap between the predicted bounding boxes and the ground truth bounding boxes
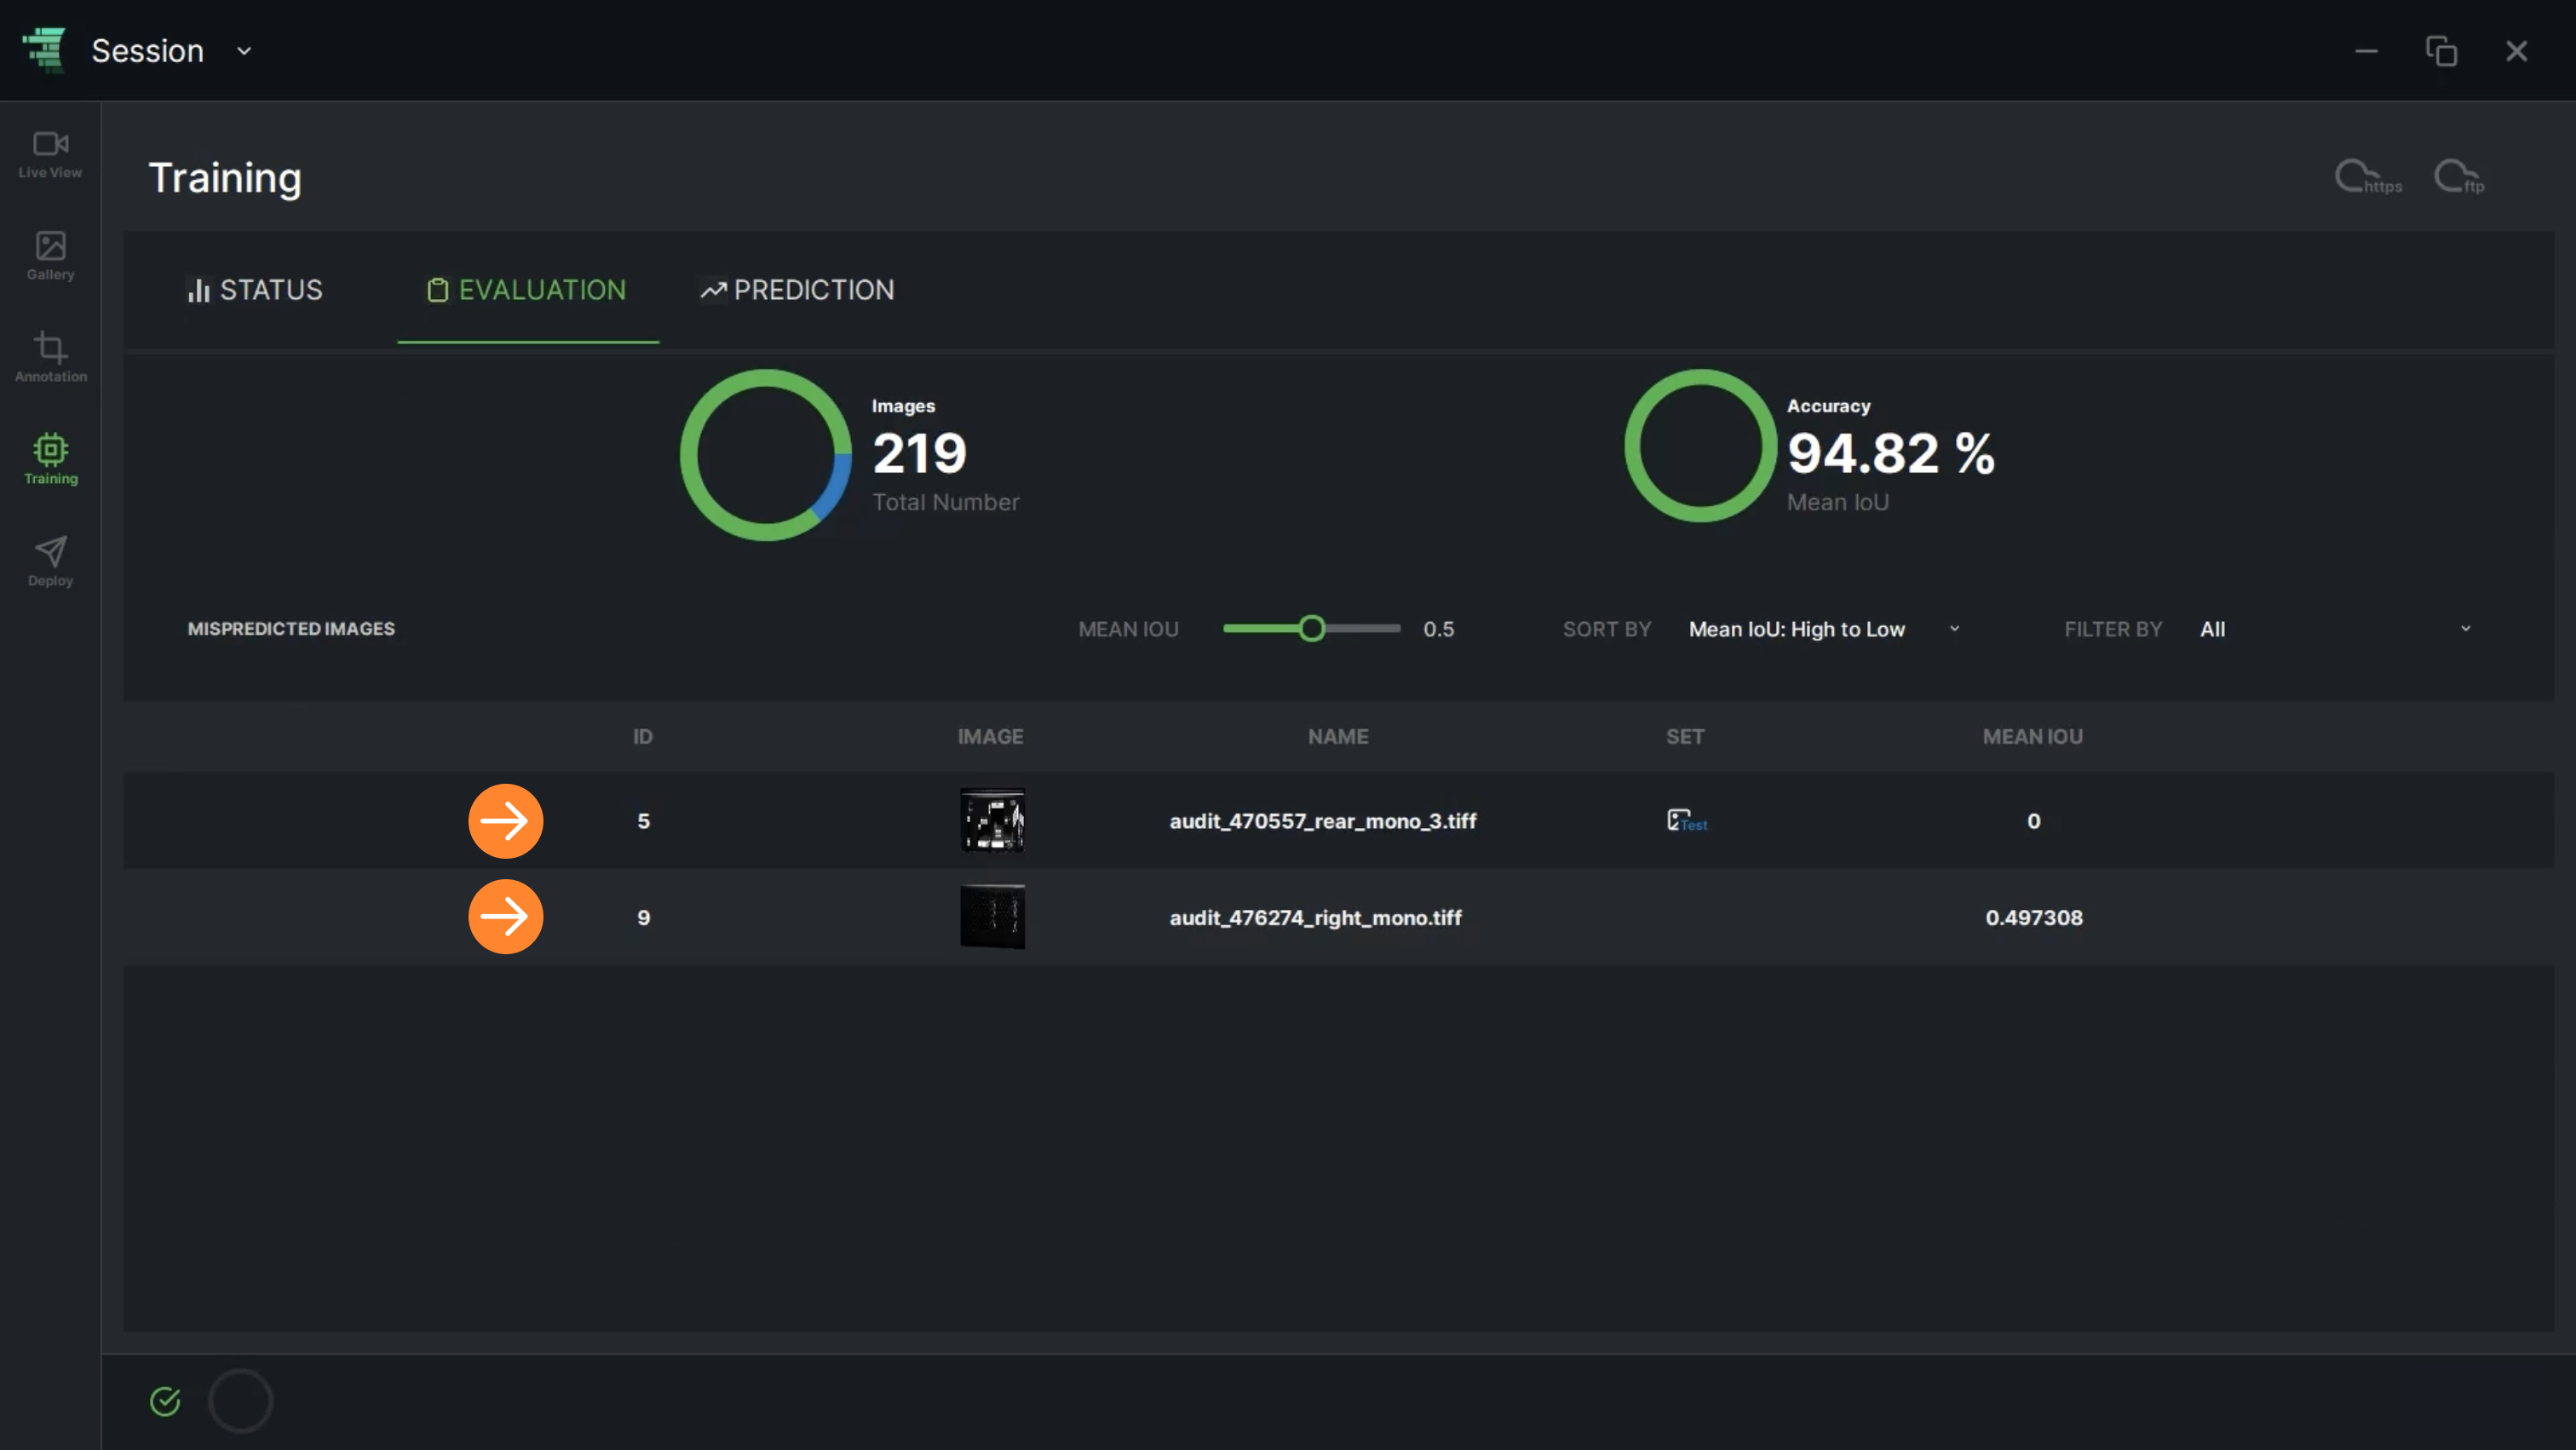
                • The mispredicted images and their corresponding Mean IoU scores are displayed in the table view
                ReliTrainer
                Quality Automation with AI and Relimetrics

                Running an AI Block

                You can run any AI model you have trained on any dataset you have in your gallery. The inference results are directly available for your review and are also added to the dataset under the name of the AI model you have run for future reference and review.

                Running an AI Block (Model) functionality is available through the ReliUI’s prediction screen.

                1. In the training screen, the “PREDICTION” tab enables the user to start a testing process on a model by simply clicking on “Start” button

                2. The user should select a model for prediction and click on “Next”

                3. The user should select the Imageset that will be used for prediction and then click on “Next”

                4. The user should synchronize the data before the prediction by simply clicking on “Synchronize” button

                5. When the data synchronization is done, click on “Start Prediction” button

                6. The user can review the model's prediction results by checking the list of images on the left side along with the corresponding region predictions and their respective precision values on the right side

                7. “Show ROIs” switch button on the bottom allows the user to show/hide annotations

                8. Prediction results alongside the annotations can be reviewed from the Gallery, by clicking on the dataset

                9. The image displays both the predictions and the annotations, which are clearly marked

                10. In the “STATES” column, the user can check the defined classes alongside the prediction results generated by the trained model (E.g. scratch_data)

                11. In the “ROI LIST” column, the user has the ability to review the ROIs for both classes and the trained model results

                12. The user can hide/show the classes or the prediction results’ ROIs by clicking on the “View” icon

                13. “Task” section displays the current tasks whether training or prediction and enables the user to abort them if necessary.

                ReliTrainer
                Quality Automation with AI and Relimetrics

                Pipeline Editor

                The pipeline editor is central to building your AI power solution. A pipeline is composed of AI blocks (AI models) and Basic blocks (Digital signal/image processing - DSP/DIP - functions). Basic blocks cover fundamental image/signal processing and statistics operations. AI blocks are AI models trained in ReliTrainer to perform inspection specific tasks, i.e. detection, classification, semantic segmentation. The pipeline editor enables you to build, run and deploy complex processing and analysis pipelines using an intuitive drag-and-drop interface tailored to your needs and constraints. You can also use a pipeline editor to build preprocessing pipelines (a.k.a. Data pipelines) to prepare datasets for training AI blocks (models).

                The pipeline editor is accessible through ReliUI’s pipeline editor screen.

                1. In the main screen of the Pipeline Editor, the user can create new pipelines. Simply click on “Create New Pipeline”, enter the desired Pipeline Name, and specify the Task.

                2. The generated pipeline will be presented as a folder. To access the pipeline editor screen, simply double-click on the folder.

                3. The screen shows three parts: (1) the “Left Menu”, (2) the “Execute” button and (3) the “Workflow Area”.

                4. To return to the list of pipelines, the user can simply click on “Pipeline Editor” in the navigation menu.

                5. The user can drag and drop any node from the left menu and compose any pipeline by connecting these blocks with the output nodes.

                6. In the gallery, the user can initiate the data import process by clicking on “Import Data” or using the existing imagesets.

                7. Click on “Synchronize” from the “More” icon () to send the image set to the server.

                8. The pipeline’s left menu covers below functions:

                • Source imageset / Output imageset
                • Imageset rescaling (E.g. Resize)
                • Imageset processing (E.g. Rotate)
                • AI models (E.g. Classification)

                9. The user can create a pipeline starting with data processing followed by the integration of three distinct types of AI models.

                10. The user has the flexibility to select either a single model or a combination of models tailored to their specific use case. The menu displays three model categories for each task, namely;

                • Classification
                • Detection
                • Semseg (Semantic Segmentation)

                11. The “Detection” and “Classification” models write results directly onto the original image set by default. A button is available for selection if the user needs to generate an output. Enabling this option ensures that the node can be connected to another one.

                12. The “Semseg” model performs semantic segmentation and  sends the final results to the server.

                13. For a single model scenario, drag-drop “SourceImageset” along with either the “Detection Model”, “Classification Model” or “Semantic Segmentation” nodes depending on the defined task.

                14. The user must select the appropriate model name from the available options under “Select Model” along with the source imageset.

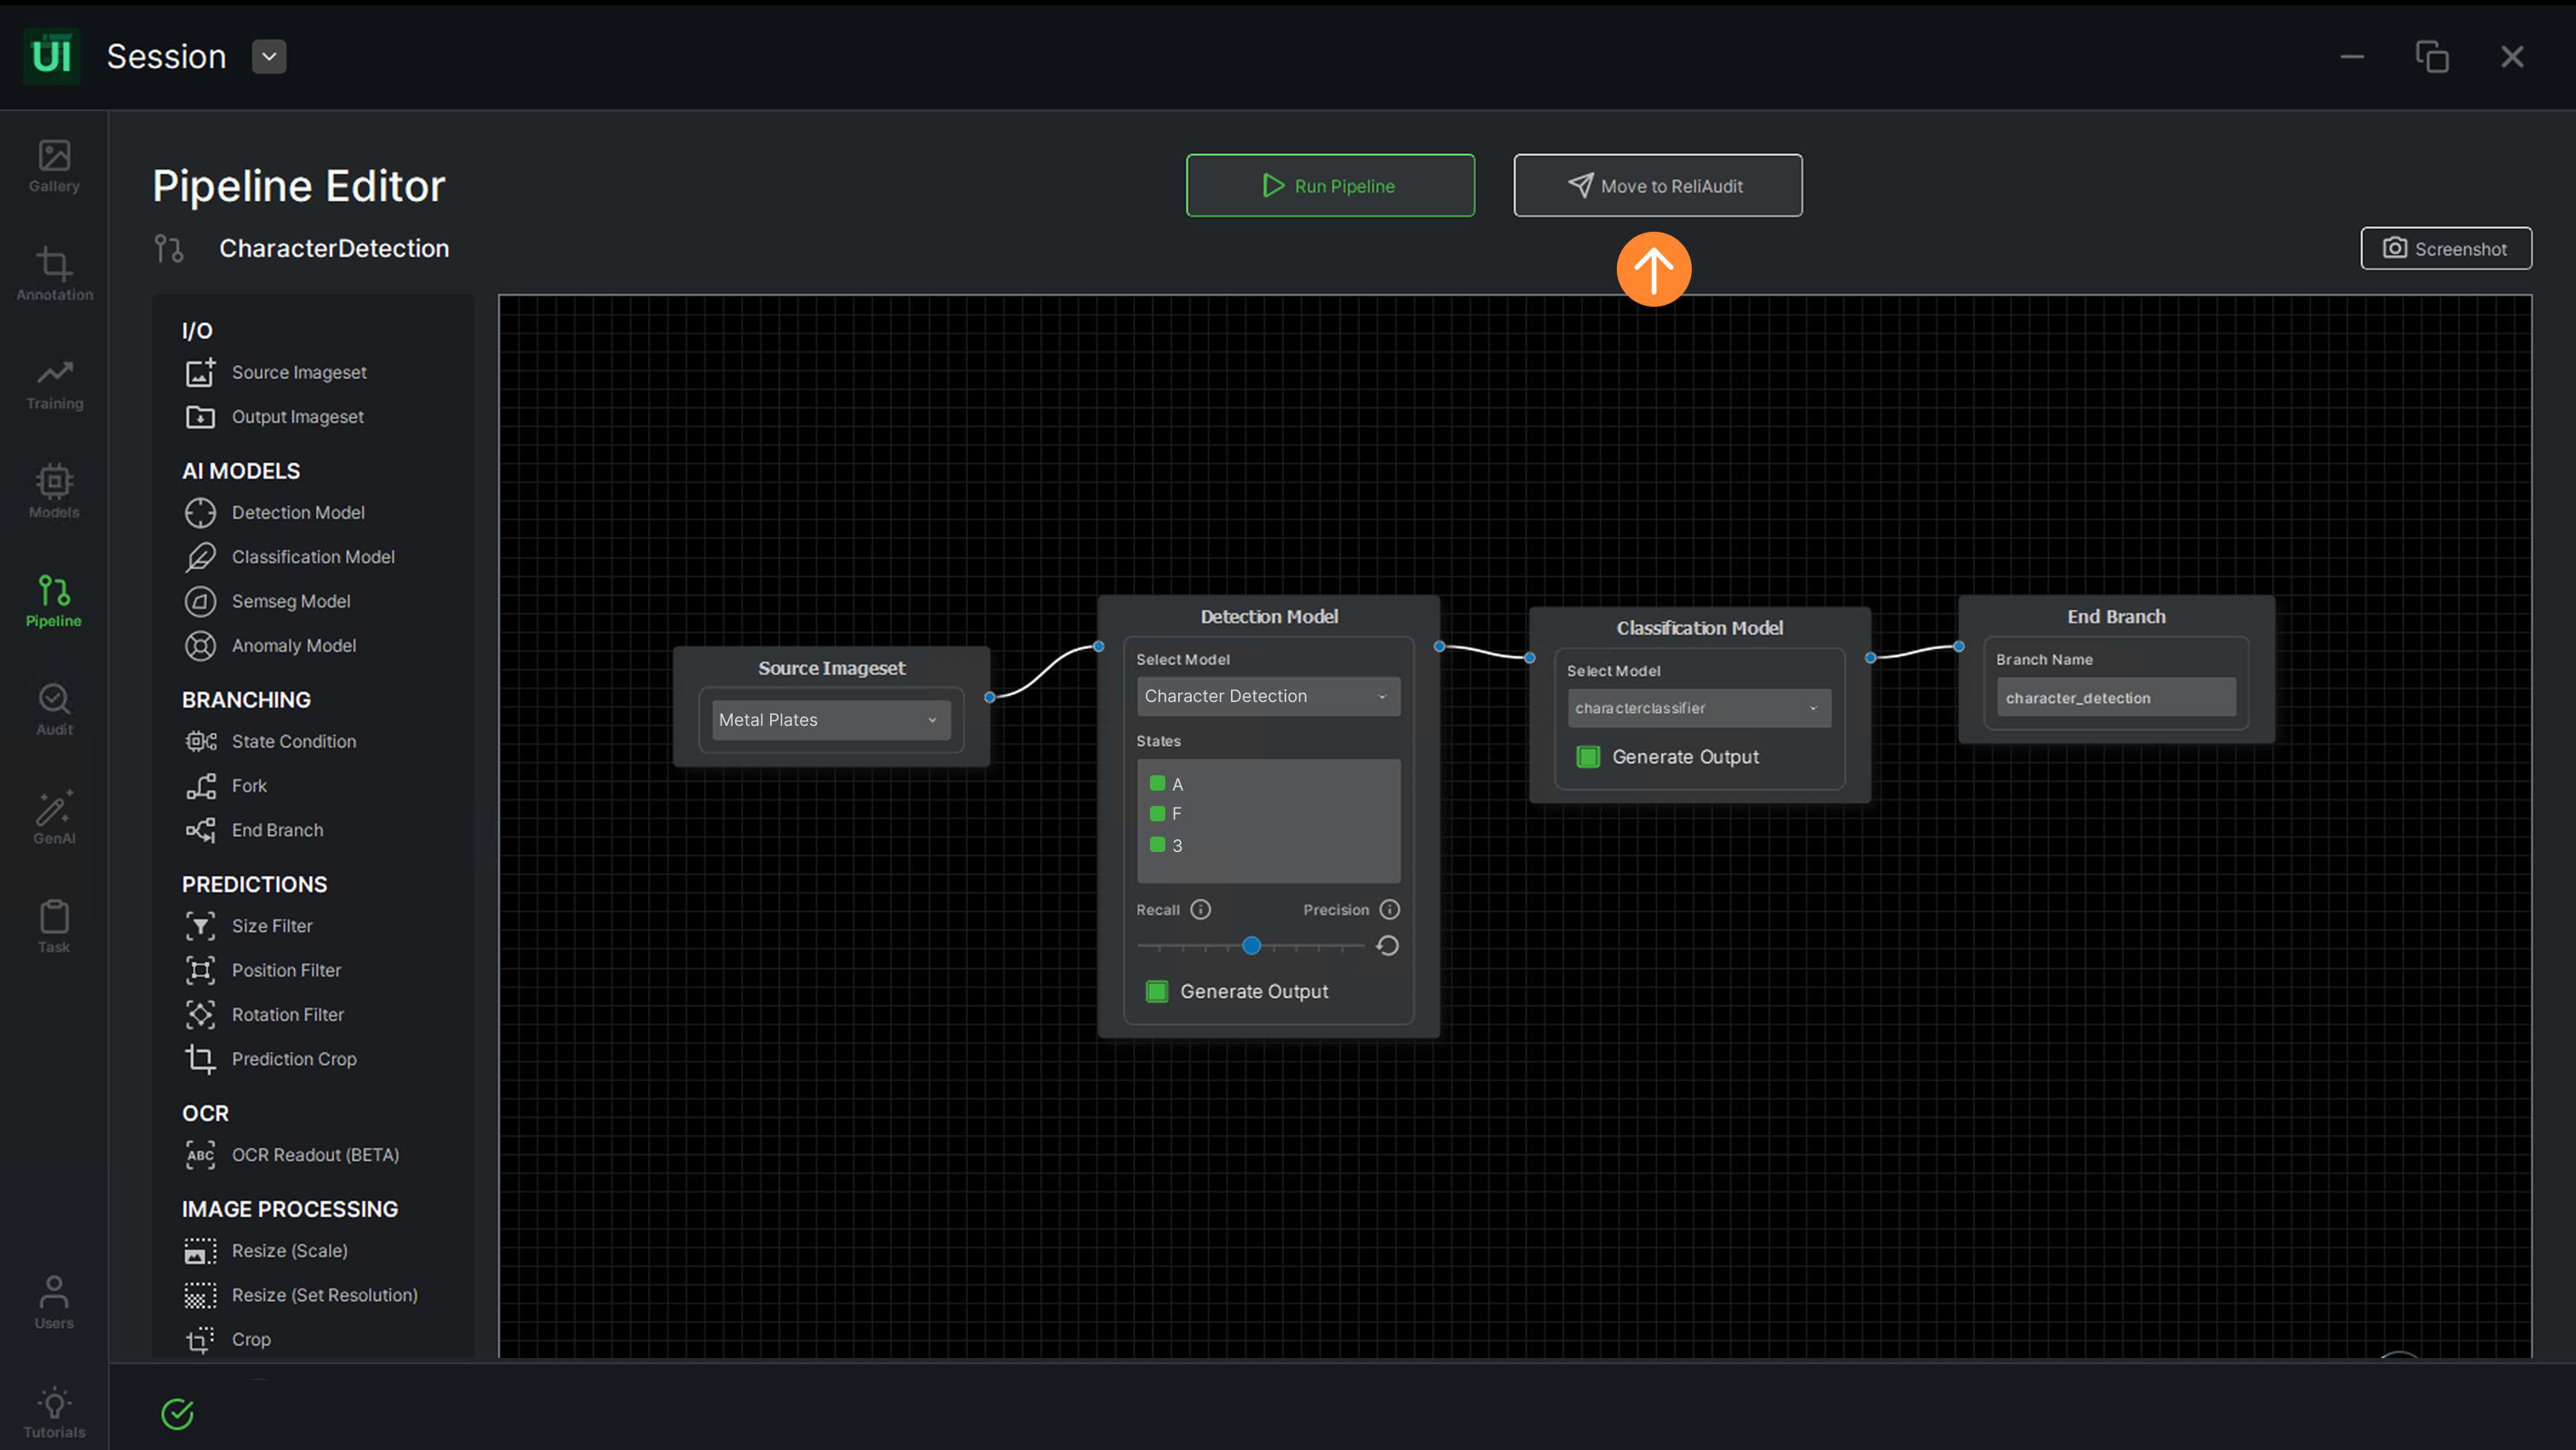
                15. The user can create a combined pipeline featuring a detector and classifier by connecting three individual nodes: “SourceImageset”, “Detection ” and “Classification ” and by enabling “Generate Output” option.

                16. For a combined model scenario, the user needs to select the appropriate model name (E.g. metalplates_detection) from the provided options listed under “Select Model” along with the source imageset.

                17. Once done, click on “Execute” button to run the pipeline. The saving of the pipeline project is done automatically.

                18. The prediction results will appear within the training section under prediction tab, allowing the user to assess the performance of the pipeline.

                19. Go to the Gallery and access the imageset associated with the specified pipeline to review and compare performance results.

                1. Once the user has created a pipeline, it will appear as a folder. Easily access the main Pipeline Editor screen by double-clicking on the folder.

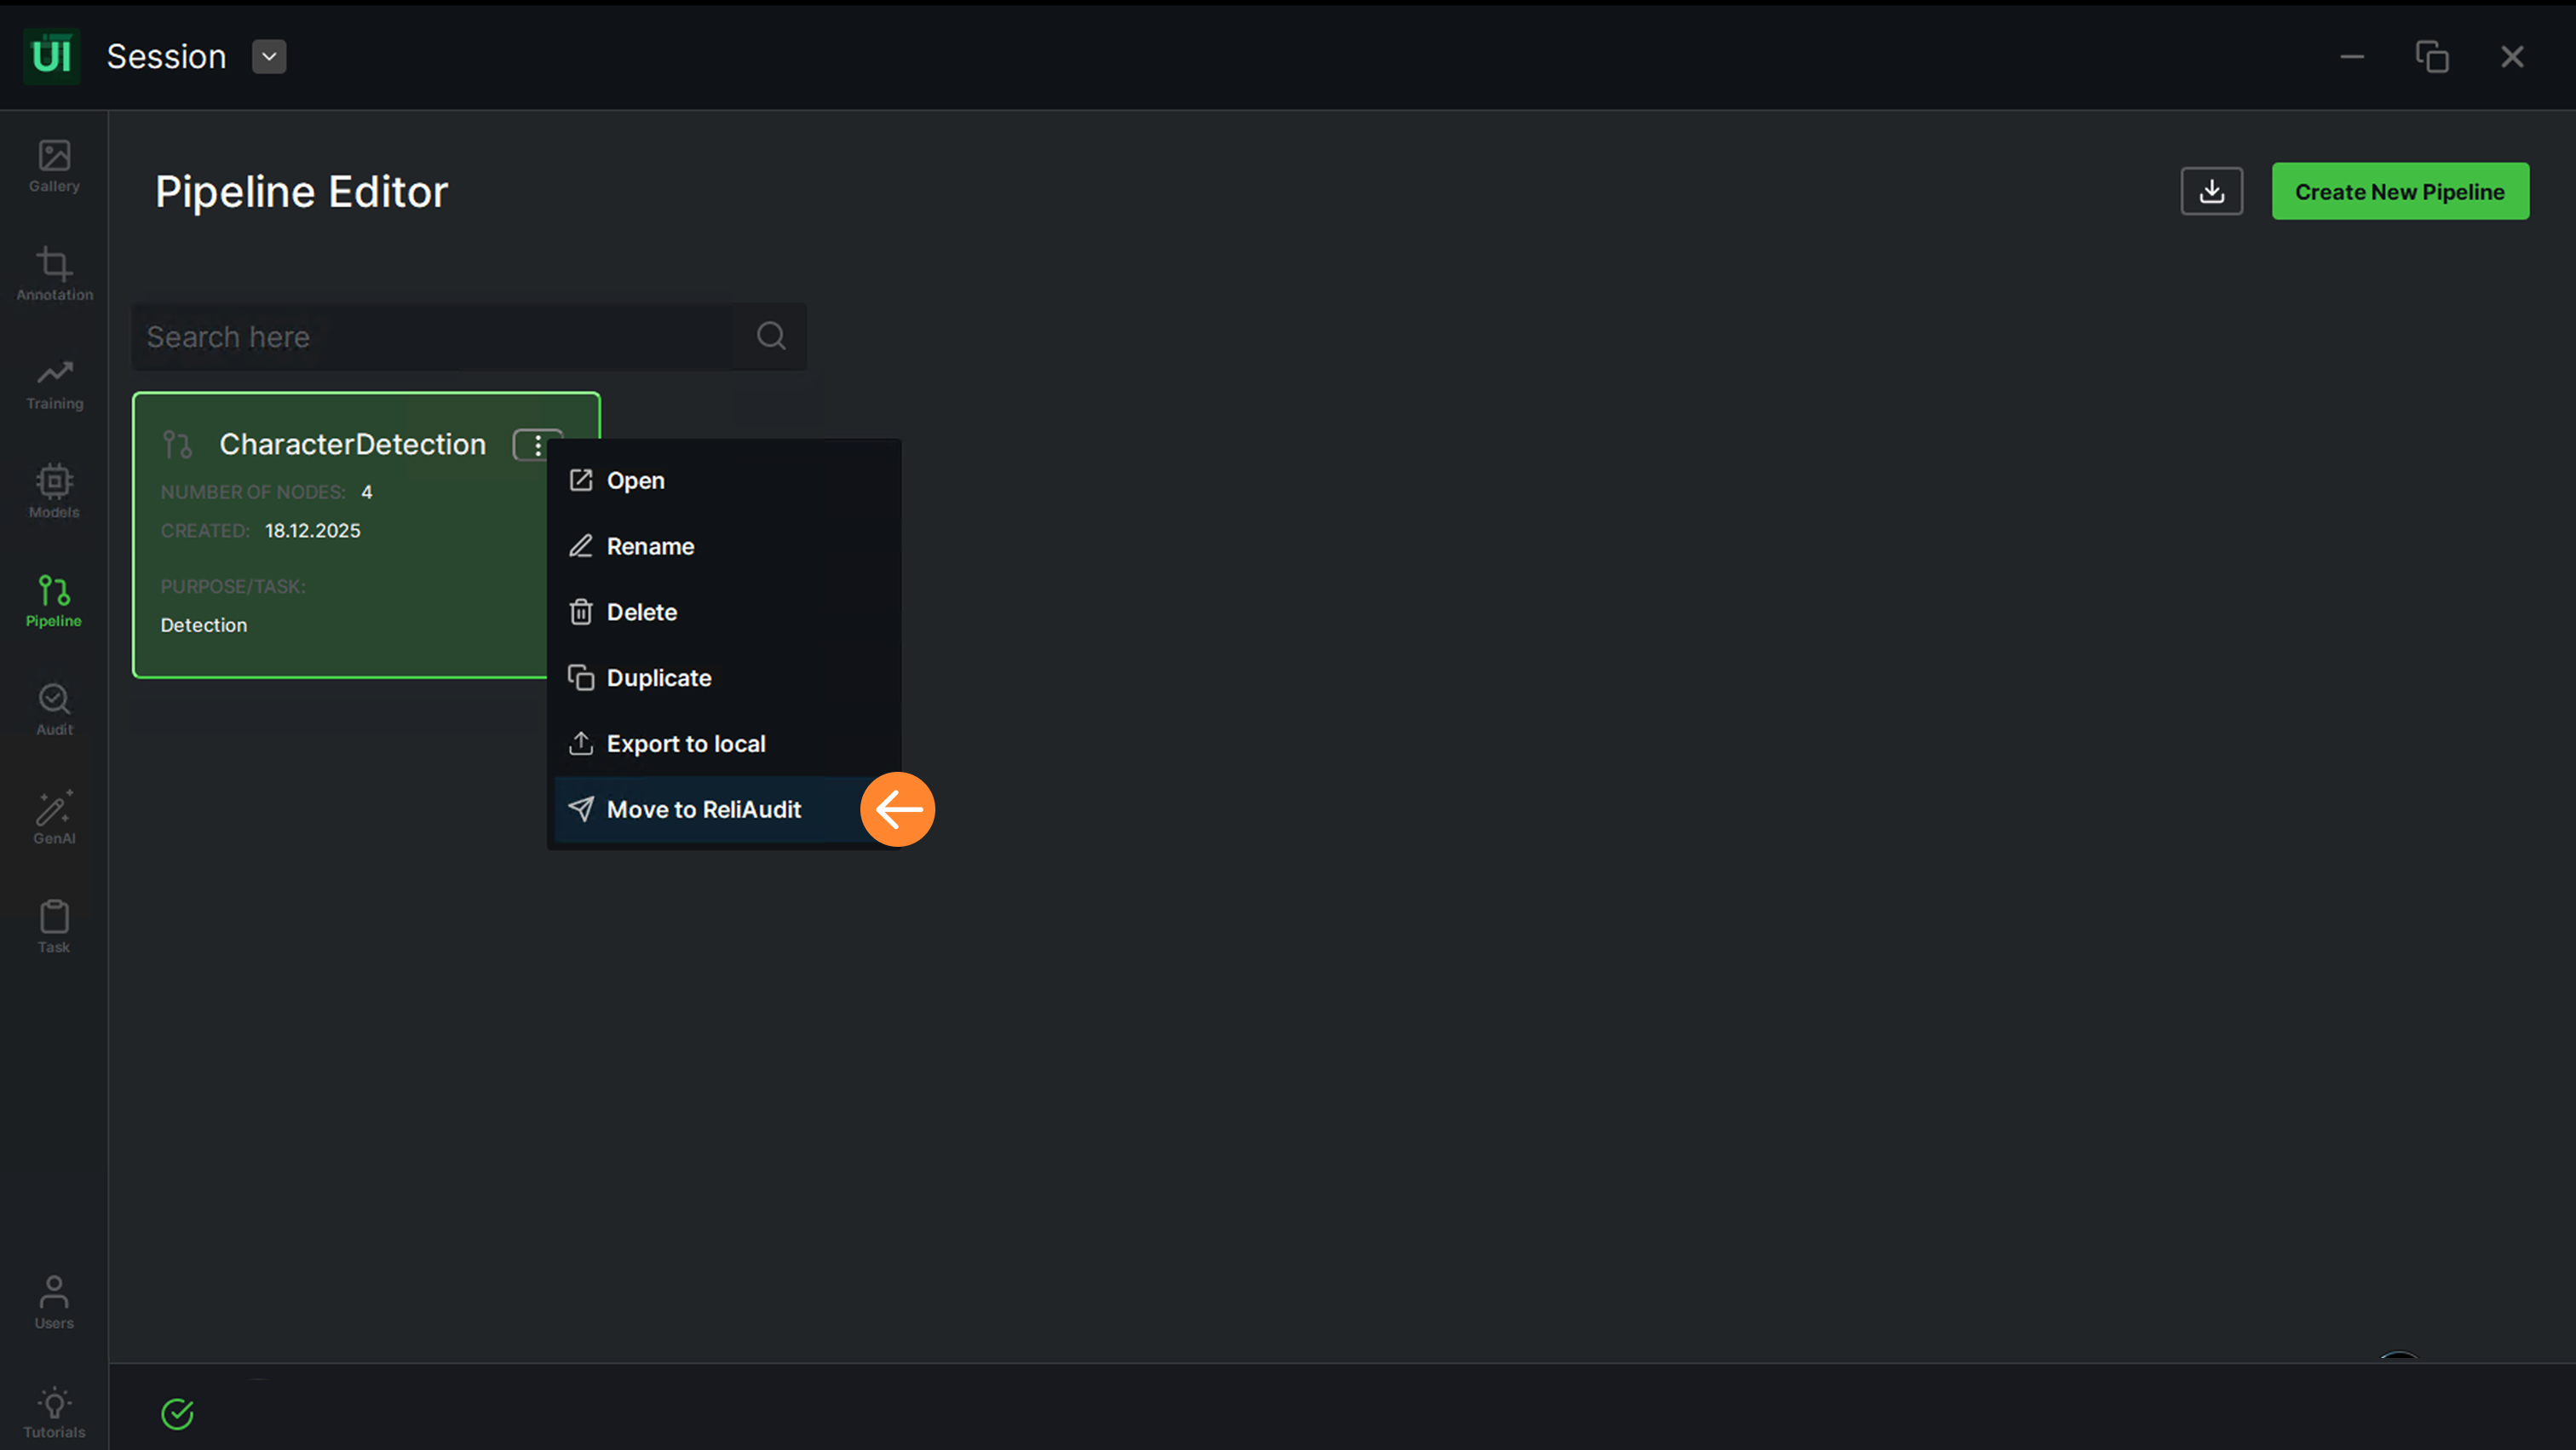
                2. The user can perform different operations on the pipeline:

                • Open
                • Rename
                • Delete
                • Export Pipeline
                • Download to Local
                • Move to ReliAudit

                3. The left menu covers imageset (source and output), rescaling & data processing functionalities and models.

                4. The user can apply different data processing options from this menu.

                5. To initiate the process, the user should begin by selecting the “Source Imageset”, dragging it onto the workflow area. Only data that has been synchronized will be available in the options list.

                6. Add any data processing or rescaling node from the menu, and drop it into the workflow:

                • Resize (Factor)
                • Resize (Resolution)
                • Resize (To Side)
                • Crop (Borders)
                • Crop (Edges)
                • Flip
                • Rotate
                • Shift
                • Grayscale
                • Invert color

                7. The user has the flexibility to customize the parameters of each chosen processing functionality by entering their preferred parameters. (E.g. Rotate)

                8. Add the “Output Imageset” node and designate the name for the generated imageset folder. Connect the processing node’s output to the input of this node.

                9. “Save to Gallery” checkbox saves the imageset directly to the gallery.

                10. Click on “Execute” button to run the designed pipeline.

                11. If the “Save to Gallery” checkbox is checked, the synchronization is automatically initiated ensuring the imageset is directly saved to the gallery. If not, the data will be saved to the server.

                12. The user should download/retrieve data from the server by first entering the URL in the Gallery and choosing the desired data from the available choices.

                13. The user can apply any further processing to a single imageset by dragging and dropping any node from the menu and following the same connection steps.

                ReliTrainer: Design, Train, Deploy
                Quality Automation with AI and Relimetrics

                Re-Training an AI Block

                1. To retrain a pre-trained model, the user should go to Training tab and click on “Start”

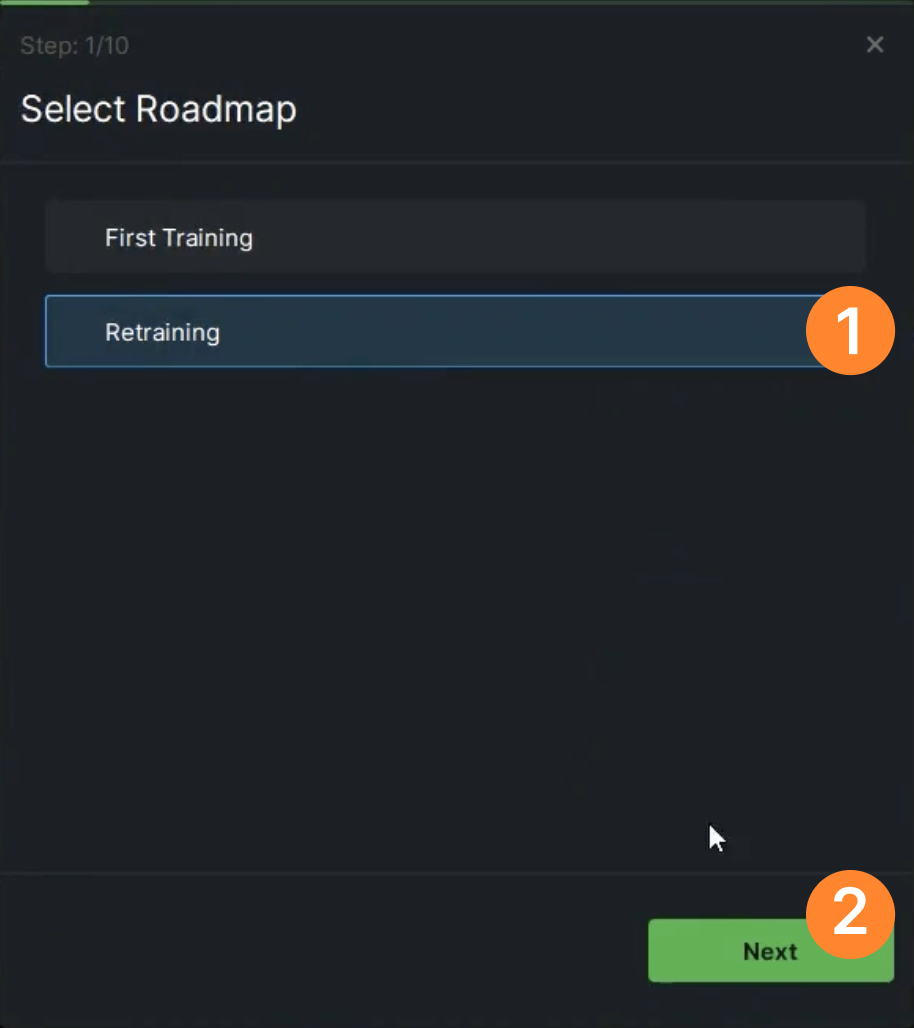
                2. Select “Retraining” option and click on “Next

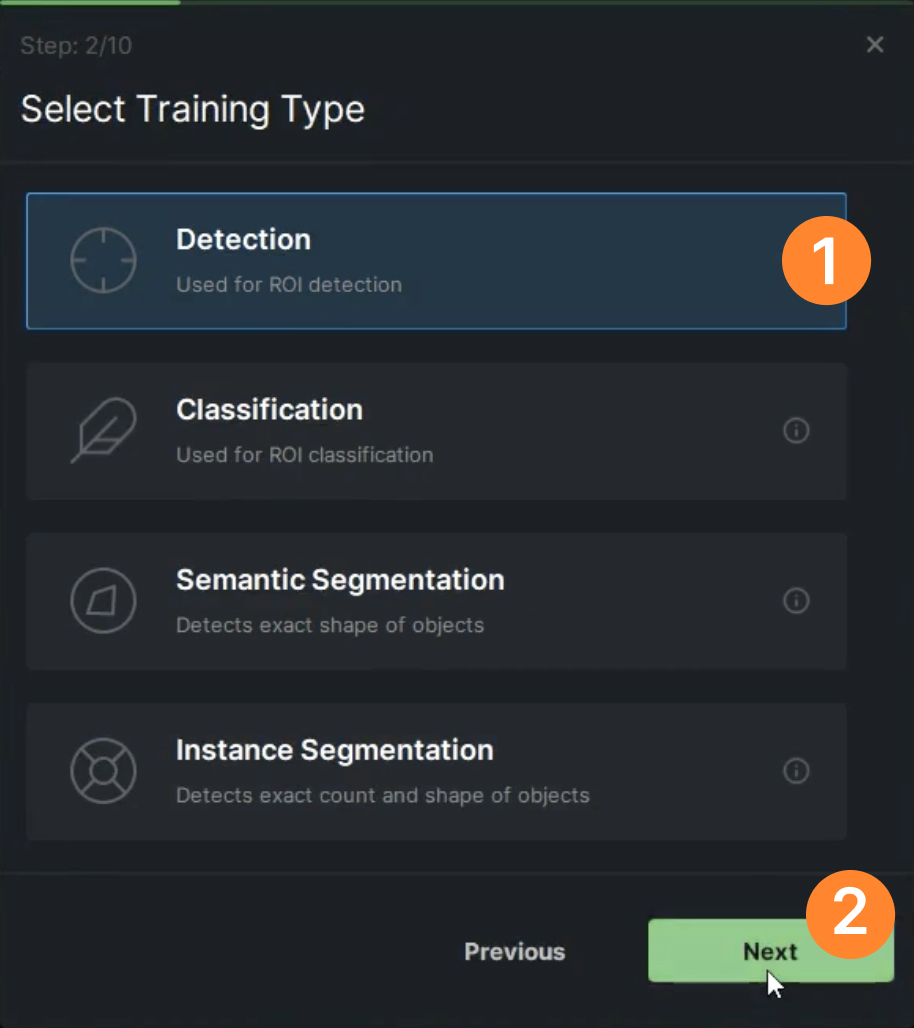
                3. Select Training Type from the provided options:

                • “Detection” is utilized in the process of identifying and categorizing object regions
                • “Classification” is utilized for classifying regions of interest (ROIs)
                • “Semantic Segmentation” is utilized to precisely detect object shapes
                • “Instance Segmentation” is utilized to determine both the exact count and shape of objects

                4. If an object detection model will be retrained, choose “Detection” and click on “Next” to proceed

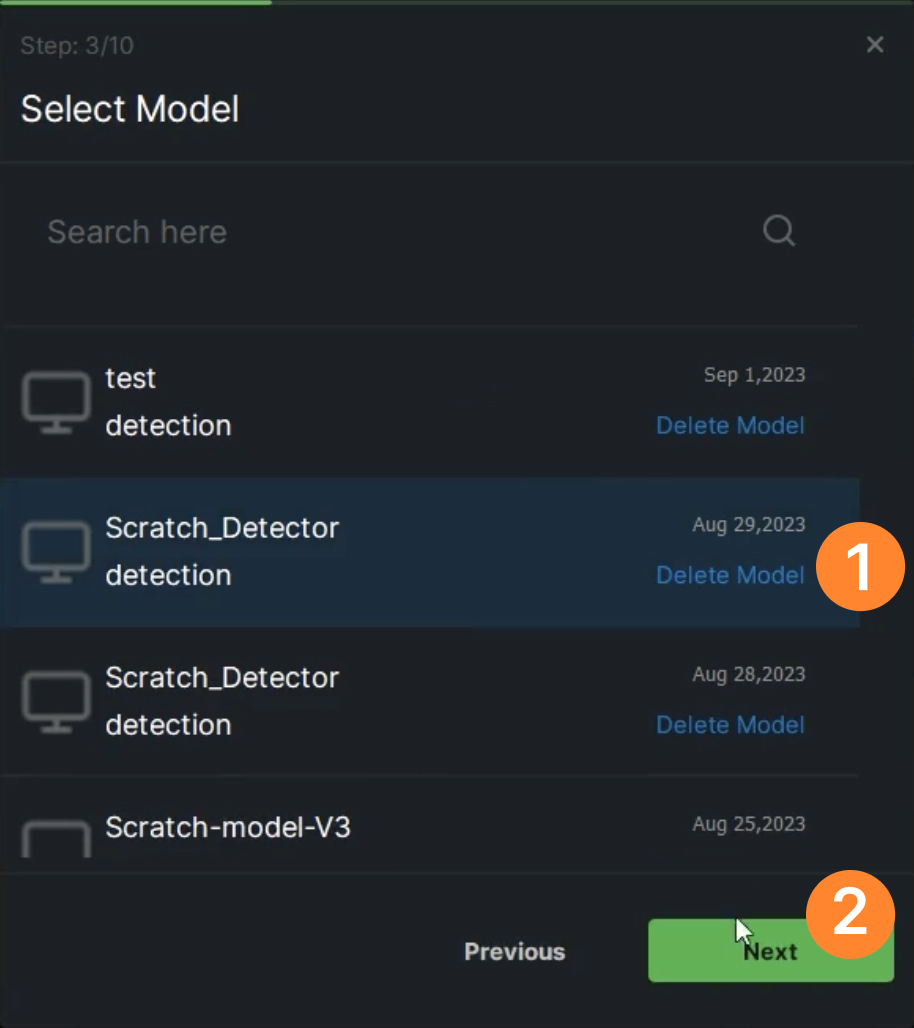
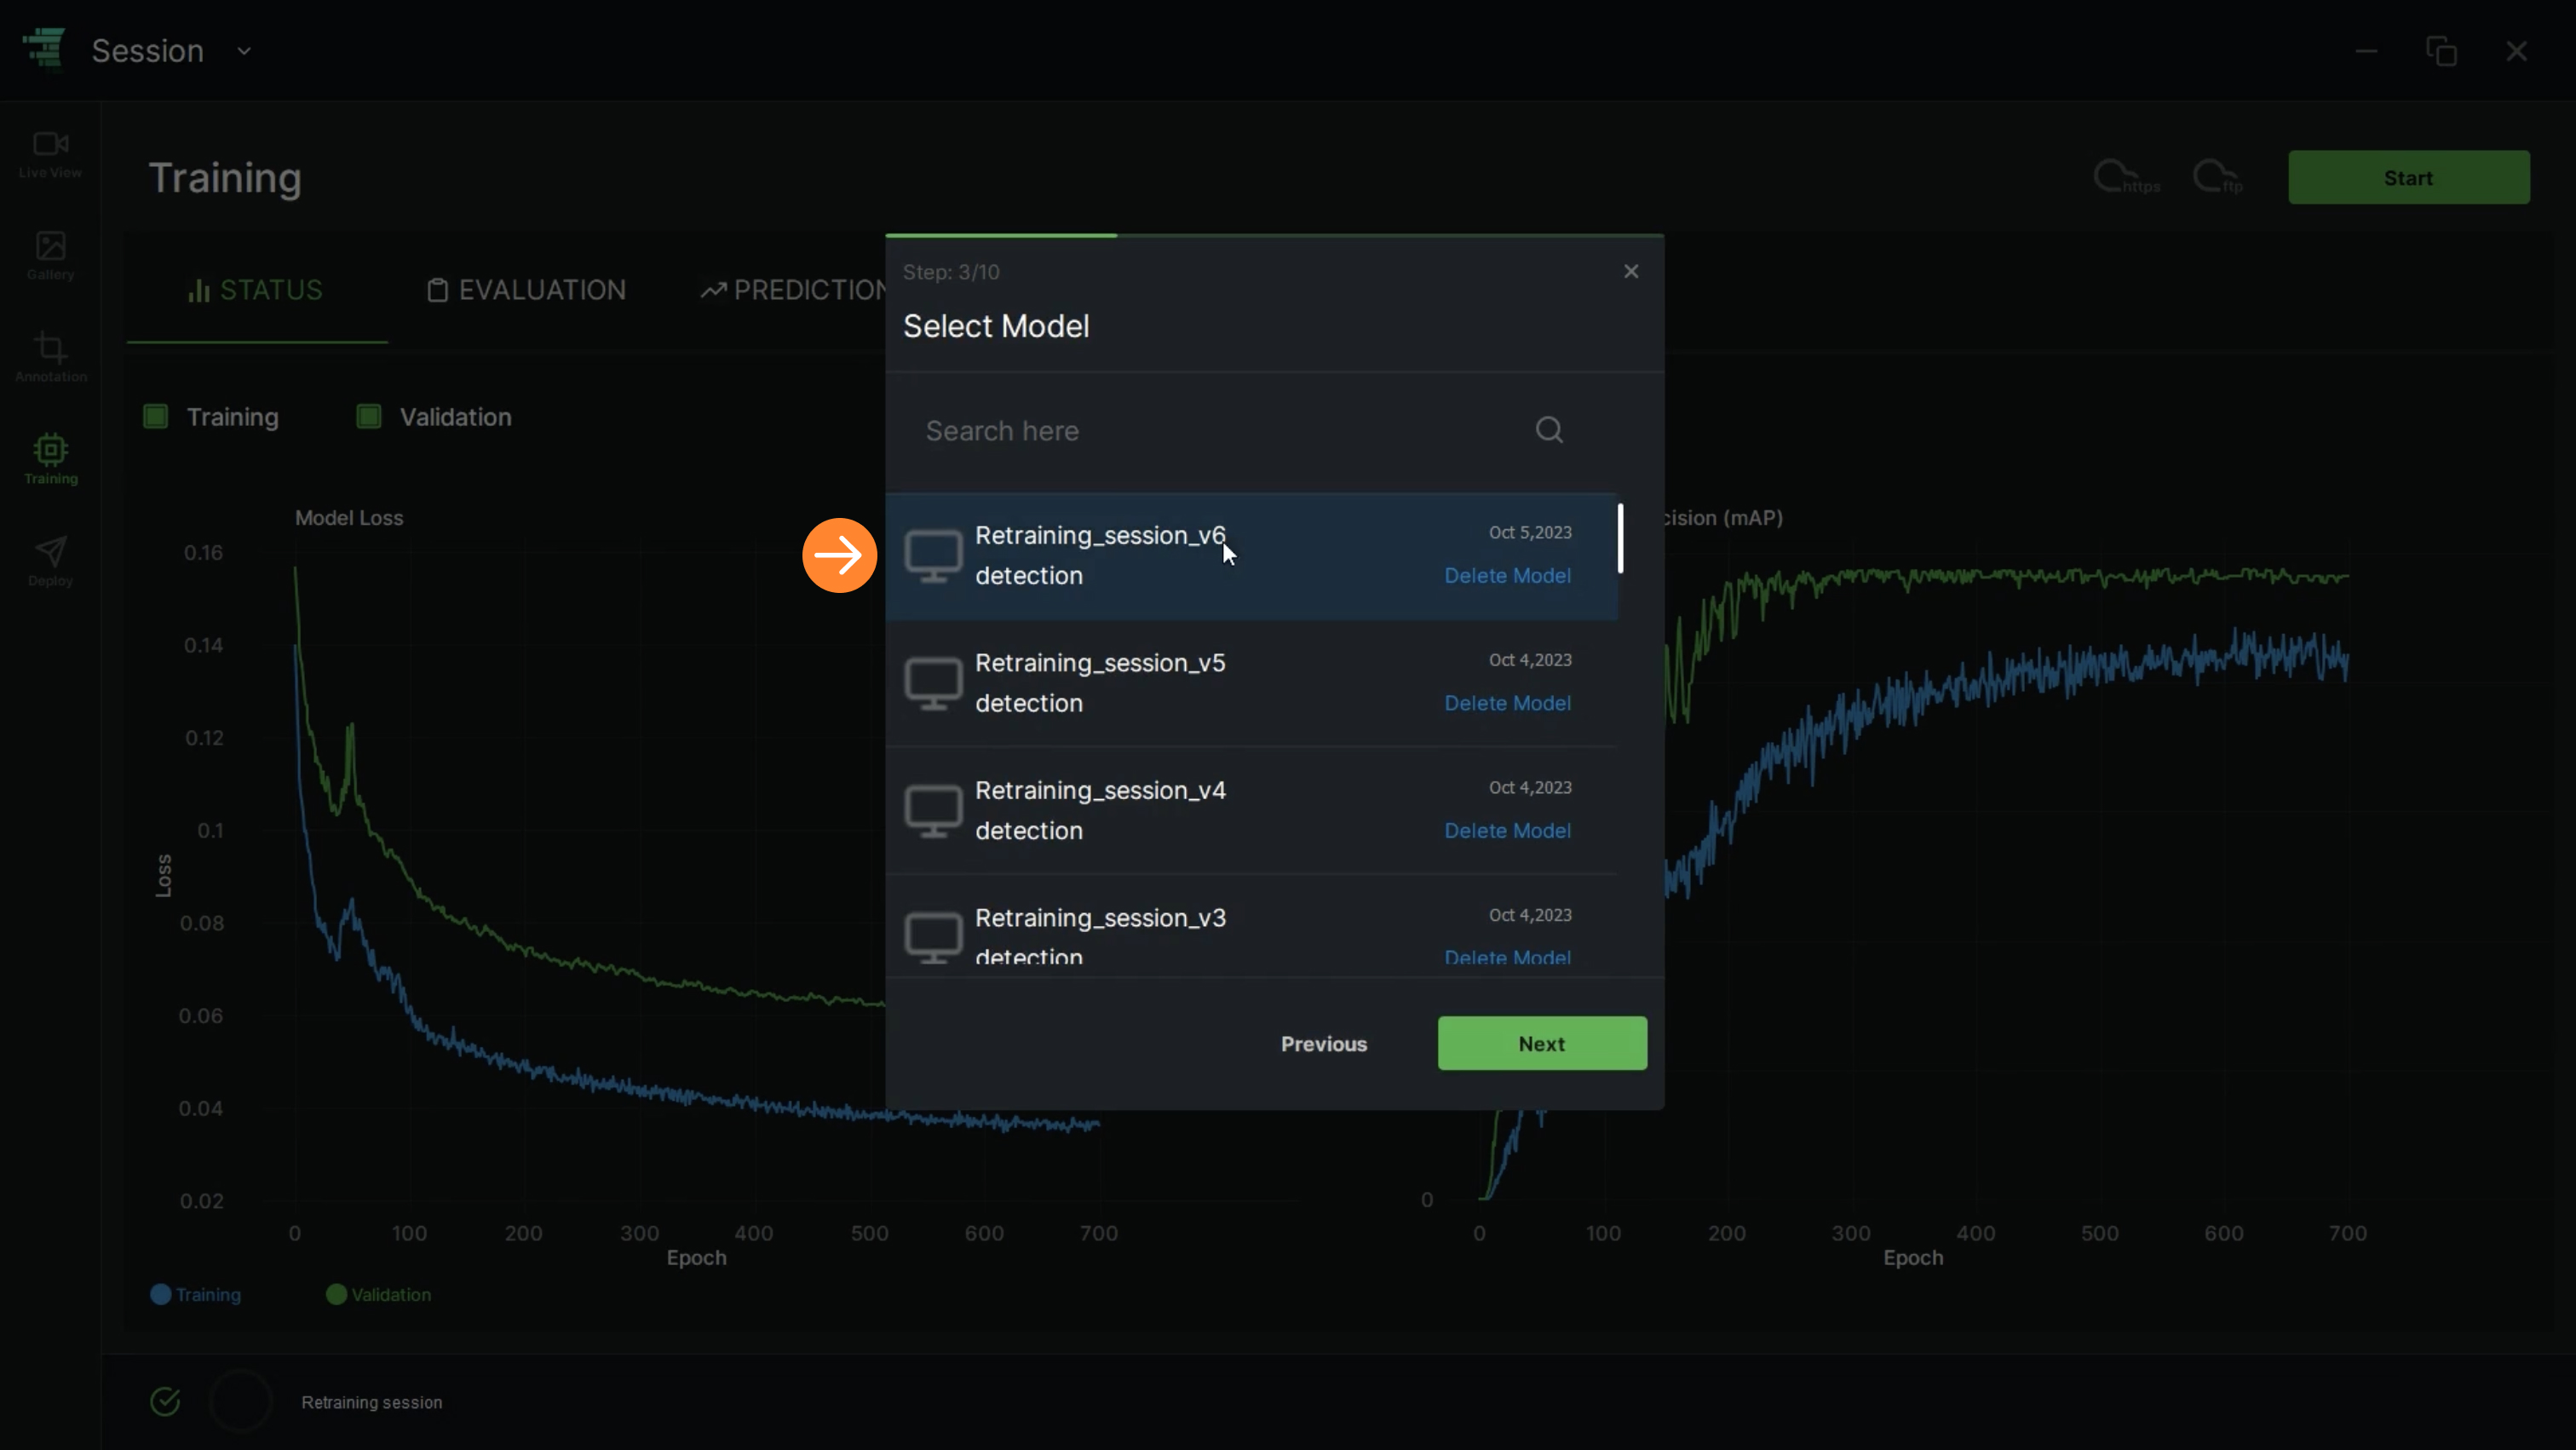
                5. Select the model (E.g. Scratch Detector) that will be used for retraining and click on “Next”

                6.  Select the imageset and click on “Next”

                7. After selecting the component name (E.g. Classes), click on “Next”

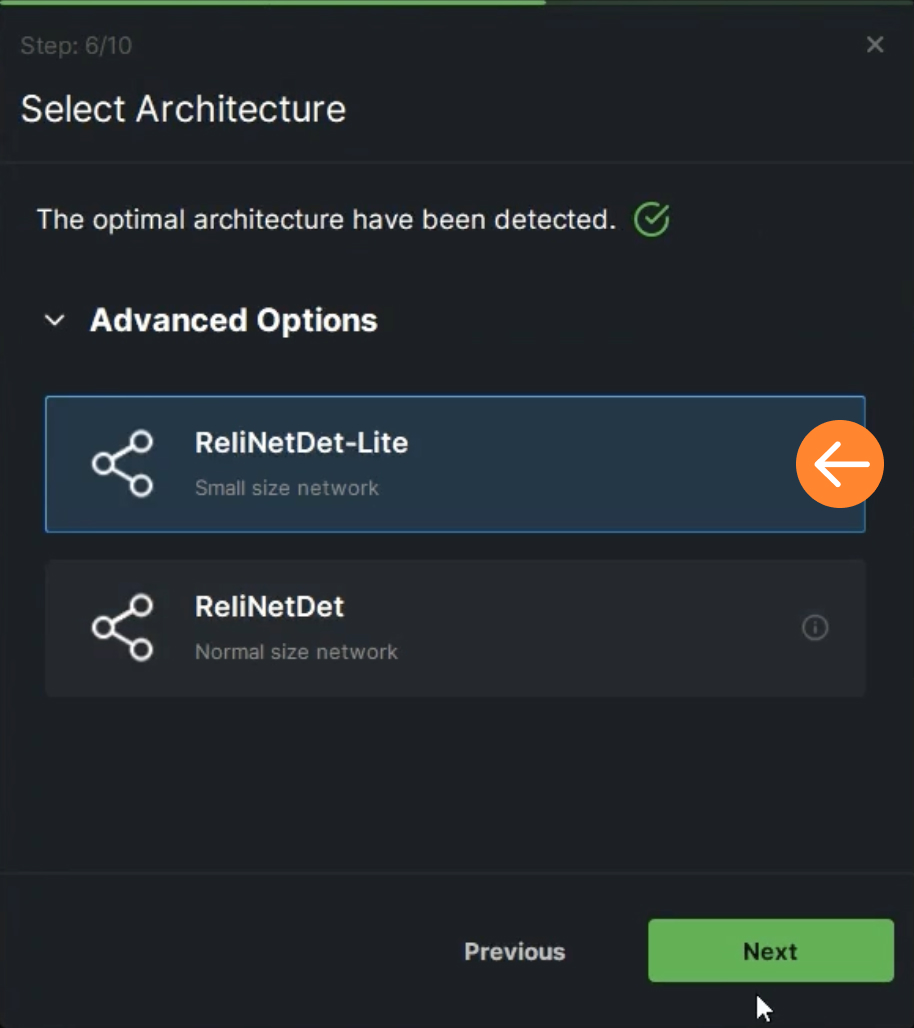
                8. Detecting the optimal architecture for the retraining is done automatically. The user can reconfigure settings from “Advanced Options”

                9. The user can select between the “Advanced Options”:

                • “ReliNetDet-Lite” can be chosen for a small-size network
                • “ReliNetDet” can be chosen for a normal-size network. Once it is selected, click on “Next”

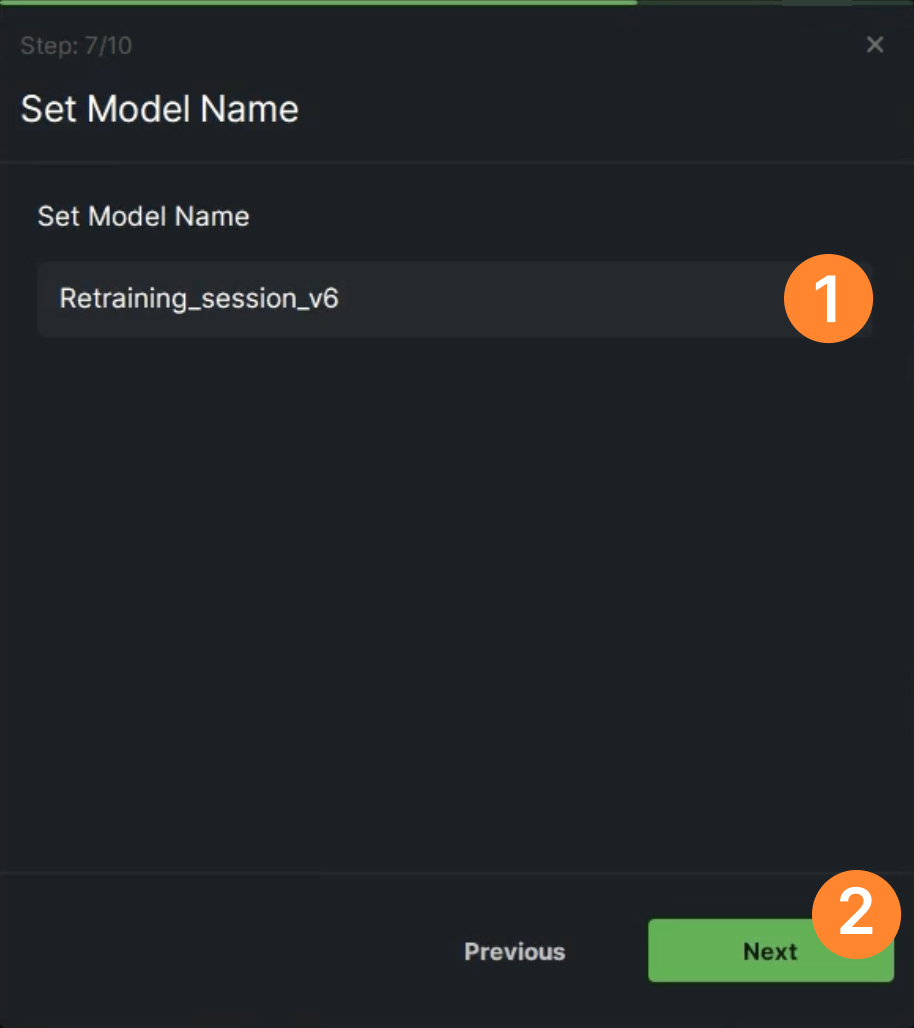
                10. Assign a model name (E.g. Retraining_session_v6)

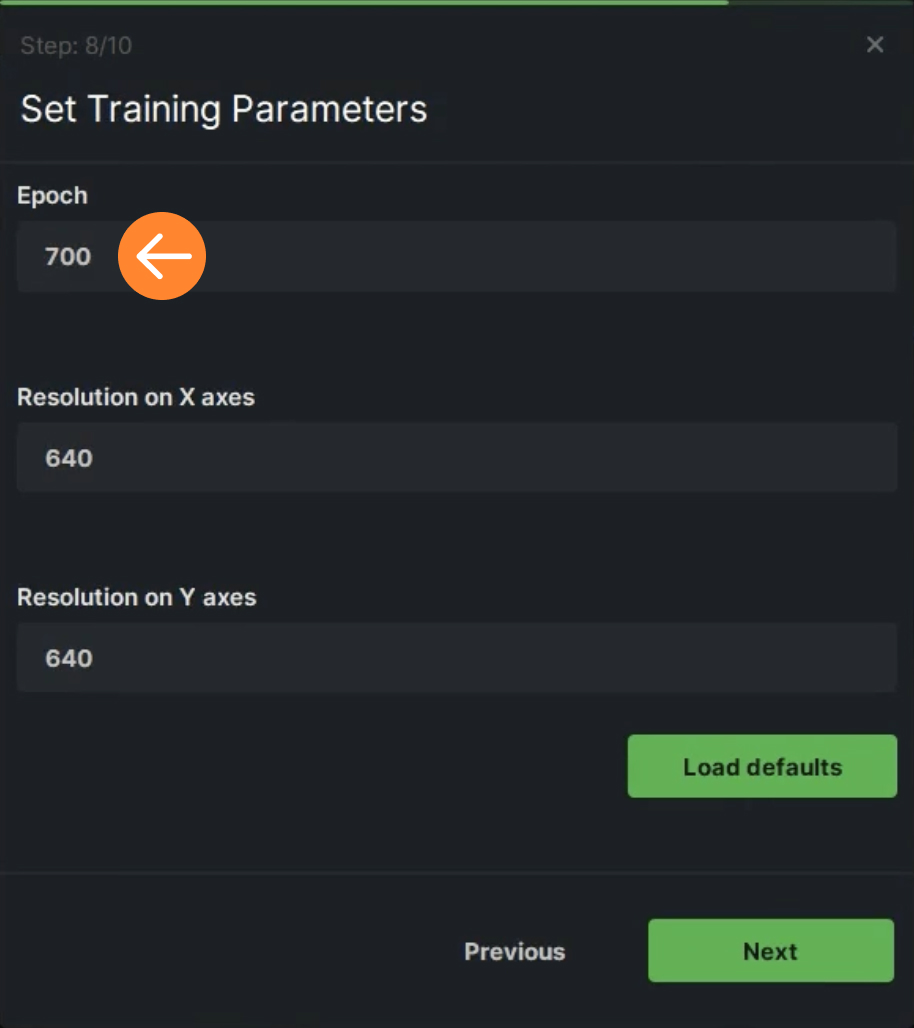
                11. “Load Defaults” button allows the user to set the retraining parameters automatically. Additionally, the user has the option to manually input custom parameters (E.g. Epoch: 700)

                12. If “Load Defaults” button is clicked, default retraining parameters are set automatically

                13.  Click on “Synchronize” button

                14. When the data synchronization is done, click on the button “Start Training”

                15. While retraining processes, the user can see the Model's Loss and Mean Average Precision (mAP) plot in real time

                16. Check the retraining process in the Status bar

                17. Once the retraining has finished, click on “Evaluation” tab to see the retraining statistics: Total Number of Images, Accuracy and Mean IoU

                18. The mispredicted images and their corresponding Mean IoU scores are displayed in the table view

                19. After the retraining process, the model becomes accessible among the trained models, allowing the user to utilize it once more for retraining

                ReliTrainer
                Quality Automation with AI and Relimetrics

                Deploying AI Solutions

                The pipelines built using the trained AI blocks together with basic blocks within in the pipeline editor (accessible via the client app ReliUI connected to the ReliTrainer) are the AI solutions to be deployed to the edge inference module, namely to ReliAudit. Deployment has 2 steps:

                • Moving the ready pipeline from ReliTrainer to ReliAudit: In a typical all-in-one-machine self-installation case, moving a ready pipeline from ReliTrainer to ReliAudit is simply done by clicking the three dots at the top right corner of the pipeline in the pipeline editor’s pipeline gallery screen and choosing the “Move to ReliAudit” option. This will move a copy of the pipeline to the “$Local_RV_Folder/Reli_bundle/Volumes/reli_audit_light/LOAD_PIPELINE” folder.  In an enterprise (distributed) installation, the ready pipeline should be exported first and the exported pipeline zip file must be carried to the “$Local_RV_Folder/Reli_bundle/Volumes/reli_audit_light/LOAD_PIPELINE” folder of the machine where ReliAudit has been installed.
                • Audit configuration using the pipelines moved to ReliAudit : Audit configuration involves loading a pipeline, associating it with an audit and defining a binary OK/NOK decision rule for the loaded pipeline. This step is explained in the Audit Configuration section of this user guide.
                ReliTrainer
                Quality Automation with AI and Relimetrics

                Reviewing Assets

                You can review all your assets in ReliTrainer using the web based ReliBoard dashboard. Reliboard is a comprehensive and intuitive integrated dashboard of ReliTrainer for user, data and AI model management. You can

                • Open and manage user accounts used in ReliUI to access to ReliTrainer
                • Review datasets available in ReliTrainer for AI model training and testing purposes,
                • Review trained AI models and compare them on selected datasets to choose the best model and gain insight to the effects of hyperparameters,
                • Review usage statistics to monitor system utilization,
                • Review system logs

                1. ReliBoard features seven pages.

                2. The “Home” page provides a general overview of the dashboard. This page serves as the gateway for users to access and explore data models, task distribution analytics, and associated reports.

                3. In the home menu, the user can check the count of;

                • Imagesets
                • All images
                • Models
                • Users
                • Model Types
                • Model Architectures

                4. It is a user-friendly interface to navigate through the analytics features (E.g Task by Date and Types, Model Types and Architectures), making it easy for users to initiate analyses and gain valuable insights into their data and task performance.

                5. The “Imagesets” page features a comprehensive table detailing the distribution of imagesets and labels.

                6. In the table view, the user can check:

                • Name
                • Creator
                • Image Count
                • Date
                • Detail

                7. The user can filter the data by clicking on the “Filter” icon on each column. Filter can be done by predefined options or the user can type it to the text field.

                8. Filters can be removed by clicking on the “Clear” button on the Filter pop up.

                9. If the user clicks the “Detail” button at the last column, imageset details will be displayed. This column provides the user with quantitative insights for data analysis and facilitates a closer examination of each label category alongside corresponding images.

                10. The graphs on the top show the distribution of labels of the selected imageset and the table on the bottom shows all details of each image.

                11. The user can check or filter the images by:

                • Name
                • Width & Height
                • Channel
                • Username
                • Date

                12. The “Models” page presents a table with filtering options, enabling users to compare the performance of models architecture tailored to specific model types for a given imageset.

                13. The user can compare models' performance based on a specific imageset.

                14. The page view can be customized by applying various filters available in the table, tailoring it to meet the specific user requirements.

                15. The user can check and compare the models by:

                • Name
                • Type
                • Architecture
                • Imageset
                • ROI Group Name
                • Num Classes
                • Training Results (E.g. Validation Accuracy Validation IOU, Validation Map50)
                • Date

                16. The “Model Comparison” page serves as an AI model comparison, enabling users to assess the performance of a single model type using a single image set and label set.

                17. In the table view, the user can explore the impact of hyperparameters on the performance results.

                18. In the graphic view, performance metrics are showcased to facilitate a comparison of all models filtered based on the specific model type.

                19. Insights into the effect of hyperparameters on the model's performance are visually represented through graphics.

                • Val IOU
                • Val Acc
                • Val Map50
                • Epoch
                • Learning Rate
                • Momentum

                20. The “Tasks” page allows users to filter task types (training or prediction) to examine model hyperparameters for each task type.

                21. Visualize the impact of hyperparameters of models on a single imageset and/or on a specific task type. 

                22. Customize the page view by applying various filters available in the table, tailoring it to meet the specific user requirements:

                1. Task Type
                2. Imageset
                3. ROI Group Name
                4. Hyper Parameters (E.g. Epoch, ResX…)
                5. Username
                6. Status

                23. The “Users” page presents the list of users and details about their activities, allowing for easy status tracking:

                • User name
                • User role
                • Is Active
                • Date
                • Delete

                24. “Create User” button enables creating a new user by filling in the necessary details.

                25. The “Logs” page records all issues and errors generated by the training server during AI tasks. This comprehensive log is crucial for debugging the system when an error is reported by the customer, allowing for efficient identification and resolution of issues.

                26. Customize the page view by applying various filters available in the table:

                • Source Api
                • SourceFunction
                • Message
                • Level
                • Date
                Quality Automation with AI and Relimetrics

                Manufacturing Company Performing QA with ReliVision

                User Profile: A hardware and/or service vendor without manufacturing but with a rich portfolio of manufacturing customers.

                Sample Storyline: Following the system installation and hardware integration

                • The customer’s R&D team is briefed about a QA automation task by the production engineers.
                • The R&D team collects images from the shop floor either totally remotely or by using the operators in the field and pulling the images from the shop floor.
                • The R&D team either annotates the data or delegates annotation task to annotators registered in the system.
                • The R&D team reviews the annotated data.
                • The R&D team divides the data into training and testing sets.
                • The R&D team builds a solution pipeline and uses the prepared training dataset to train the AI block(s) in the solution pipeline. The training is evaluated automatically using a validation set determined at random as a (user specified sized) subset of the training data.
                • The R&D team runs experiments with different AI models selected from the AI model library, different hyperparameter settings, (if available) different training sets and compare their performances on the spared testing set.
                • The selected AI solutions are incorporated into the solution pipeline and deployed remotely.
                • The deployed solution runs in the shop floor while logging outputs.
                • Field operators check the manufacturing process and find no problem.
                • Field operators sample and review the system outputs to accept/dispute the results.
                • The R&D team pulls the disputed results and retrains the AI blocks in the solution pipeline.
                • The improved solution is compared with the existing solution and is deployed remotely

                User Profile:  A manufacturing company without its own R&D team but with vast shop-floor operations

                Sample Storyline: Same scenario but with Relimetrics team remotely providing the R&D services for the customer if/when needed.

                Quality Automation with AI and Relimetrics

                Partner Company Offering ReliVision to its Customers

                User Profile: A hardware and/or service vendor without manufacturing but with a rich portfolio of manufacturing customers.

                Sample Storyline:

                • The partner’s support team presents the sample solution, that they had pre-built on sample data (w/o Relimetrics support), to their customers.
                • The partner’s customer is interested and wants to try ReliVision. So, the partner’s support team organizes a training session on how to use the pre-built solution.
                • The customer asks for a customization of the pre-built solution.
                • The partner’s support team acquires data from the customer, anotates it, trains a custom solution for their customer and deploys, all without any coding.
                • The partner’s customer uses the solution in conjunction with the partner’s hardware and/or services.
                • After some time, the partner’s customer comes up with a totally new use case and asks the partner for a solution.
                • The partner’s support team offers to train their customer on how to design and train a solution on their own:
                • The customer agrees and a training session is organized by the partner, with support from Relimetrics.
                • OR
                • The customer wants a turn-key solution, so the partner’s support team designs, trains and deploys a new solution, all without any coding. The partner’s support team consults Relimetrics if/when needed.
                ReliAudit
                Quality Automation with AI and Relimetrics

                Audit Configuration

                AI solutions, individual AI Blocks or complex pipelines, can be deployed to multiple points of operation and configured for your use case specific audit/inspection needs. An audit is a single inspection task that can be composed of multiple checks each performed by a single AI pipeline. Each pipeline has a native range/space of possible outputs, such as objects or defects it is trained to detect/segment, a list of possible classes it is trained to classify among, etc. 

                In Audit Configuration, each loaded pipeline is added to / associated with an audit and its OK/NOK binary decision rule is defined. By design, the audit configuration system allows the user to define the OK rule per pipeline. An audit output is OK if and only all associated pipelines give an OK decision.

                Loading and configuring a pipeline:

                Below, we will go through the steps of loading a pipeline, associating it with an audit and defining its OK rule:

                • Make sure to have the desired pipeline zip file in the “$Local_RV_Folder/Reli_bundle/Volumes/reli_audit_light/LOAD_PIPELINE” folder

                • Make sure to have the desired pipeline zip file in the “$Local_RV_Folder/Reli_bundle/Volumes/reli_audit_light/LOAD_PIPELINE” folder

                • Make sure you have Python 3 installed (see SW prerequisites)

                • Open a terminal (command line) and go to “$Local_RV_Folder/Reli_bundle/Volumes/reli_audit_light/LOAD_PIPELINE” folder

                • Choose the pipeline you want to load by entering its number. You will be presented with all available audits.

                • Either select an existing audit to add the pipeline to or create a new audit.

                • Once the new pipeline is added to a new/existing audit, you are asked to define the OK rule for that pipeline. The system lists all possible pipeline outputs (pipeline output range) and requires you to enter a condition for each possible output. In the above example, the new pipeline has one possible output type, which is “Active Scratch”. So we will enter the OK condition on Active Scratch only. For this case, we define OK to be no Active Scratch, i.e. “=0”

                • Finally, you are asked to remove or keep the pipeline zip file and you are DONE.

                • If there are multiple possible pipeline outputs, such as the case below (Mullion, Operator, Tool 1, Tool 2), you are asked to define the OK condition for each and the pipeline’s OK condition will be an AND combination of all. 

                  More specifically, the above pipeline output is OK if and only if there is exactly 1 Mullion, 2 Operators, more than 1 Tool-1 and less than 10 Tool-2.

                All audits thus configured are listed in ReliWeb’s current audit drop-down menu and are available to be activated.

                Deleting and Duplicating an audit:
                Use the self-explanatory delete.bat  and duplicate.bat to delete or duplicate an existing audit. 
                ReliAudit: Inspect, Monitor and Control
                Quality Automation with AI and Relimetrics

                Inspect & Monitor

                Running and Monitoring a deployed (pipeline) solution

                Under construction
                ReliAudit: Inspect, Monitor and Control
                Quality Automation with AI and Relimetrics

                Sample & Review

                Sampling & Reviewing (accept/dispute) inference outputs

                Under construction
                ReliAudit
                Quality Automation with AI and Relimetrics

                On-Prem Integration

                The edge inference module ReliAudit can be integrated with your external (manufacturing, testing, inspection, etc.) systems using 4 endpoints. Below you can find the details about using the ReliAudit endpoints for integration with external systems, including the data acquisition systems.

                • Init_audit:
                  Initializes the audit specified by the audit name. Initialization includes loading all required pipelines with AI models and “warming up”. This call usually takes a couple of seconds (depending on pipelines and models). 

                • Start_audit:
                  Starts a new audit/inspection instance of the specified audit name for the object of interest (e.g. product) specified by an ID. Audit name must be the same as passed to the last call of init_audit. Product ID is used to identify the individual objects (e.g. products) and will be displayed in the ReliWeb as the “Serial Number”. In ReliAudit, there are no constraints on ID (a string). Endpoint returns unique audit ID.

                • Add_image:
                  Adds image specified by file path to the audit specified by an ID. Audit ID must be the same as the ID returned by the last call of add_image. Depending on the configuration, each audit can have one or more inspection points and thus one or more images. Name of the inspection point is passed to the add_image along with other parameters. ReliAudit processes each image immediately after it is added (sent) to the audit. After calling the start_audit, external data acquisition is required to call add_image for every inspection point in order to finalize the audit. The final audit results (OK/NOK) will be displayed in ReliWeb. 

                • Get_results:
                  Returns the audit results specified by the audit ID, the time interval, the product ID (serial number) or the number of last audits. 

                • Get_status:
                  Returns the list of available audits and the current Initialized audit.

                For POST requests, data should be sent in the request body as JSON. For GET requests, data should be sent as query parameters in the URL. All endpoints are implemented synchronously. The endpoint returns a response once the task is finalized.

                For further details, please contact info@relimetrics.com.

                Quality Automation with AI and Relimetrics

                ReliAudit: Shop-Floor Integration

                ReliAudit is the optional edge module of ReliVision for automated QA system integration on the shop-floor, built on the RMIE engine. It natively ReliAudit is the edge module of ReliVision for deploying and monitoring the AI solutions built and trained using ReliTrainer. It natively communicates with ReliTrainer over secure VPN connections to receive ready-to-deploy AI powered solutions (pipelines), solution updates and to send audit results and statistics. Its web interface allows users to review audit results and provide feedback using any web browser right on the shop-floor. 

                Multiple ReliAudit modules may be connected to a single ReliTrainer. Each  ReliAudit is triggered externally by a data acquisition API (DataAcq.API) which acts as a systems integration interface. 

                The ReliAudit,

                • Runs AI solutions built and deployed by ReliTrainer when triggered by DataAcq.API

                • Generates complex audit results by executing configurable logic on (multiple) AI solution(s) involved in a single audit instance

                • Saves audit results to local DB to be exported if/when needed

                • Presents audit results via a web interface

                • Accepts user feedback in the form of Accept/Dispute decisions on Audit results to improve performance and/or adapt to changing conditions

                ReliAudit can communicate with custom DataAcq.APIs that are tailored for specific (shop-floor) needs and systems integration requirements in compliance with ReliAudit’s communication standards.

                Relimetrics also offers optional hardware blueprints to cover a wide range of practical applications, together with ready to use  DataAcq.APIs compliant with these blueprints. These blueprints include:

                • Single Camera: A single static camera inspection system suitable for audits from a single viewpoint.

                • Static MVS: A static multi-camera inspection station system suitable for audits that require multiple viewpoints.

                • Robotic MVS: A robotic gantry with mounted multi-camera setup for audits that require multiple and variable viewpoints.

                • Scanning MVS: A line-scanning setup suitable for high resolution inspection of flat surfaces

                ReliMVS in action

                ReliScanner in action

                ReliAudit
                Quality Automation with AI and Relimetrics

                Review Results

                You can monitor individual audit/inspection results, provide feedback by accepting/disputing results and review audit statistics using the ReliWeb, a web-based HMI. ReliWeb has two main parts to provide these functionalities, the Audit Results tab and the Audit Analytics tab. The former is for individual audit/inspection review and the latter for retrospective statistical analysis to see trends as a function of time and audit outcome.

                1. The Audit History displays the Audit outcomes conducted by the AI solutions, allowing the user to see the quality check and inspection results in real time.

                2. The user can type the “Search Audit” area to view the results and use the “Select Option” filter to customize the audit results display based on specific preferences.

                3. Once completed, click “Run Audit” to generate and display the audit results in detail. The Audit Results tab will show a “Processing” status until the audit is fully completed and the results are ready for review. To view these results, click on any button in the “Audit Result” column.

                4. The user can check a comprehensive breakdown of the audit results, highlighting areas of interest such as detected defects (1), showing/hiding annotations (2), and zooming (3) on the detected components.

                5. The user can accept or dispute the audit results. This feedback loop is vital for refining the AI models and adapting to changing production conditions.

                6. The user can review previous audit results by navigating to the "Audit History" tab on the main page.

                1. The main tab displays the number of audits conducted over specific periods, such as by date and hour. This temporal analysis helps in identifying peak times, trends, and patterns in audit activities.

                2. The user can filter audit results based on their needs, selecting options to view audits performed on a monthly, weekly, daily, or hourly basis using the filter (1). After choosing the desired filter, click the “Update” button (2) to refresh the results.

                3.  The table view displays the audit outcomes, including the count, type, and percentage in relation to the total number of audits conducted over a specified period.

                4. The 'Other' audit section highlights the primary reasons for unsuccessful audits, providing details on the number and type of these audits.

                5. In the graph view, audit results are presented in a user-friendly format, allowing users to easily review audit outcomes filtered by hour, day, week, or month.

                Download