Cookie Consent by PrivacyPolicies.com

Welcome To Relimetrics!

Your Information

Password Settings

Reset password
Thank you! Your submission has been received!
Oops! Something went wrong while submitting the form.

Welcome to Relimetrics

Your account is being reviewed for approval and will email you shortly with the next steps.
In the meantime, if you would like assistance in setting up ReliVision tailored to your specific needs,
feel free to book a meeting with one of our engineers.

Book a meeting

If so, we can connect you with one of our sales engineers who will assist you.

If you prefer running it on-premise, please ensure that your system meets the baseline specifications.
You can find them in our Knowledge Hub under System Requirements Tab.
If you choose to use our cloud service, we can provide you with a 3-days trial.

Thank you! Your submission has been received.
We are currently reviewing it and will email you shortly with the next steps.
Oops! Something went wrong while submitting the form.
Quality Automation with AI and Relimetrics

ReliTrainer Engine Installation

  • 1. Check server hardware configuration minimum requirements
  • a. GPU: Nvidia GPU with minimum 16GB dedicated VRAM and tensor cores (eg. lowend - T4 GPU; highend - A100 recommended)
  • b. HDD: 100+ GB
  • c. RAM: 64+ GB
  • d. Connectivity: Static IP & reserve 3 ports (default: 5001,5002,5672) for communication (in case you need to use ports other than the default ones, contact Relimetrics)
  • 2. OS installation: Ubuntu 20+ / Windows 11
  • 3. Install Docker v20+ with GPU capabilities
  • a. GPU: Nvidia GPU with minimum 16GB dedicated VRAM and tensor cores (eg. lowend - T4 GPU; Installation to Ubuntu v20+ :
  • i. Make sure to have Ubuntu v20+ updated
  • ii. Download and install the NVIDIA CUDA enabled driver for the GPU installed in your server.
  • iii. Install Docker Engine on Ubuntu using one of the installation options
  • iv. Optimize linux server for docker following the linux post-installation steps for Docker Engine
  • v. Install Nvidia Container Toolkit following “Installing with apt
  • vi. Configure the installed docker following “Configuring Docker
  • b. Installation to Windows 11:
  • i. Make sure to have Windows 11 updated
  • ii. Download and install the NVIDIA CUDA enabled driver for the GPU installed in your server
  • iii. Install WSL 2
  • 1. Launch your preferred Windows Terminal / Command Prompt / Powershell and run “ wsl.exe --install
  • 2. Update WSL kernel by running “ wsl.exe --update
  • 3. Run “ wsl.exe “ (Choose Ubuntu 20.04 for Linux Distro Version)
  • iv. Download and install Docker Desktop for Windows
  • c. To verify that you can run containers with GPU support, launch your preferred Windows Terminal / Command Prompt / Powershell and run “ docker run --rm --gpus all ubuntu nvidia-smi“. You should see a terminal output such as the following
  • 4. Install ReliTrainer Engine
  • a. Get your licensed Relitrainer Engine package from Relimetrics
  • b. Unzip the package to a temporary folder
  • c. Open a terminal and go to the temporary folder with unzipped package
  • d. Run
  • i. “ docker compose --verbose up “ OR
  • ii. “ docker-compose -f docker-compose.yml up -d “ (for background installation)
Quality Automation with AI and Relimetrics

ReliUI Client Installation

  • 1. Check server hardware configuration minimum requirements
  • a. HDD: 100+ GB
  • b. RAM: 64+ GB
  • 2. OS installation: Windows 10+
  • 3. Download the licensed ReliTrainer Client package (Request a copy)
  • 4. Unzip the package to an applications (permanent) folder
  • 5. Edit the configuration file (settings.json) to set ReliTrainer and ReliAudit IPs
  • {
     "audit_port": 3011,       —> ReliAudit Engine STATIC port
     "audit_url": "127.0.0.1", —> ReliAudit Engine IP 
    "base_port": 5001,   —> ReliTrainer Engine STATIC port 
    "base_url": "127.0.0.1",  —> ReliTrainer Engine IP 
    "is_demo_mode_on": false, 
    "is_verbose_mode_on": false, 
    "mbroker_port": 5672,     —> Message Broker STATIC Port  
    "proxy_port": 0,
     "proxy_url": "",
     "sftp_password":   —> DO NOT EDIT
    "AwIh8tkz3jt9NC/qIOt5/7DWwmOjVsF5HCA68wDjK7Hulu0=",
     "sftp_target_path": "AwJchJQX22AnTkLWDtYT6A==", —> DO NOT EDIT 
     "sftp_username": "AwKpqv4h40MZShyfQ50=" —> DO NOT EDIT 
    }
  • 6. Run “ Relimetrics_Trainer_app.exe
ReliVision Version 2.0
Quality Automation with AI and Relimetrics

ReliTrainer: Data Curation

Data Curation functions of the ReliTrainer module, available through ReliUI, cover data annotation and management services through the desktop application that communicates with the ReliTrainer module. ReliVision supports most common industry standard annotation formats, including LabelMe, CoCo, Yolo-DarkNet, Yolo-V3, Yolo-V4, Yolo-V5. The functions are grouped into data import/export and data annotation.

Importing/Exporting Data

  • Import Raw Dataset

  • Import Annotated Dataset

  • Export Dataset

  • Extract ROIs

Data Annotation

  • ROI Annotation
  • Whole Image Annotation
  • Review and Manage

ReliTrainer: Data
Quality Automation with AI and Relimetrics

Importing/Exporting Data

Import Raw Dataset

1. The Gallery screen shows the datasets with the thumbnails. The user can create a new folder and import images or import annotated data. The user can import data by clicking on the “Import Data” button

2. The user can Import Data with the options below:

  • Import Images enables users to import files into a new imageset
  • Import Image Folders enables users to import folders with unannotated images
  • Import Annotated Dataset enables users to import annotated data formats below:
  • LabelMe
  • COCO
  • YOLO
  • Create Empty Imageset enables users to import an empty imageset

3. When the user selects the “Import Images” option and clicks the “Import” button, the import process initiates

4. The user should select images from the directory. Once images are selected, click on “Open”

5. The imported data will be shown as a new dataset on the Gallery screen

6. The user can check the images by double-clicking on the dataset folder. Users can:

  • Display images
  • Split datasets into training and test sets automatically with a random split or manually balance classes in train/test sets
  • Filter images to train/test/unassigned sets and statuses to annotated/not annotated
  • Select image for annotation

Import Annotated Dataset

1. The Gallery screen shows the datasets with the image thumbnails. The user can create a new folder and import images or import annotated data. The user can import data by clicking on the “Import Data” button

2. When the user selects the “Import Annotated Dataset” option and clicks the “Import” button, the import process initiates

3. The user can select one of the following annotation formats:

  • LabelMe is the native format of Label Me
  • COCO is the common JSON format for machine learning
  • YOLO is the favored annotation format of the Darknet family of models
  • YOLOv3 is the third version of YOLO family formats
  • YOLOv4 is a format used with the Pythorch part of YOLOv4
  • YOLOv5 is a modified version of YOLO Darknet annotations

4. When the user selects the “COCO” option and clicks the “Import” button, the import process initiates

5. The user should enter the folder directory. Once a file is selected, click on “Open”

6. The imported data will be shown as a new imageset on the Gallery screen

7. The user can check the annotated images by double-clicking on the imported folder. If any image is selected, the user can see the defined states and ROIs

Export Dataset

1. To export data, the user should choose a dataset folder from the Gallery. There are two options:

  • Click on the “More” icon () and select “Export” option to export all data
  • Double-click on the imageset. Once images are displayed, the user can select from the options: only this page, all images, or specific ones and then click “Export”

2. When the user chooses the “Select only this page” option, the images on the current page are selected

3. When the user chooses the “Select all images” option, all images in the folder are selected

4. The user can export individual images or selected ones:

  • Click on the “Apply Operations” icon and then select “Export”
  • Right-click on the chosen images and then select “Export”

5. Components can be selected among the existing ones. Once “Classes” is selected, click on “Export”

6. The user can select the “Export Images” option to export images and “Add File Names” option to add file names to the exported data

7. The user can choose one of the formats below:

  • LabelMe
  • COCO
  • YoloDarknet
  • Yolov3
  • Yolov4
  • Yolov5

8. When the user selects “COCO” or any format and then clicks on “Export”, the export process initiates 

9. The user should choose a directory and then click on “Select Folder” to save the data

10. The exported image folder and their corresponding annotations file are shown in the designated directory

11. The user can check if the data has been correctly exported and saved in the designated directory

Extract ROIs

1. The Gallery screen shows the imagesets with the thumbnails. The user can extract ROIs of an image folder. Once extracted, the Gallery will display an image folder containing these ROIs. To export this folder, simply click on “More” icon () and select “Extract”

2. Group names correspond to ROI groups within the imageset. By checking the checkbox “Group Name”, the user can export all ROI groups. The user can individually select ROI groups by clicking on the component name and then “Extract”

3. Once extracted, the Gallery will display an image folder containing these ROIs

4. The user can check the imageset by double-clicking on the imported folder. If any image is selected, the user can see the ROIs

5. The user can export these ROIs by clicking on “More” icon () and selecting “Export”

6. The user should select “Label Me” or any format and then click on “Export” to start the exporting process

7. Among the existing components, users can make selections. The user can either export ROIs along with the images by checking the “Export Images” button or export ROIs separately without the images. Once the component names “Classes” and “Export Images” are selected, click on “Export”

8. The user should choose a directory and then click on “Select Folder” to save the data 

9. The user can check if the data has been correctly exported and saved in the designated directory

ReliTrainer: Data
Quality Automation with AI and Relimetrics

Data Annotation

ROI Annotation

The image annotation screen offers drawing and editing tools that enable users to manually annotate an image. These operations are carried out within the context of the currently displayed image. The user can:
  • Navigate between images within an active image set
  • Zoom and pan an image using CTRL + Mouse Wheel
  • Generate regions of interest using basic shapes like rectangles and polygons
  • Specify classes and states for these regions of interest
  • Choose distinct colors for each class and/or state by color picker
  • Adjust existing regions of interest by modifying their properties (name, size, position, states), duplicating, or deleting them
  • Create a parent-child hierarchy to semantically group regions of interest

1. In the Gallery, the user should select a dataset to initiate the annotation process

2. The user can start the annotation by clicking any image from the image folder

3. The right-side menu plays an essential role in the annotation screen, consisting of two primary sections: States and ROI List. In the States section, the user can create, edit, or remove components (classes). States can be added to any predefined class. To create a new component, the user simply clicks on “Add Component”

4. First, the user should define the component name of the parent-child hierarchy

5. Once the component is created, the user clicks on the “Add state” icon (+) to add all the possible states

6. A different color can be assigned to every component or state through the color picker

7. Annotation Toolbar is located horizontally at the top of the Annotation Screen. Each tool in the toolbar is represented by an icon. The user should select the “Draw” icon to create ROIs

8. Based on the use case, the user can choose the appropriate annotation shape options below:

  • “Rectangle” is for area annotations
  • “Polygon” is for roughly or perfectly outlined annotations
  • “Whole Image” is for annotation without the region specification of the object

9. If the “Rectangle” option is selected, the user should define the ROI by drawing it

10. If the “Polygon” option is selected, the user should define ROI by connecting straight lines

11. Once an ROI is drawn, the user can select the appropriate defined class/state from the provided list

12. Once all the ROIs in the current image are defined, the user can proceed to the next image by either clicking on the arrows at the top or by using the shortcut CTRL+D

13. By clicking on any ROI, the user can modify its dimensions by adjusting its size as needed. Also, the user can delete an ROI by selecting and then pressing the “Delete” key on the keyboard

14. The user can copy and paste the same ROI by clicking on “CTRL+C”

15. Once the annotation is completed, the image's status is automatically changed to “Annotated” in the status column

Whole Image Annotation

Annotating the whole image without region specification

1. In the Gallery screen, the user should select a dataset to initiate the annotation process

2. The user can start annotation by clicking any image from the image folder

3. The user should select “Whole Image” option to annotate the image without any region specification

4. After choosing the “Whole Image” option from the annotation toolbar and then clicking on the image, a pop-up for states/components will appear. Simply click “Add Component” to continue with the annotation process

5. The user should define the component name from the STATES column

6. The user can change the color of the component through the color picker

7. Once all the ROIs in the current image are defined, the user can proceed to the next image by either clicking on the arrows at the top or by using the shortcut CTRL+D

8. Once a “Whole Image” ROI is drawn, the user can select the appropriate defined class/state from the drawn box. Also, the user can delete an ROI by selecting and then clicking the “Trash” icon in the top toolbar. Annotation can be repeated with identical steps for all images

9. Once the annotation is completed, the image's status is automatically changed to “Annotated” in the status column

10.  The user can double check the annotated images by clicking on the imageset

Review and Manage Annotated Dataset

The user can edit, review or manage annotated images. The user can:
  • Display images
  • Split image sets into training and test sets automatically with a random split or manually balance classes in train/test sets
  • Filter images to train/test/unassigned sets and statuses to annotated/not annotated
  • Load New Images
  • Apply Additional Operations
  • Select an image for annotation
  • Edit ROIs States
  • ROI list details: show/hide annotations, show/hide fillings

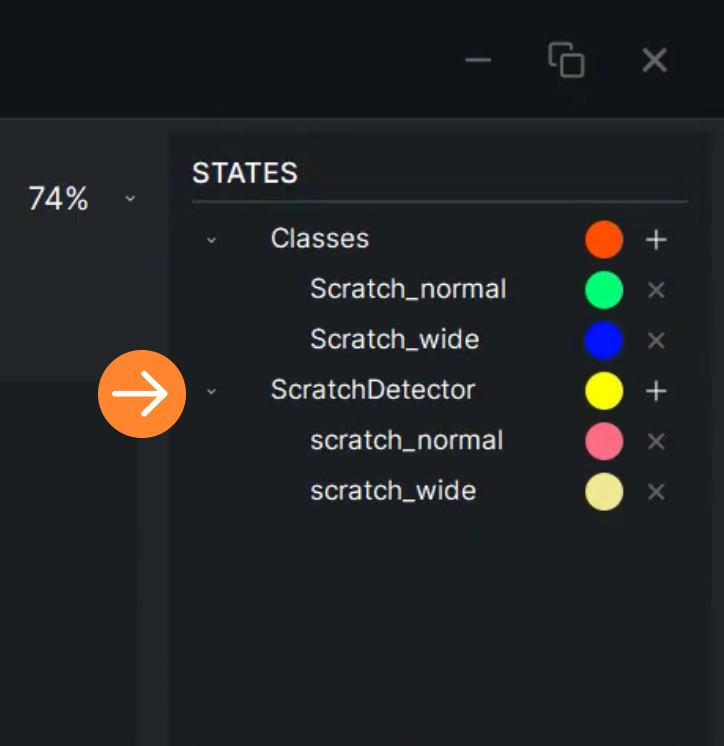
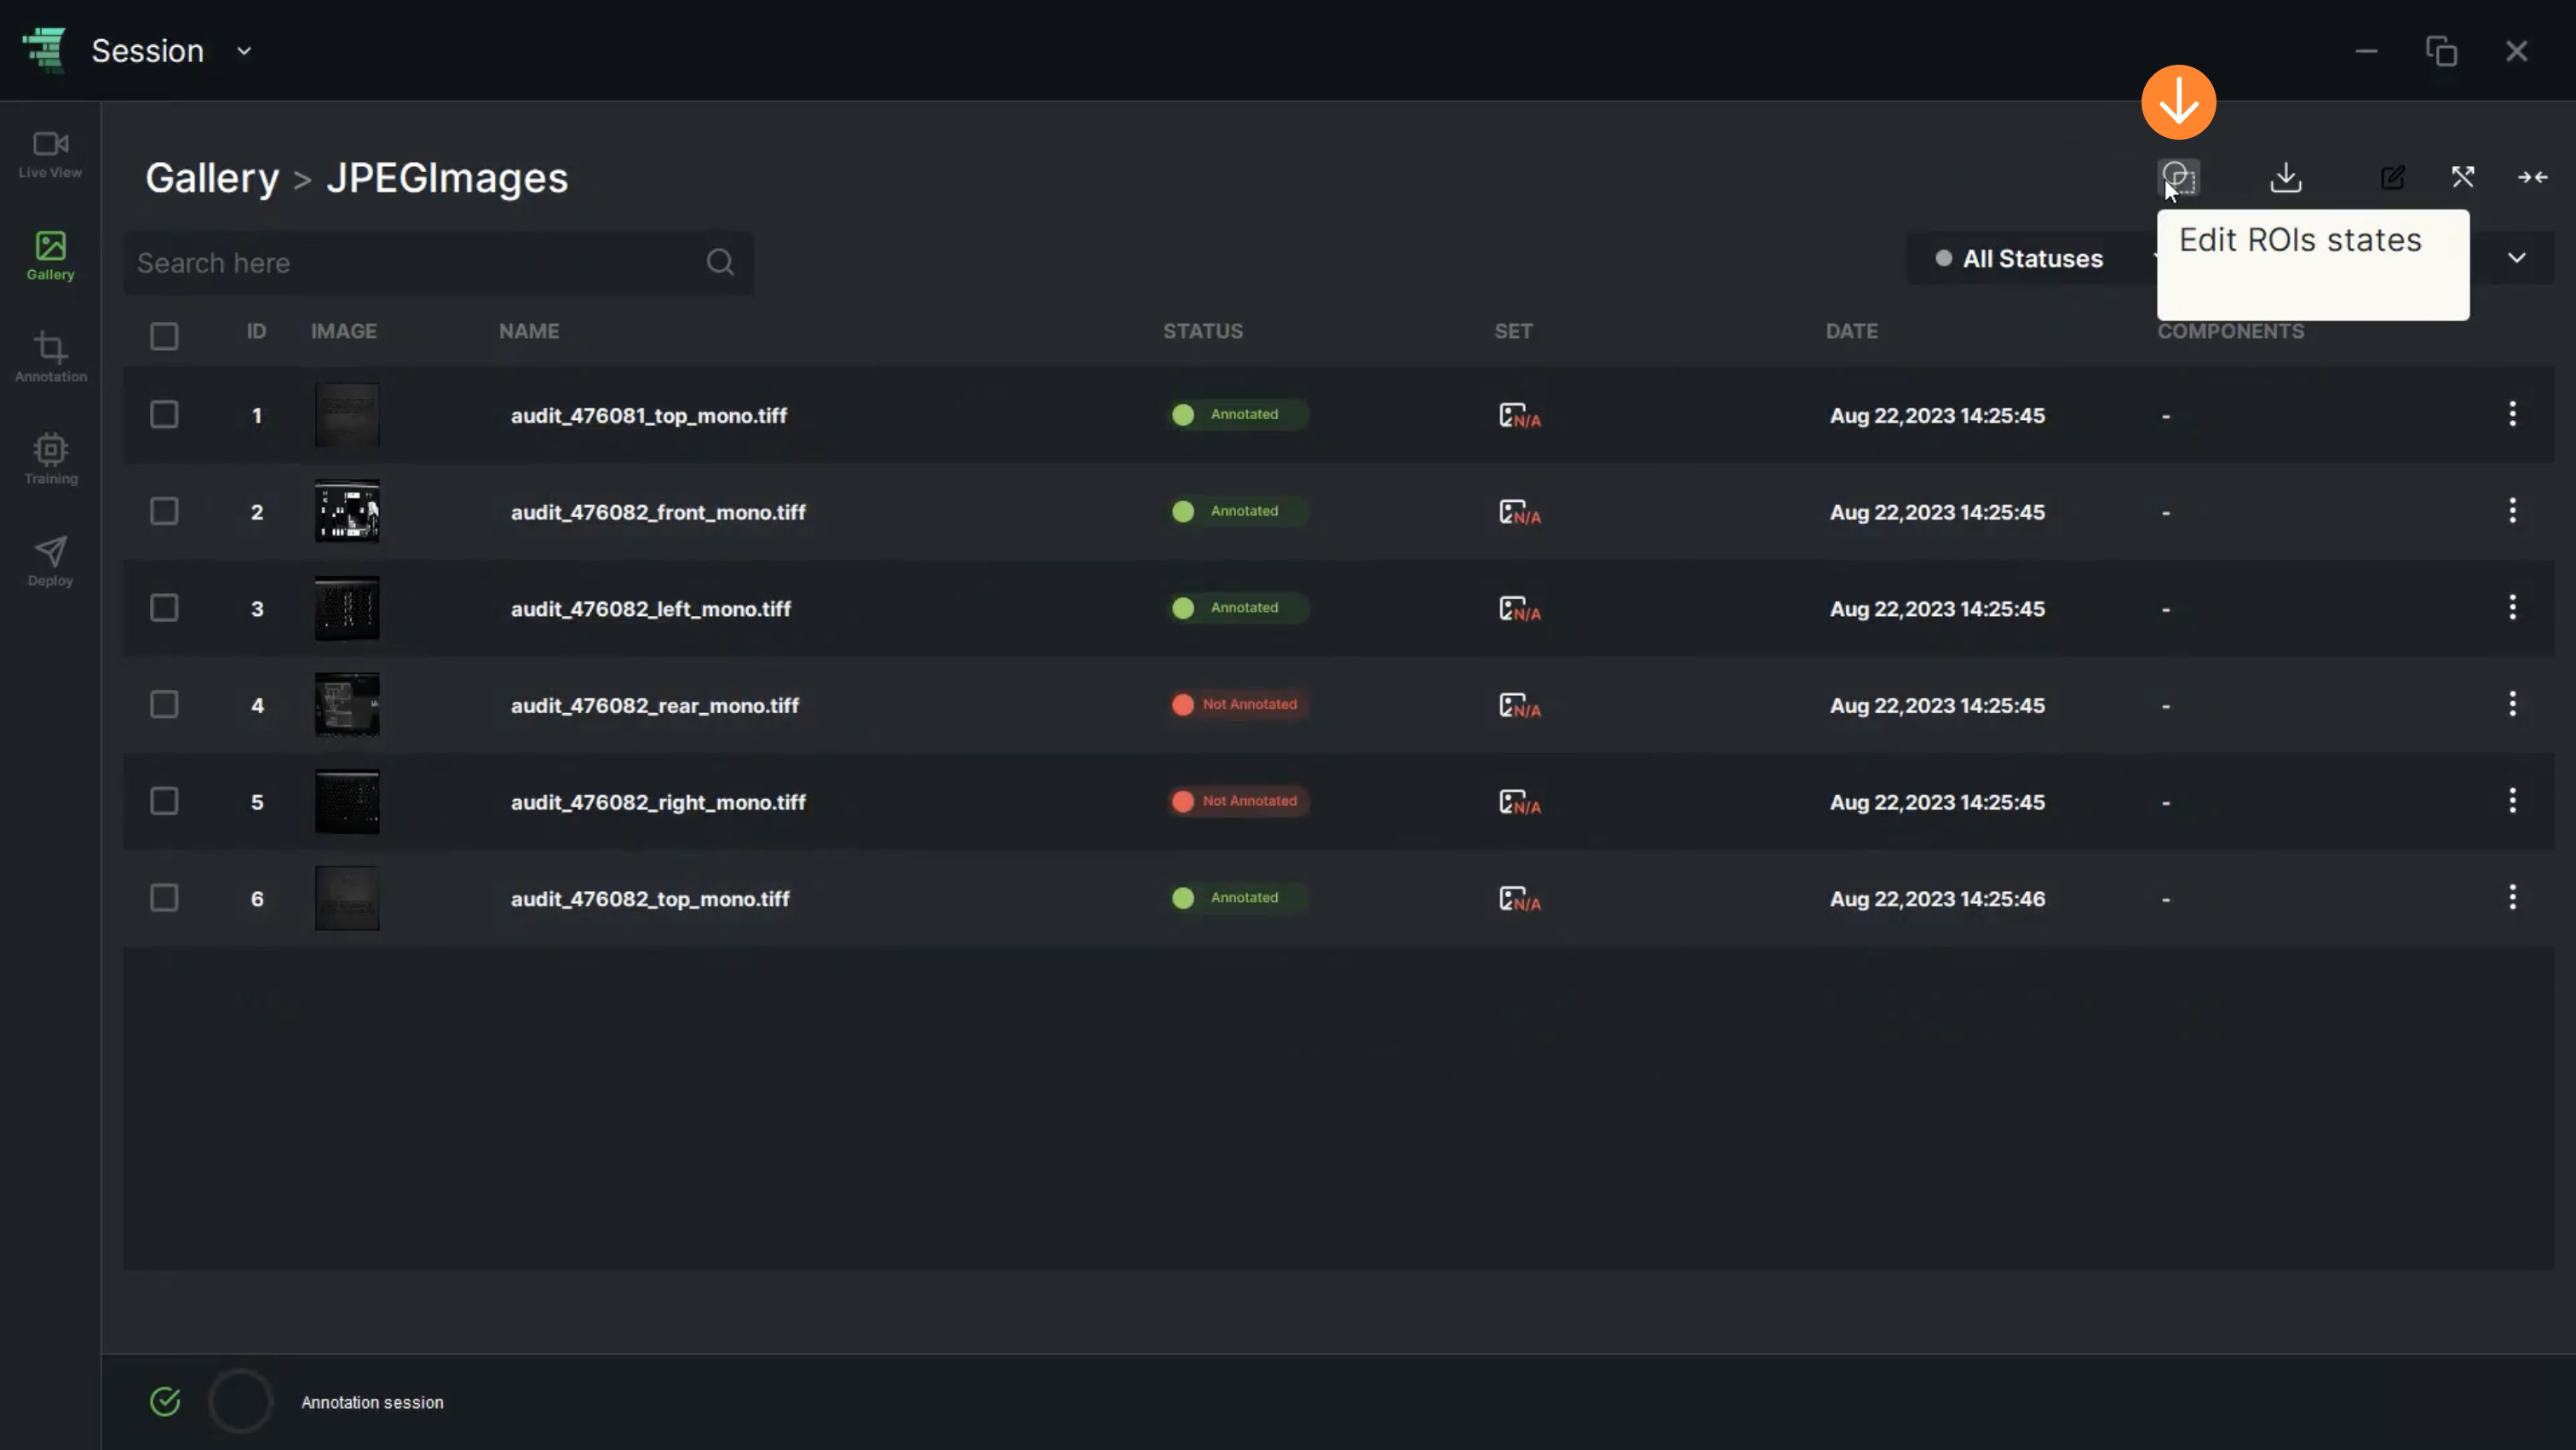
1. In the image list, “Edit ROIs States” allows the user to change the state of ROIs

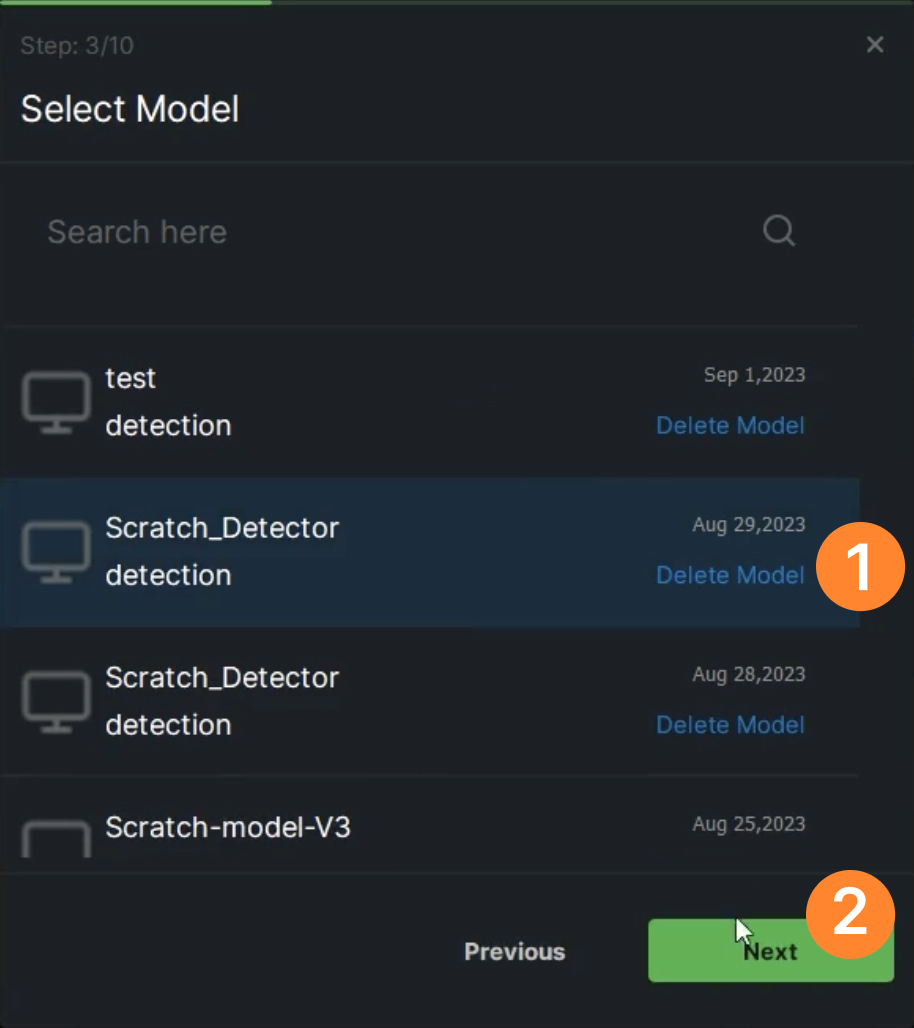
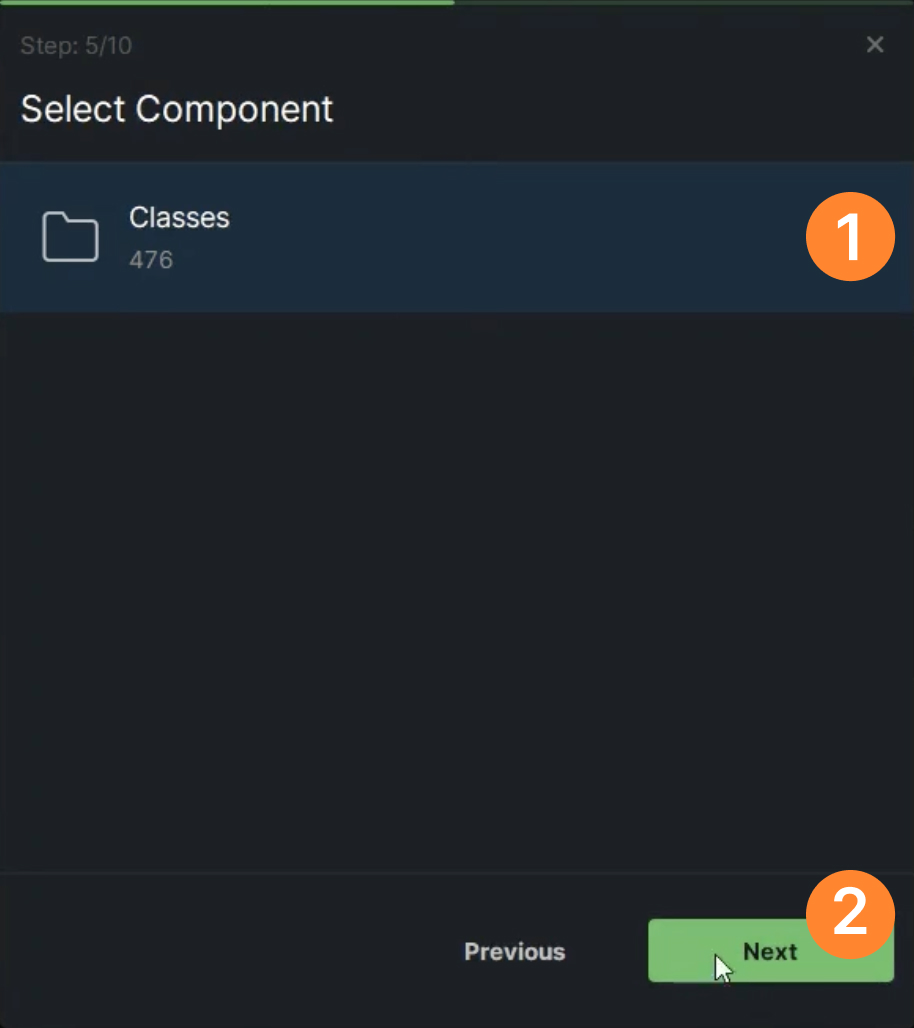
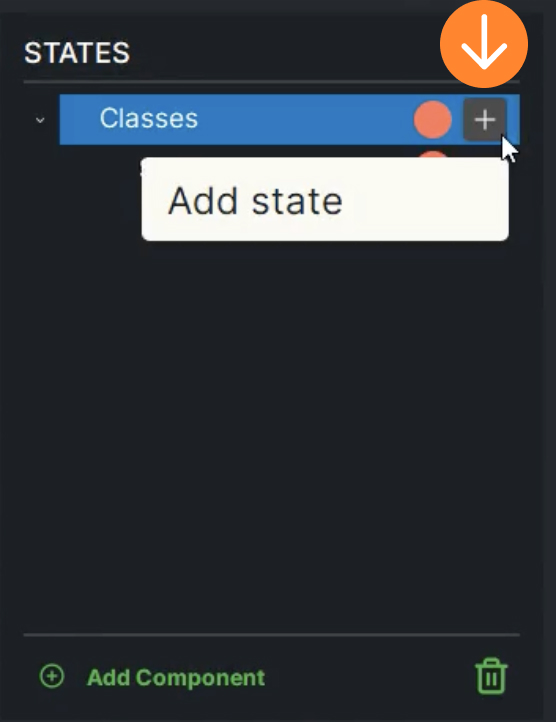
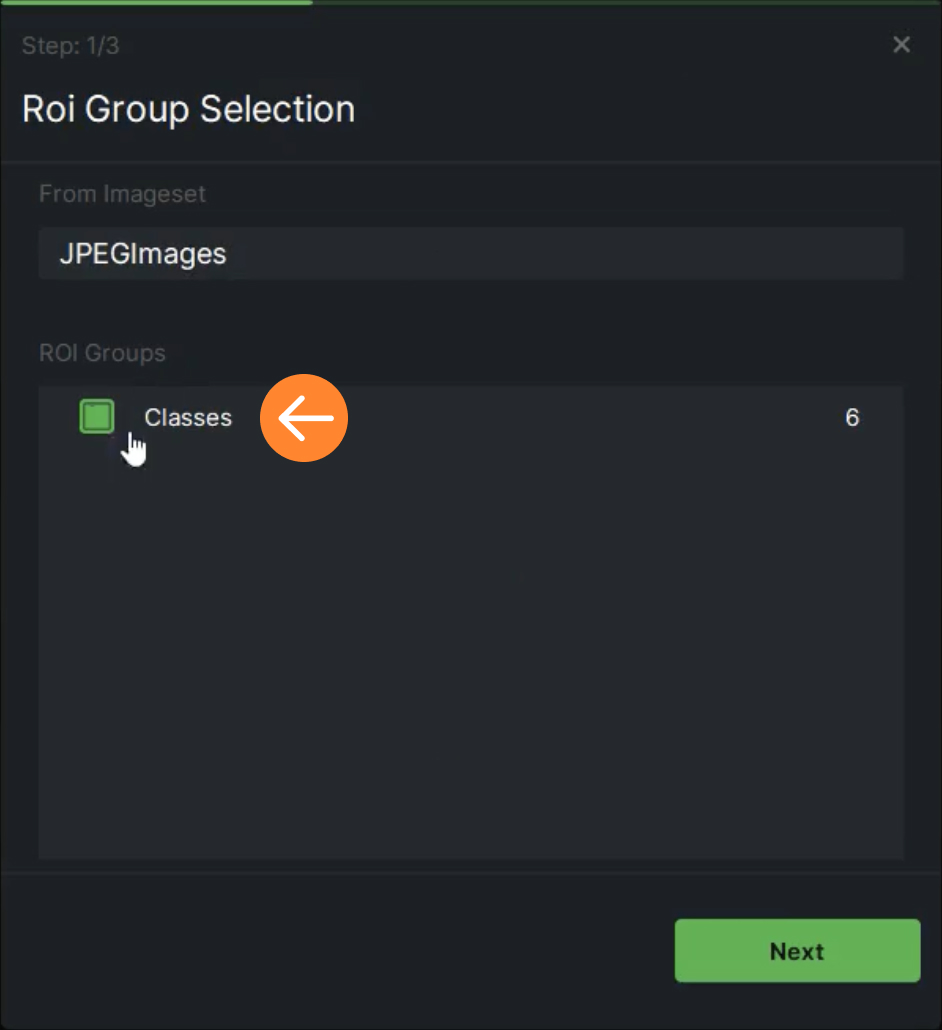
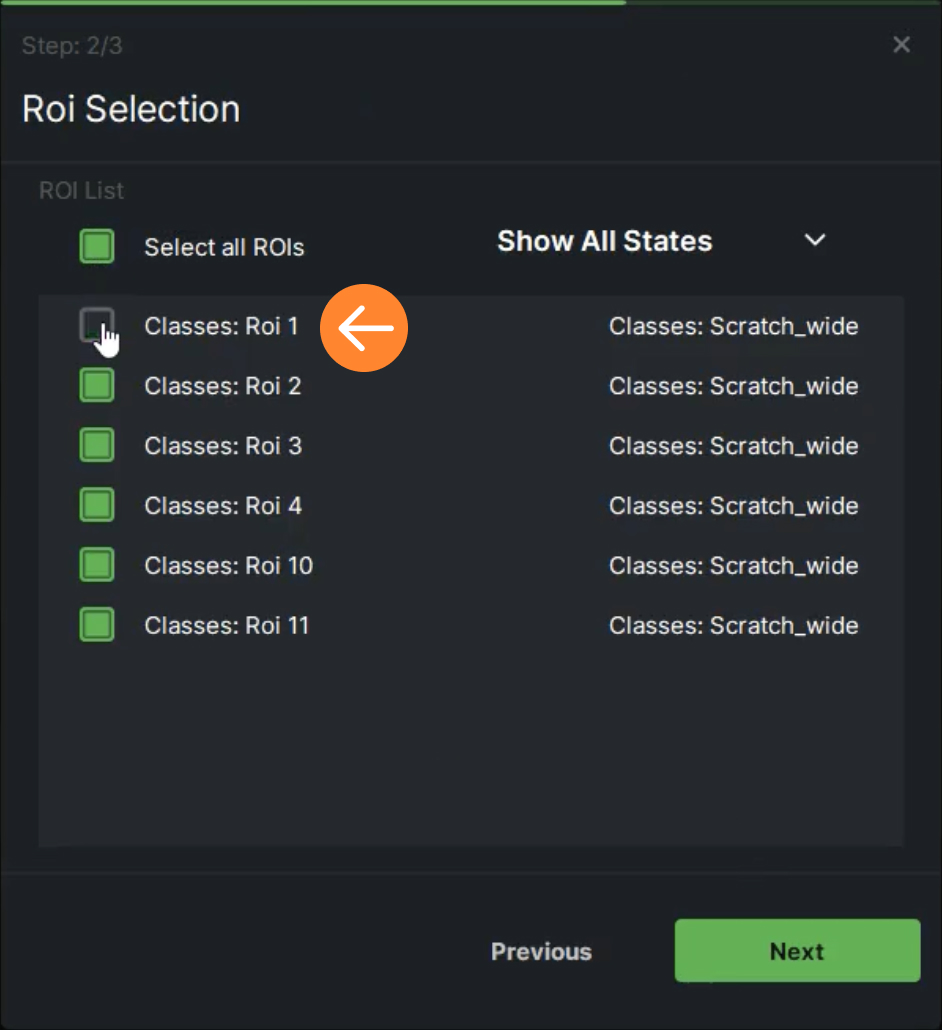
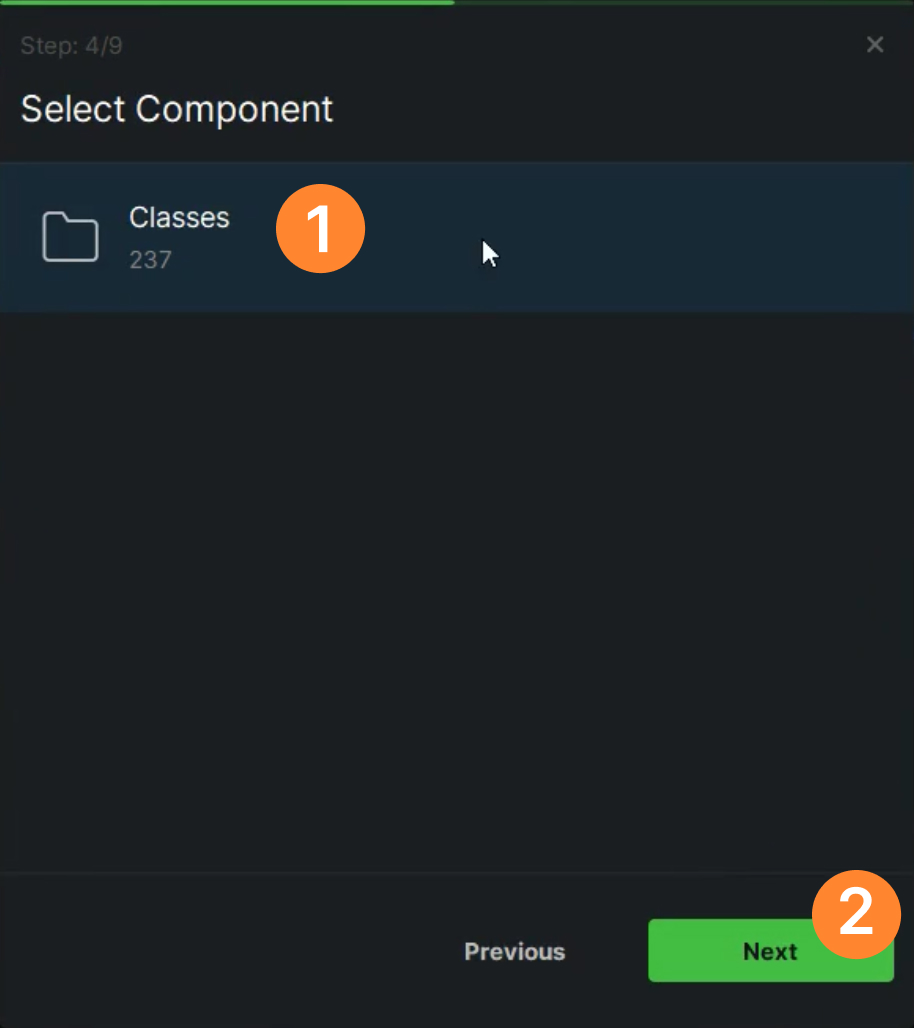
  • From the available “ROI Groups”, the user can make the selections. When the component name “Classes” is chosen, simply click on “Next” to proceed
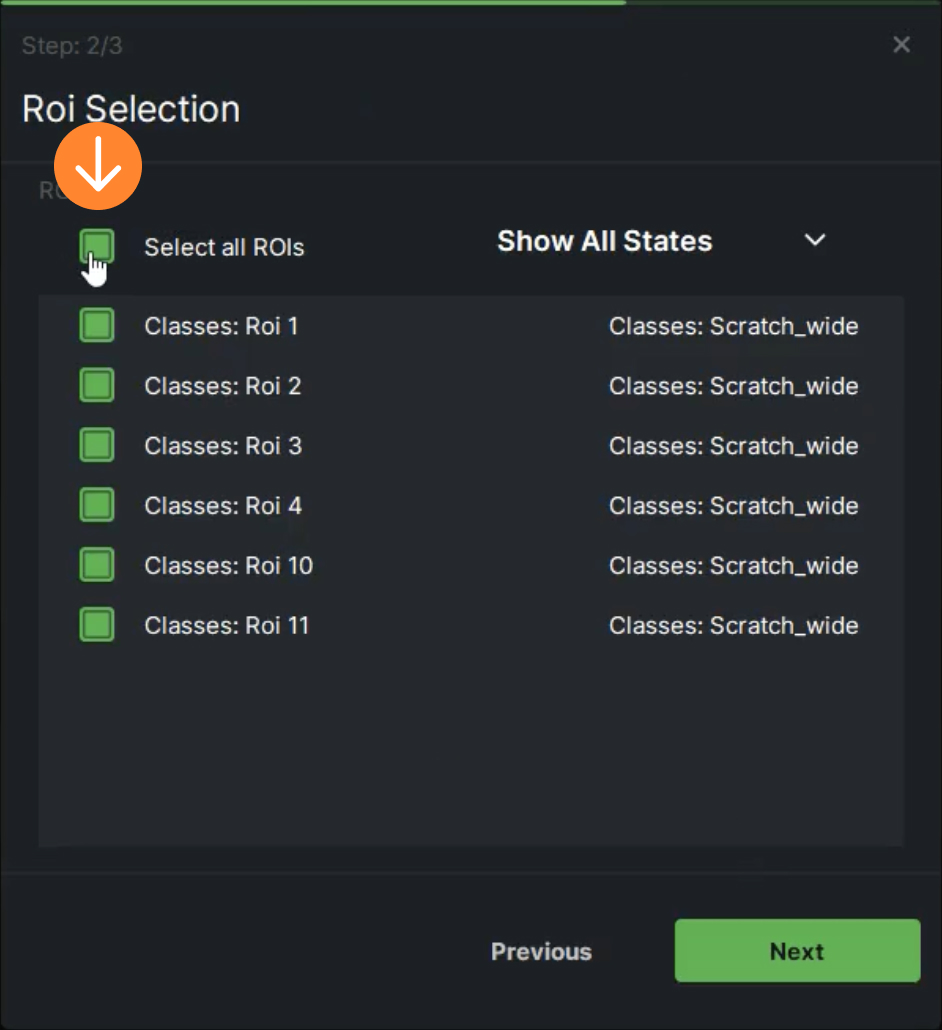
  • When the “Select all ROIs” checkbox is marked, it allows the user to choose all ROIs collectively. Alternatively, specific ROIs can be individually selected or deselected from the list
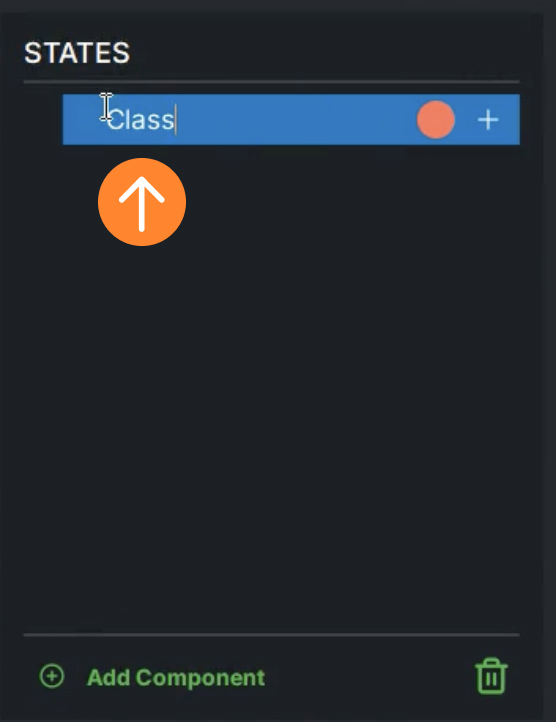
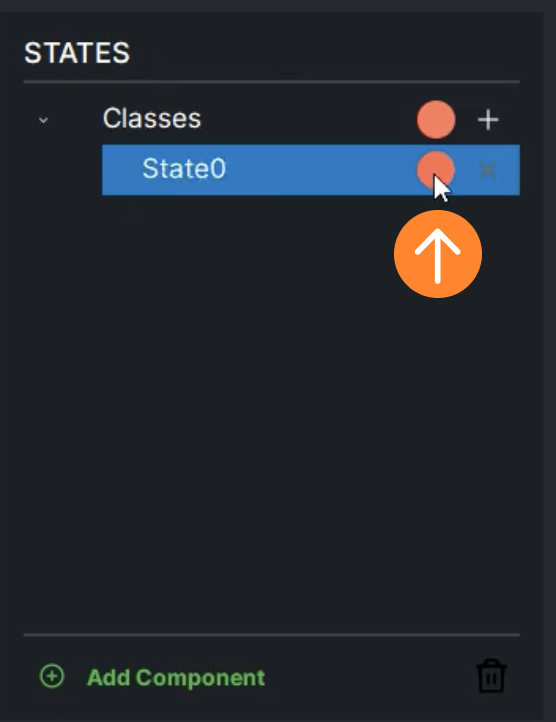
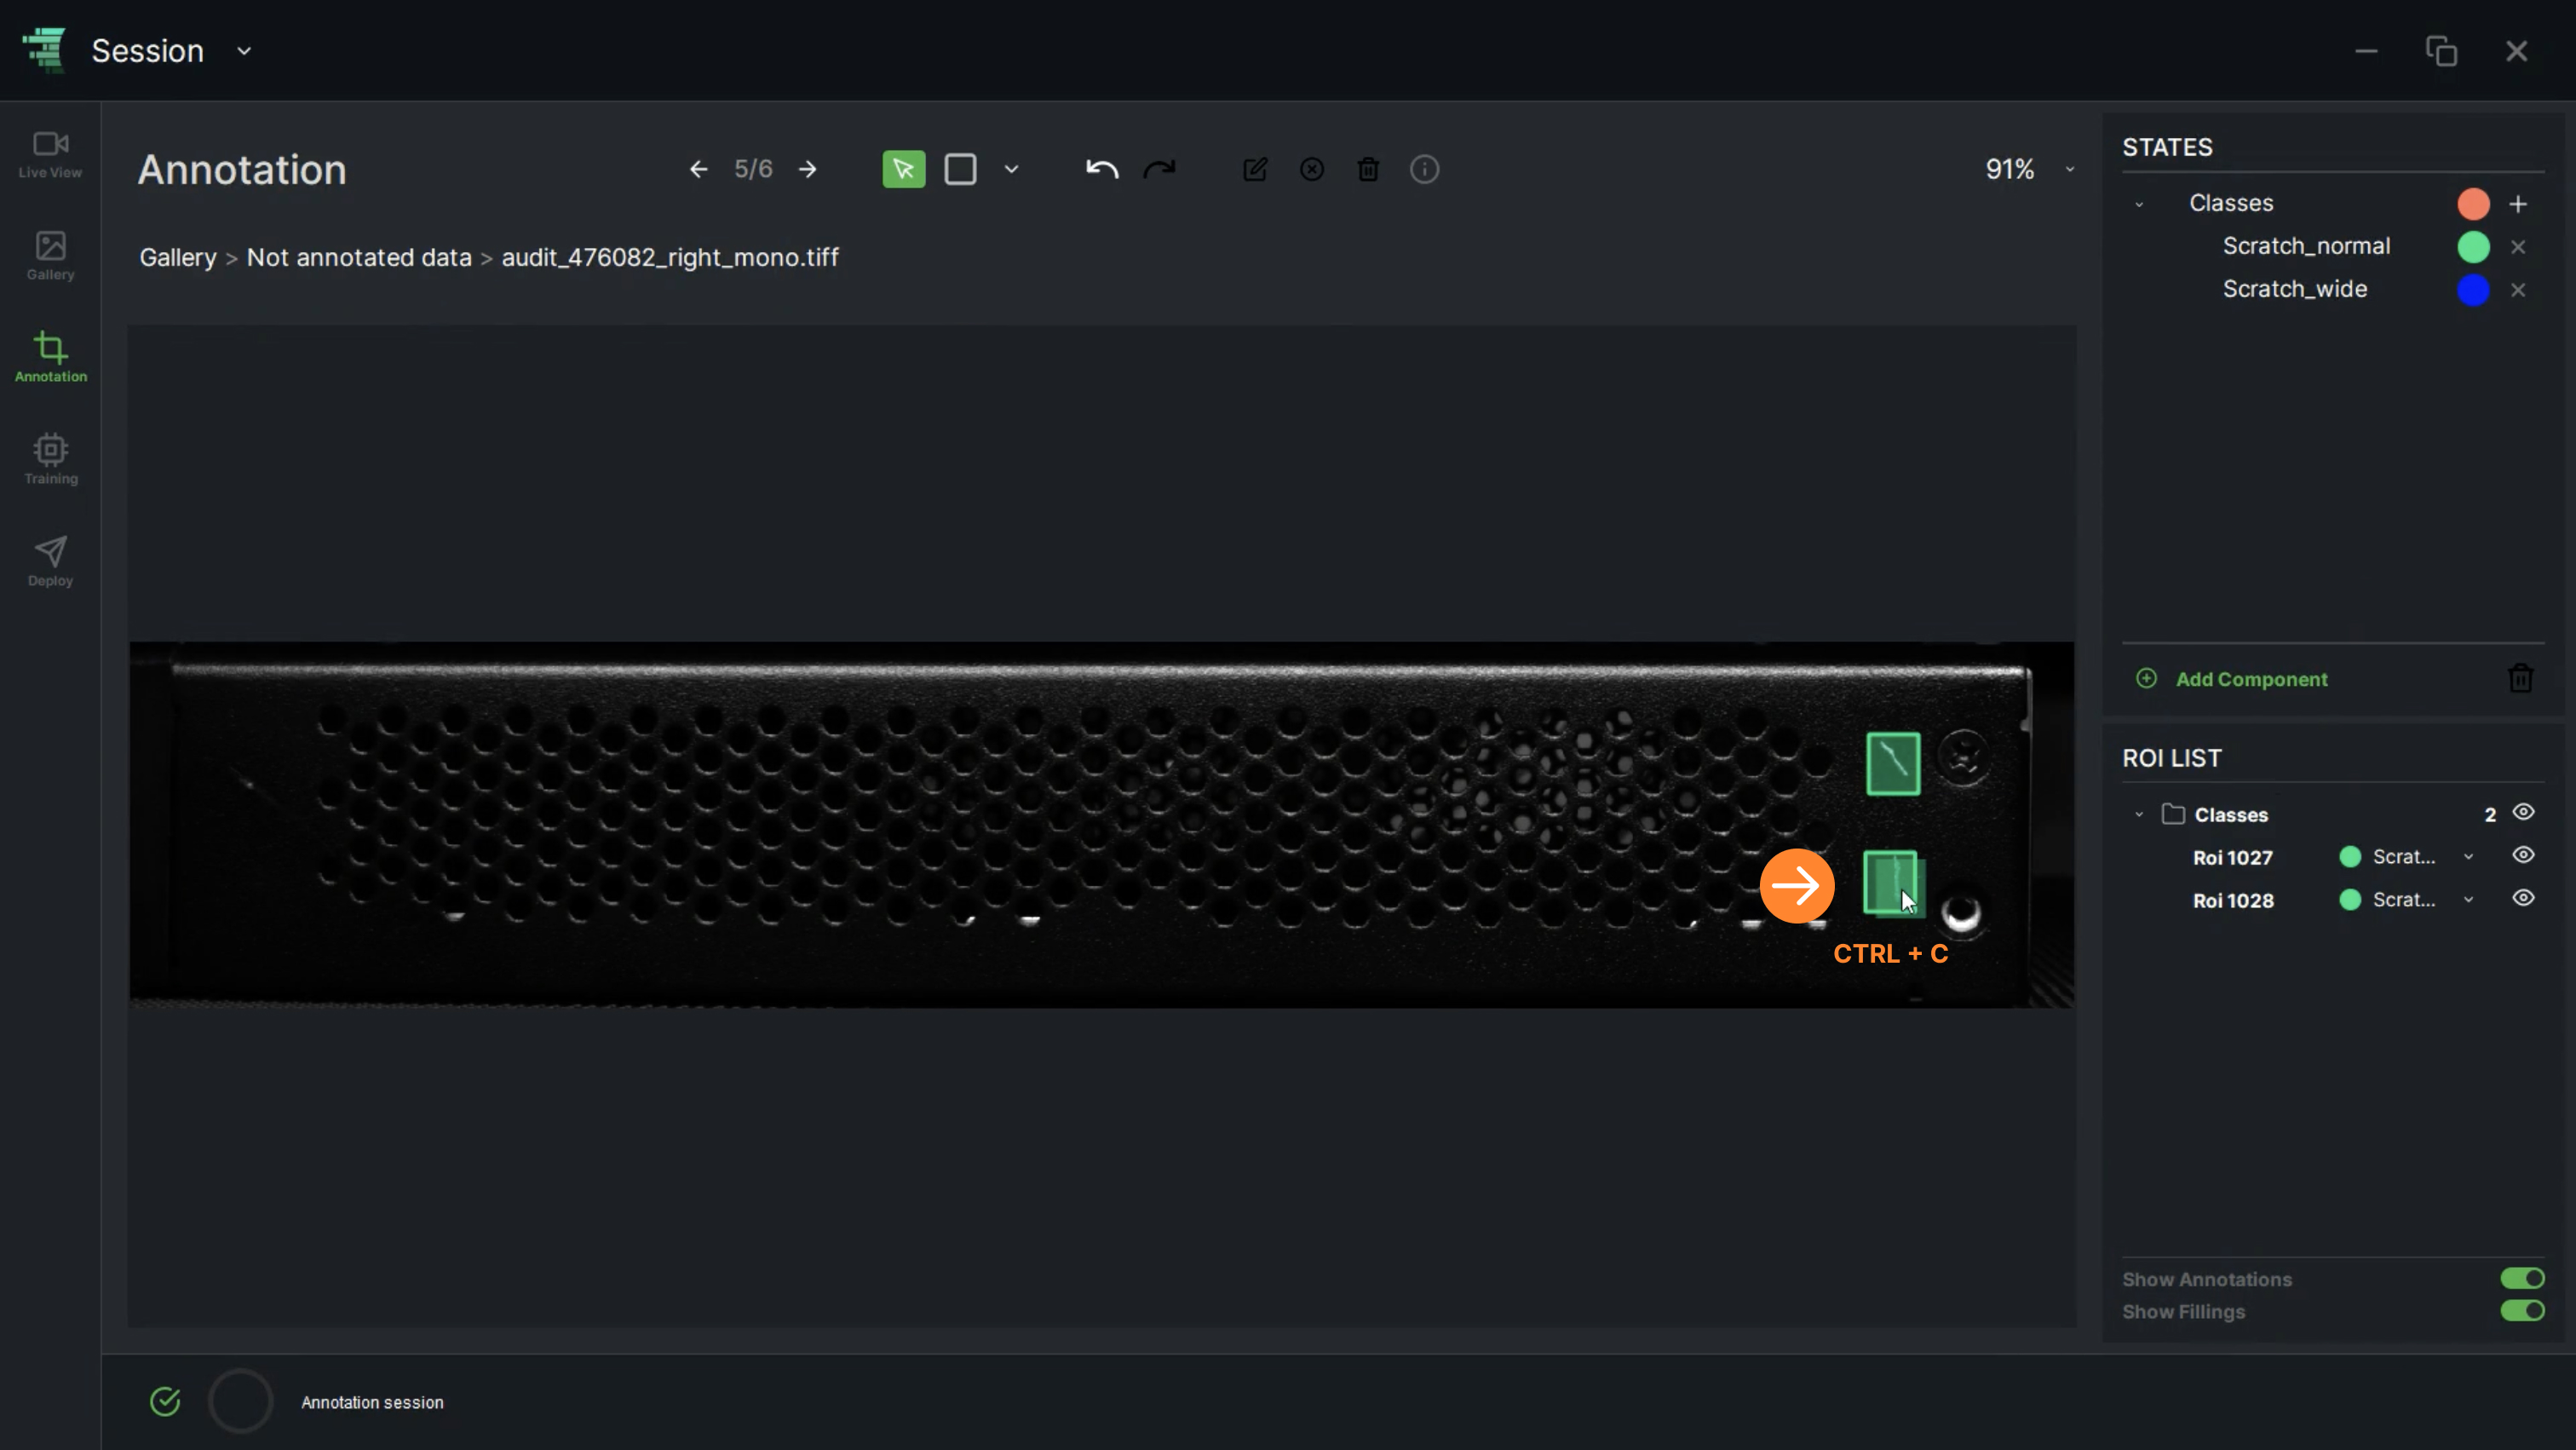
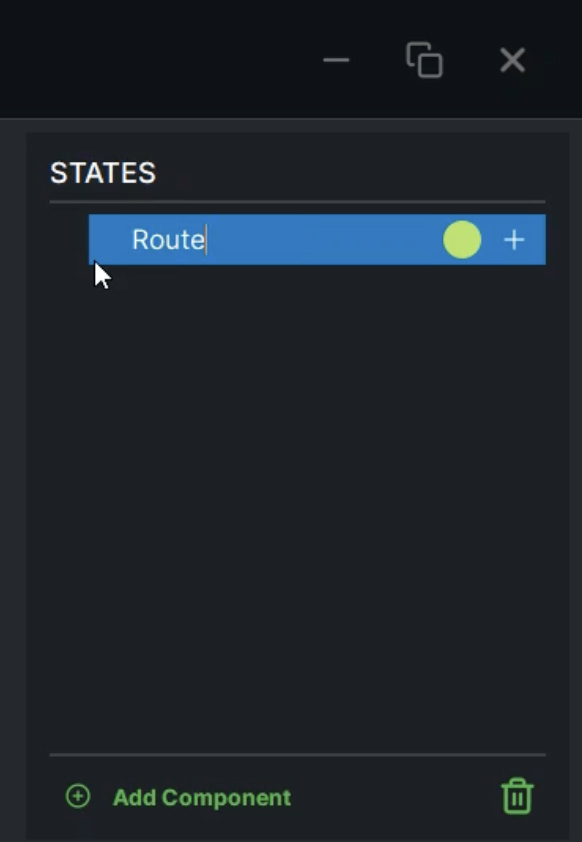
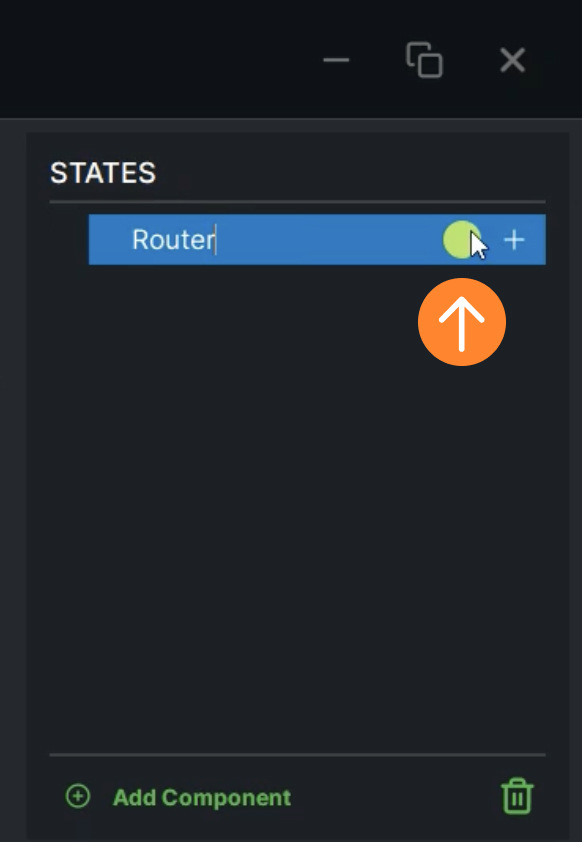
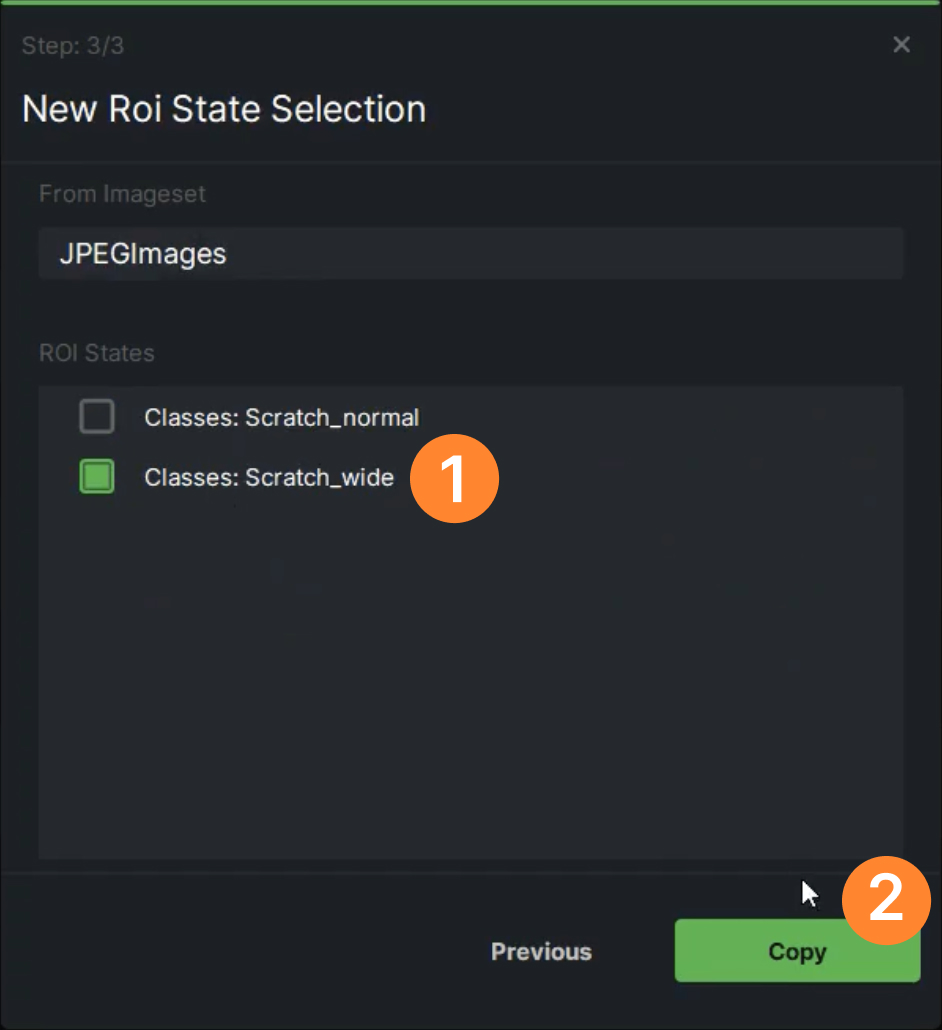
  • The user should first choose one of the defined states to assign a state as a new ROI for the dataset. After selecting a state, click on “Copy” to confirm the assignment

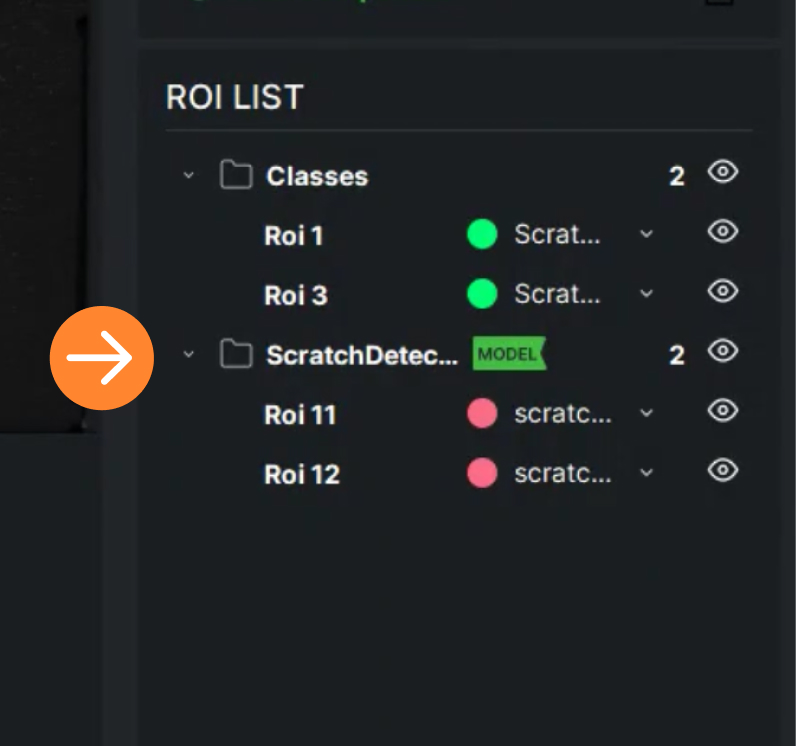
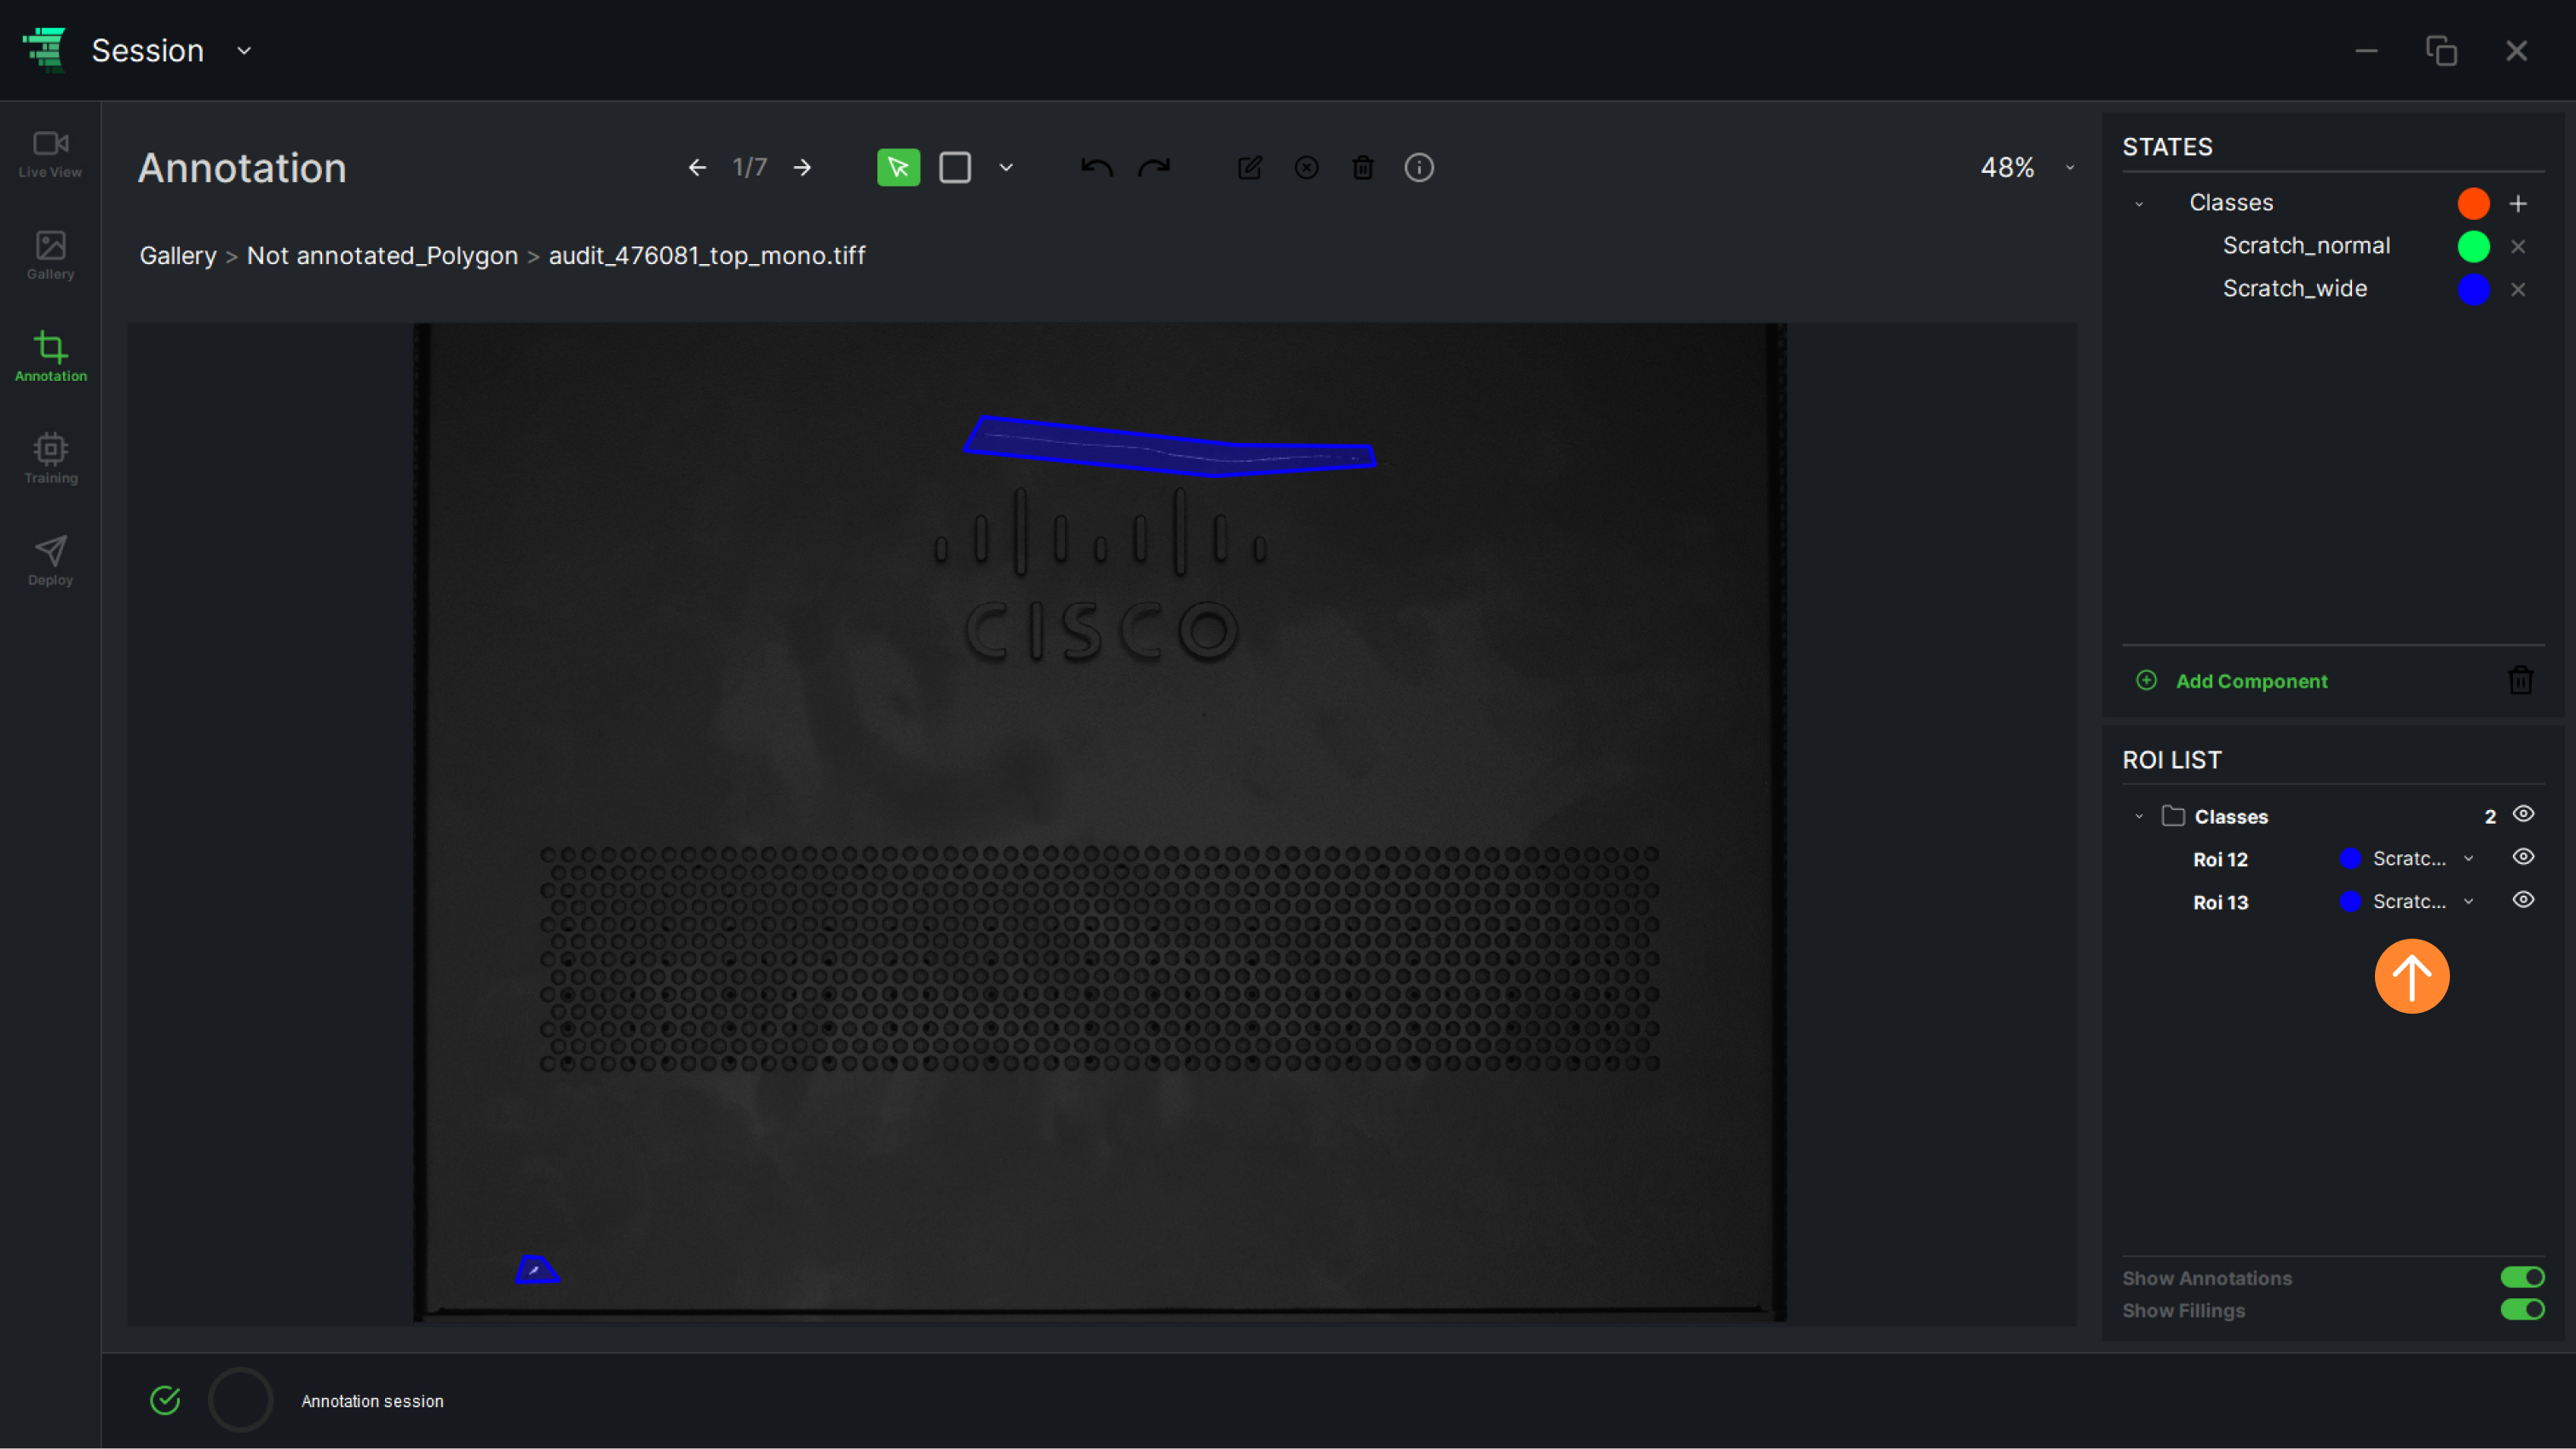
2. The dataset will be updated with the “New state/states”. The user can review them in the ROI LIST

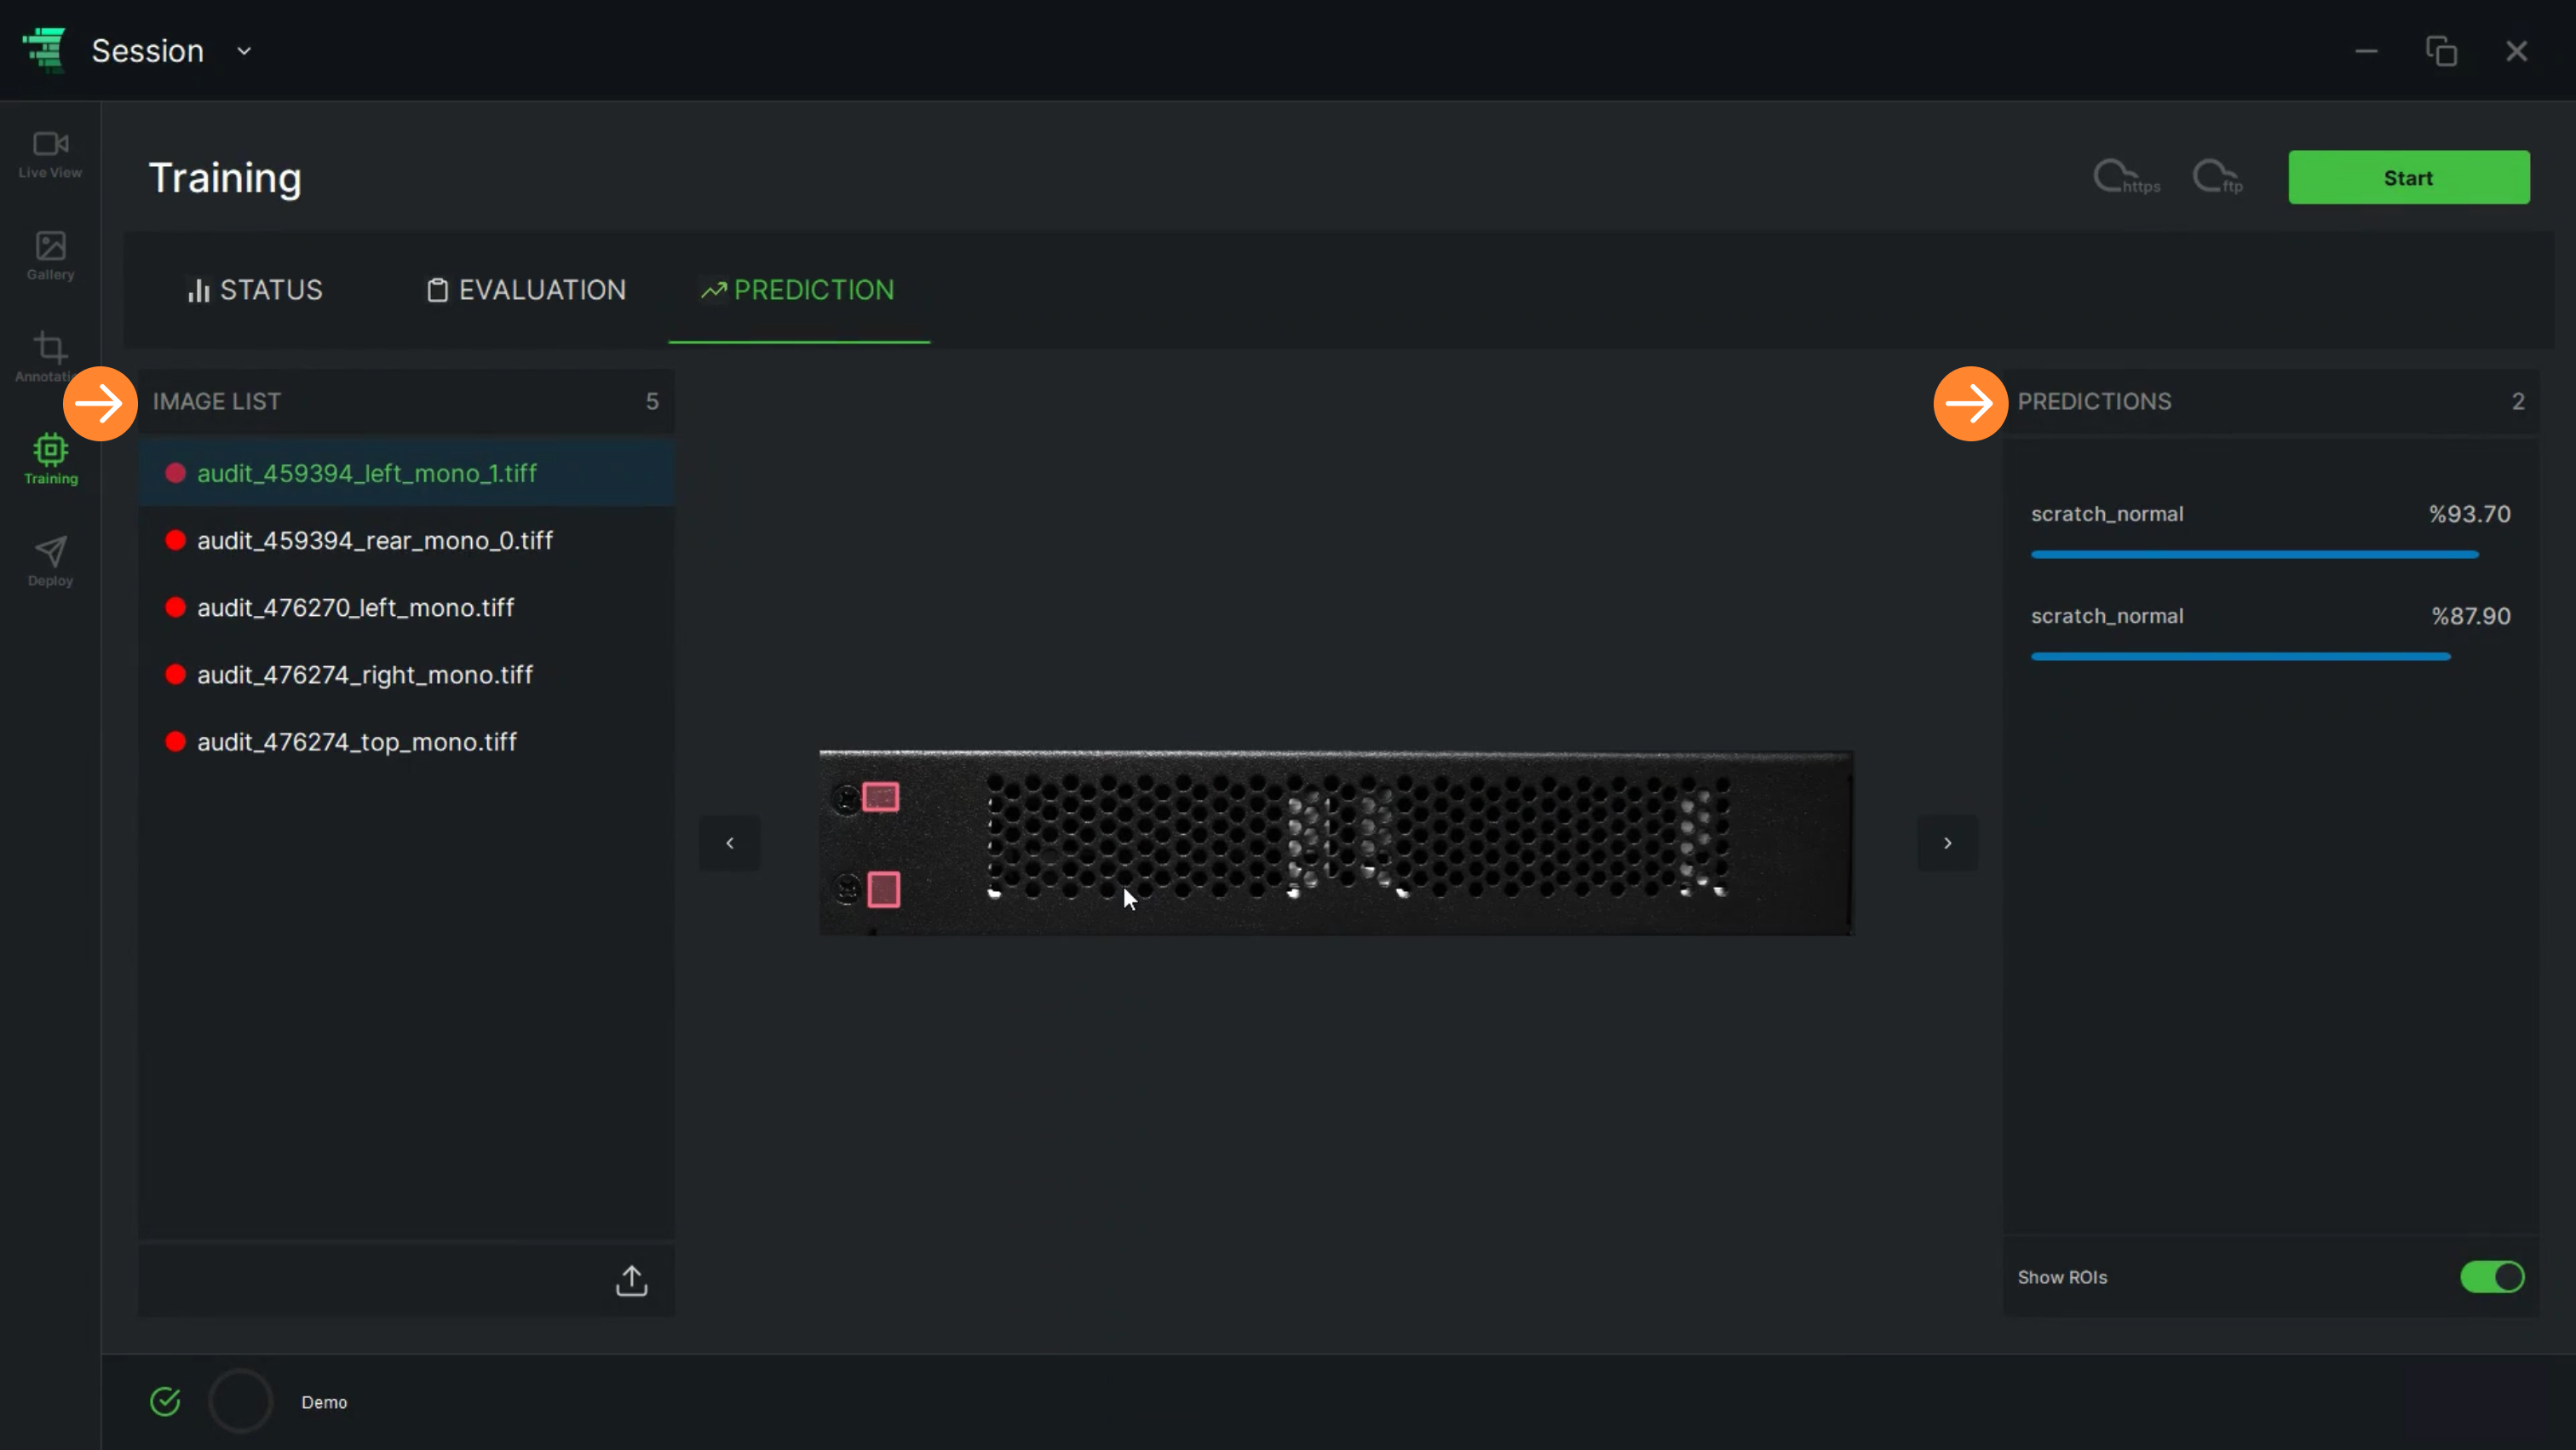
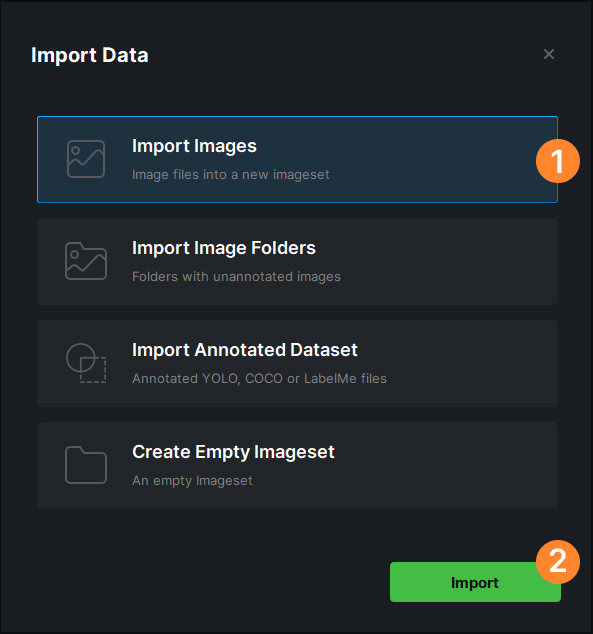
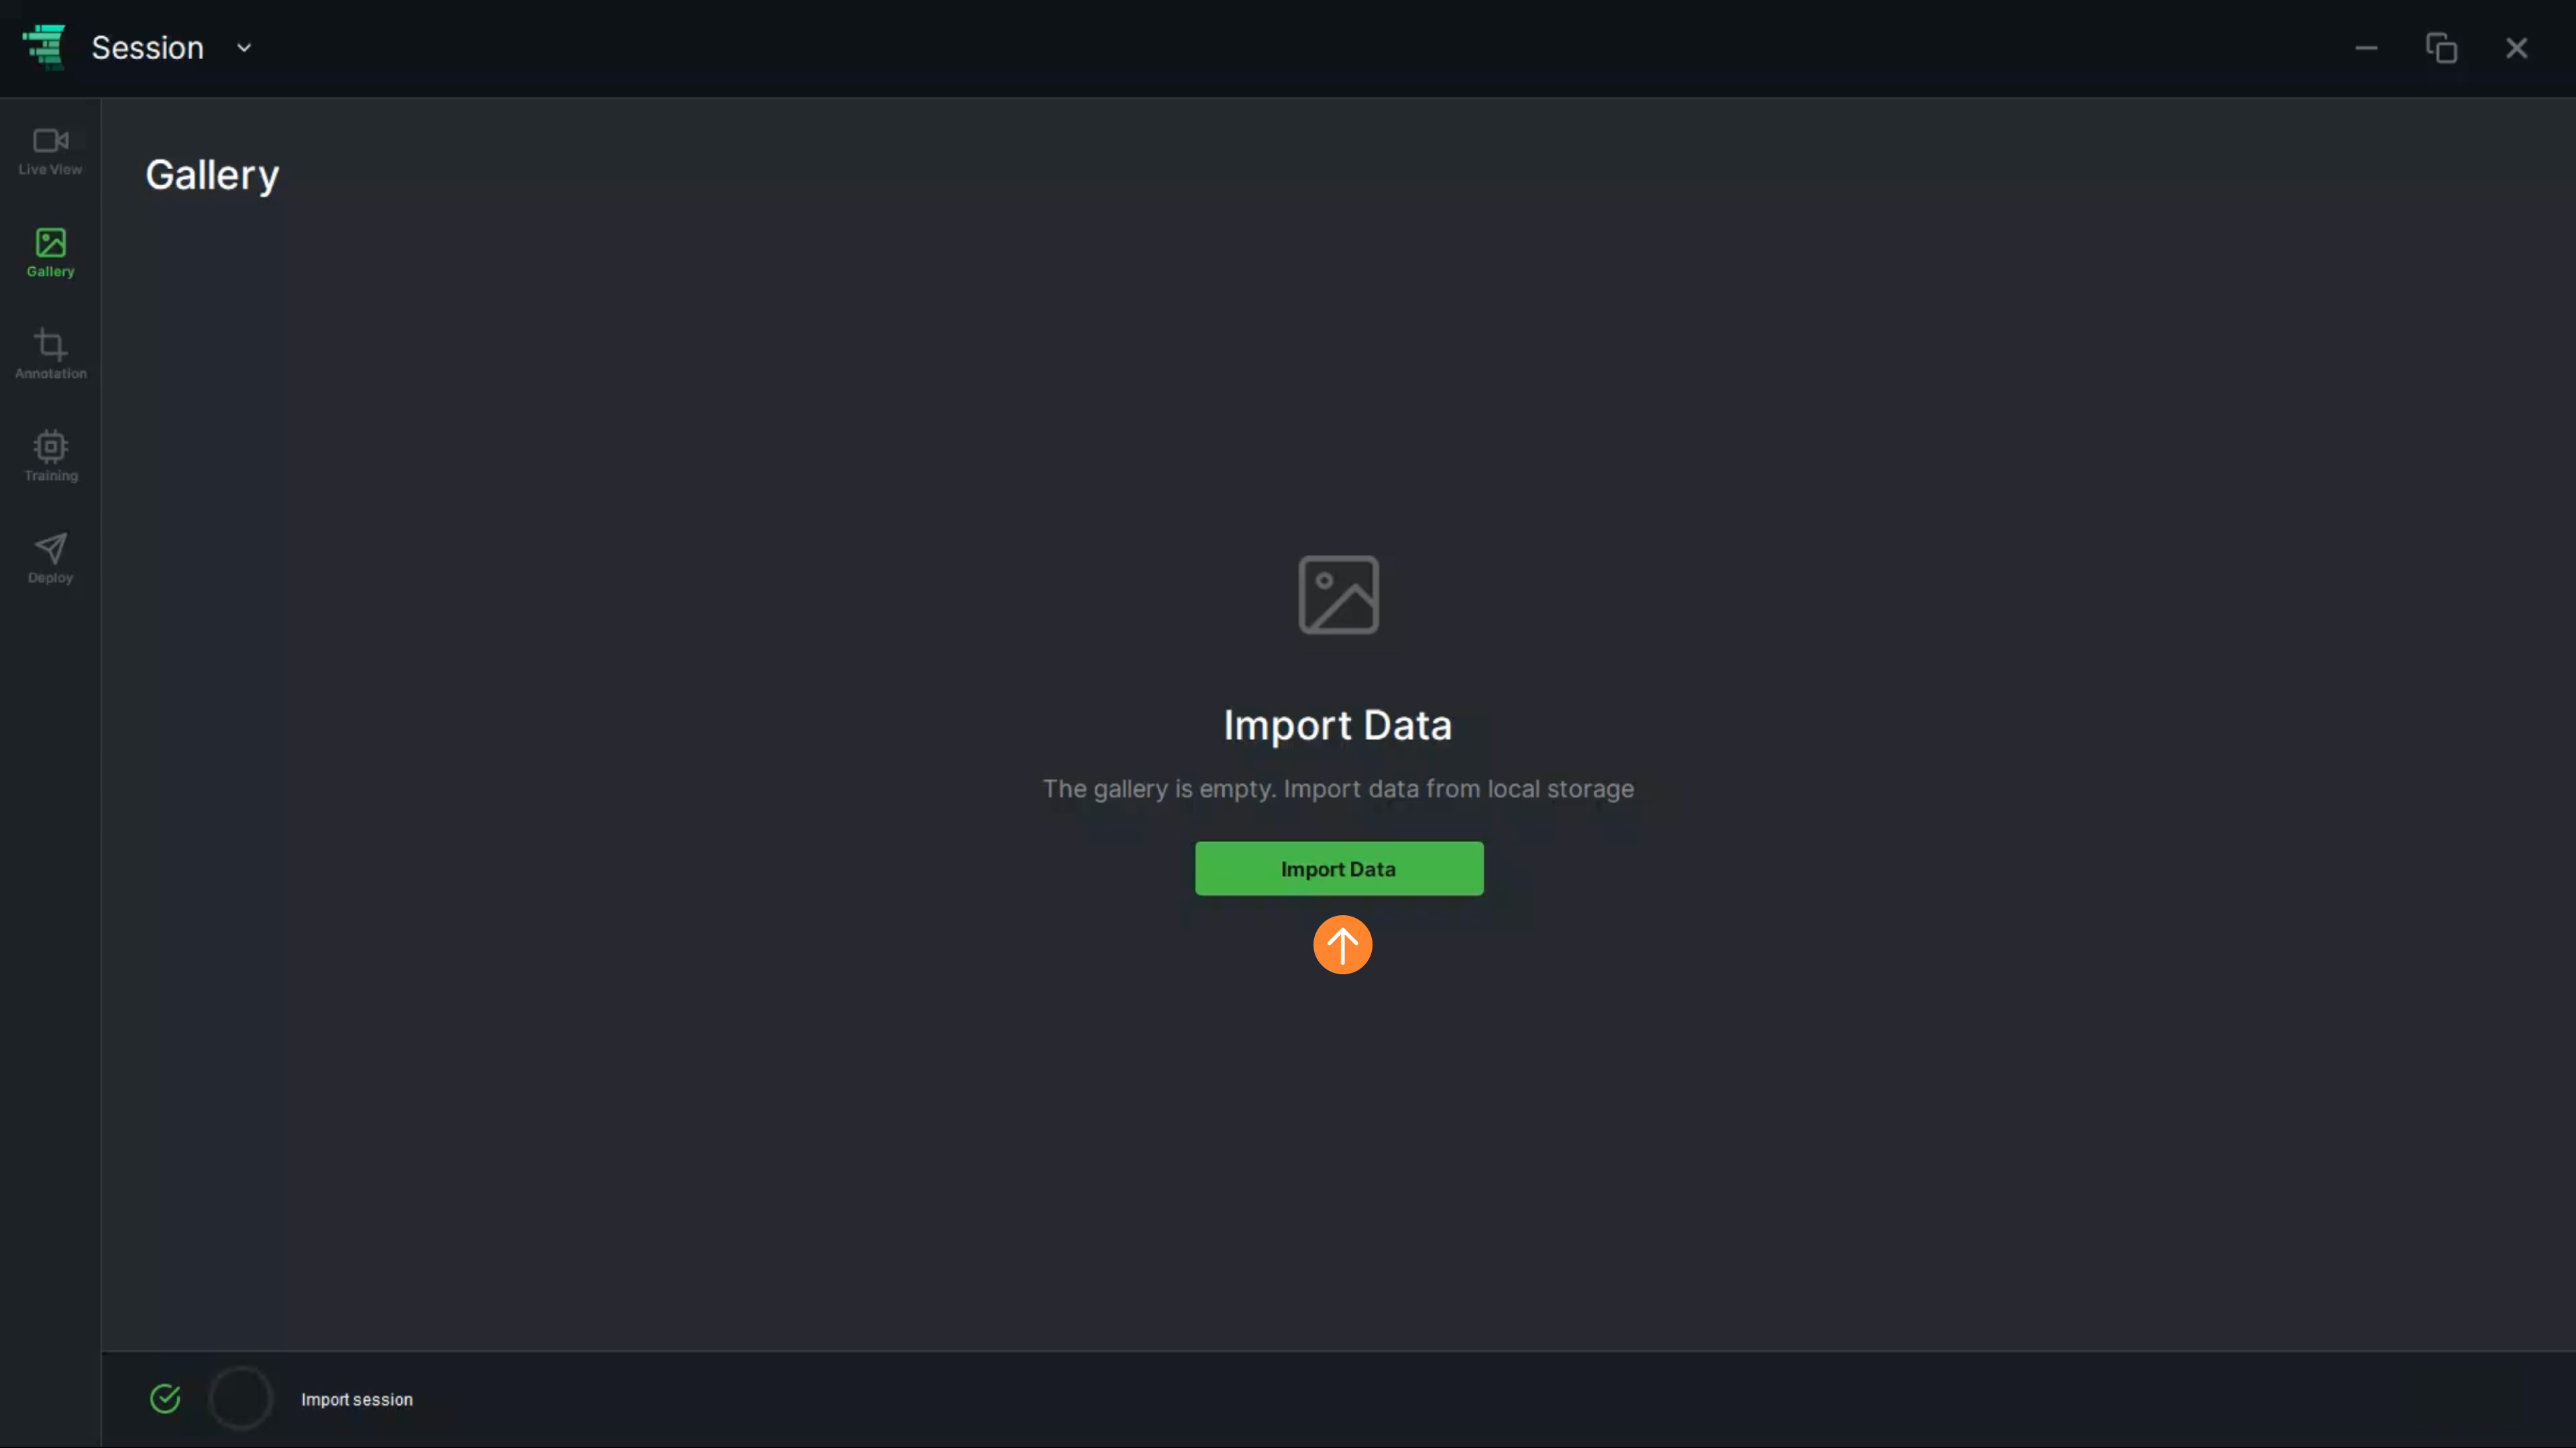
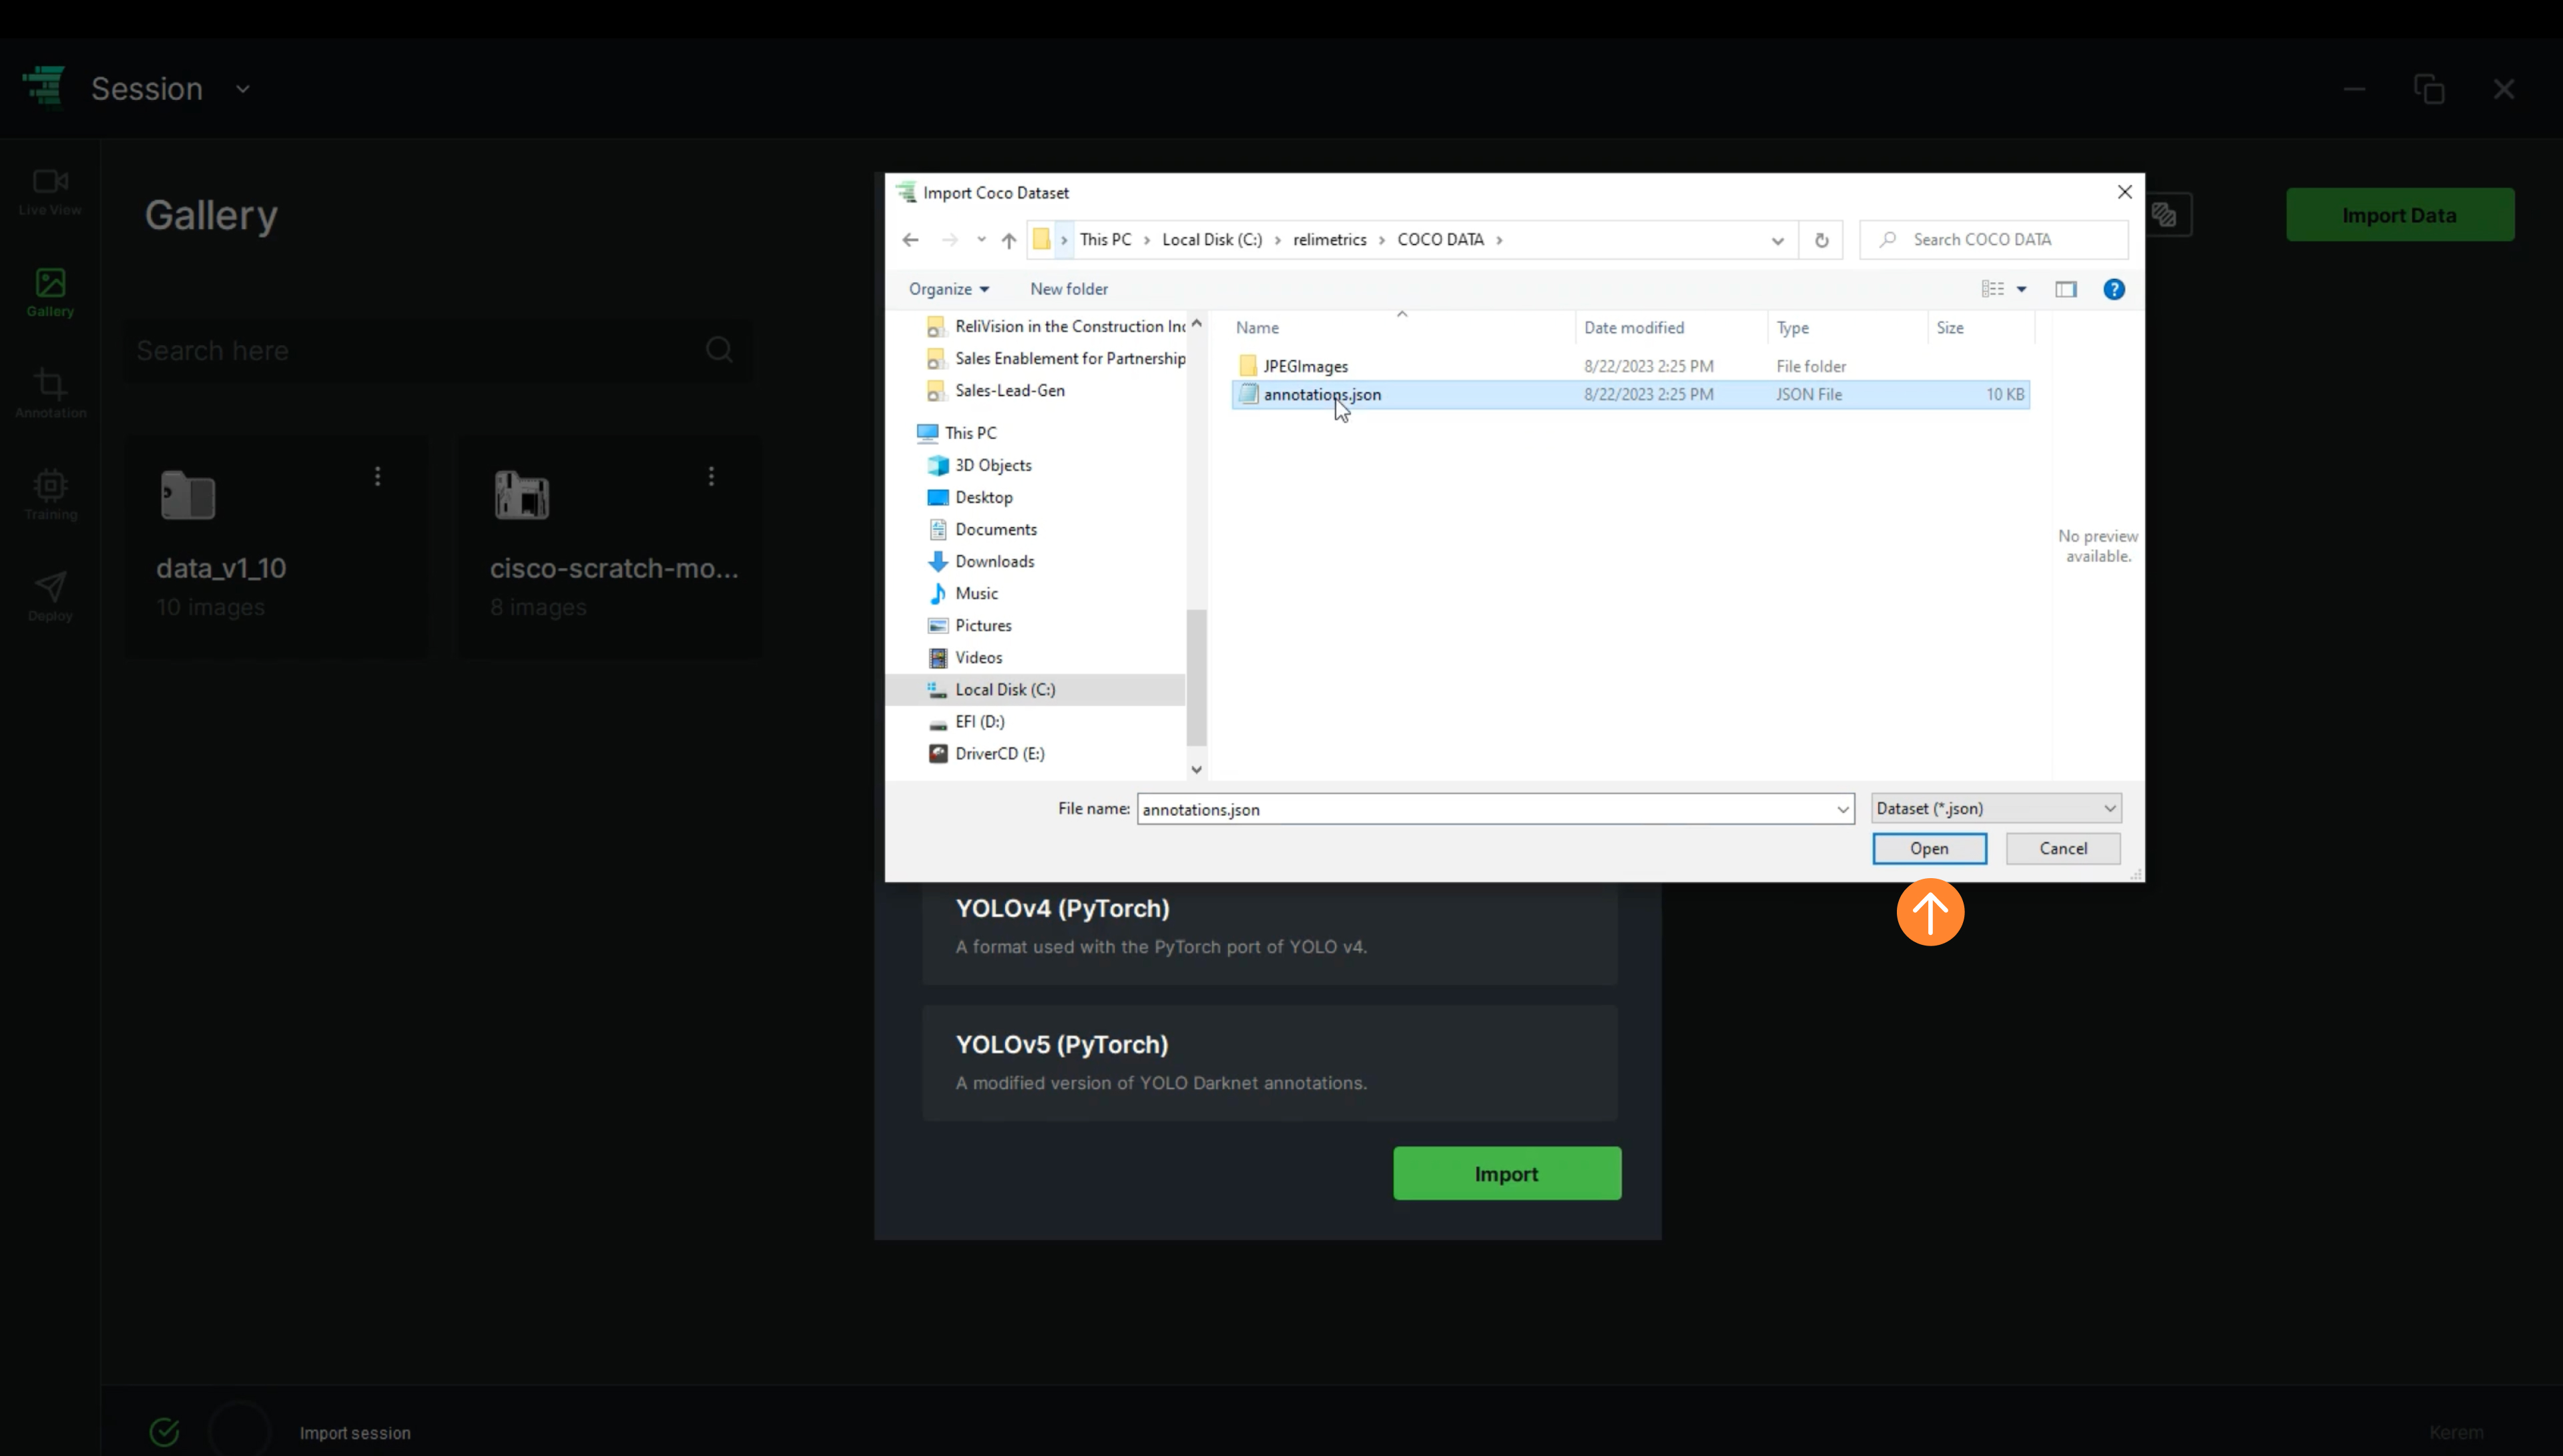
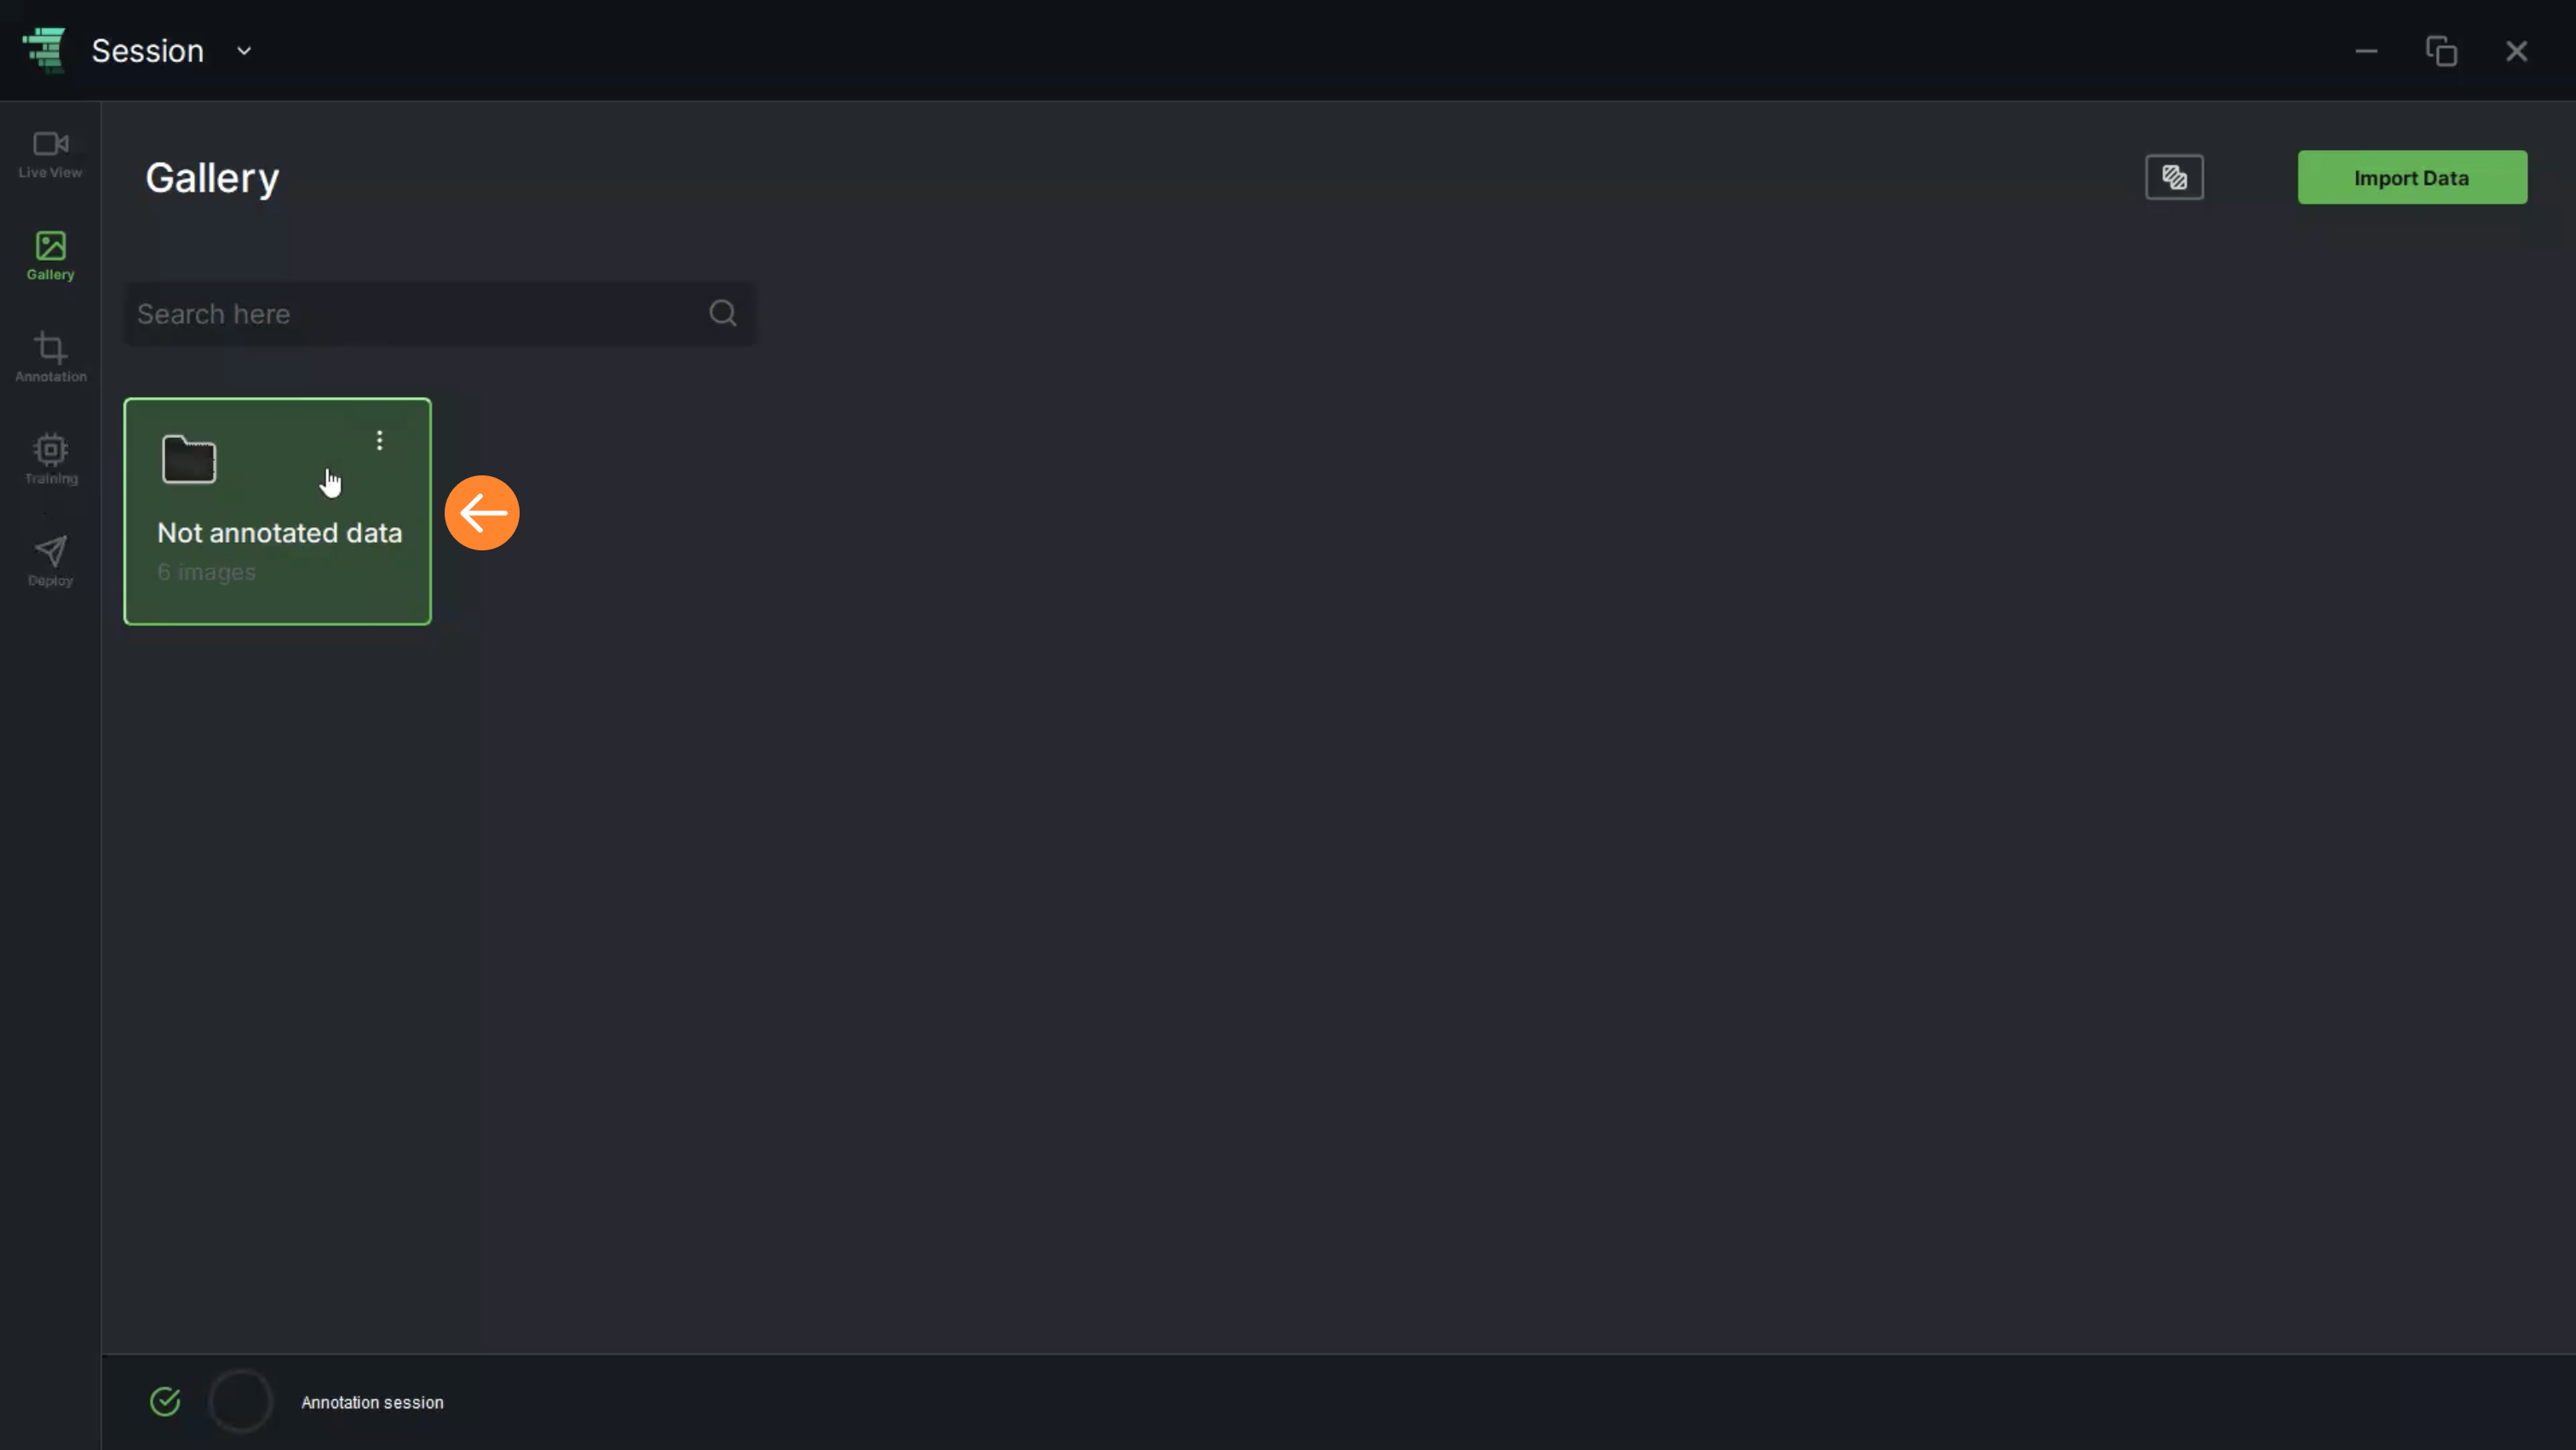
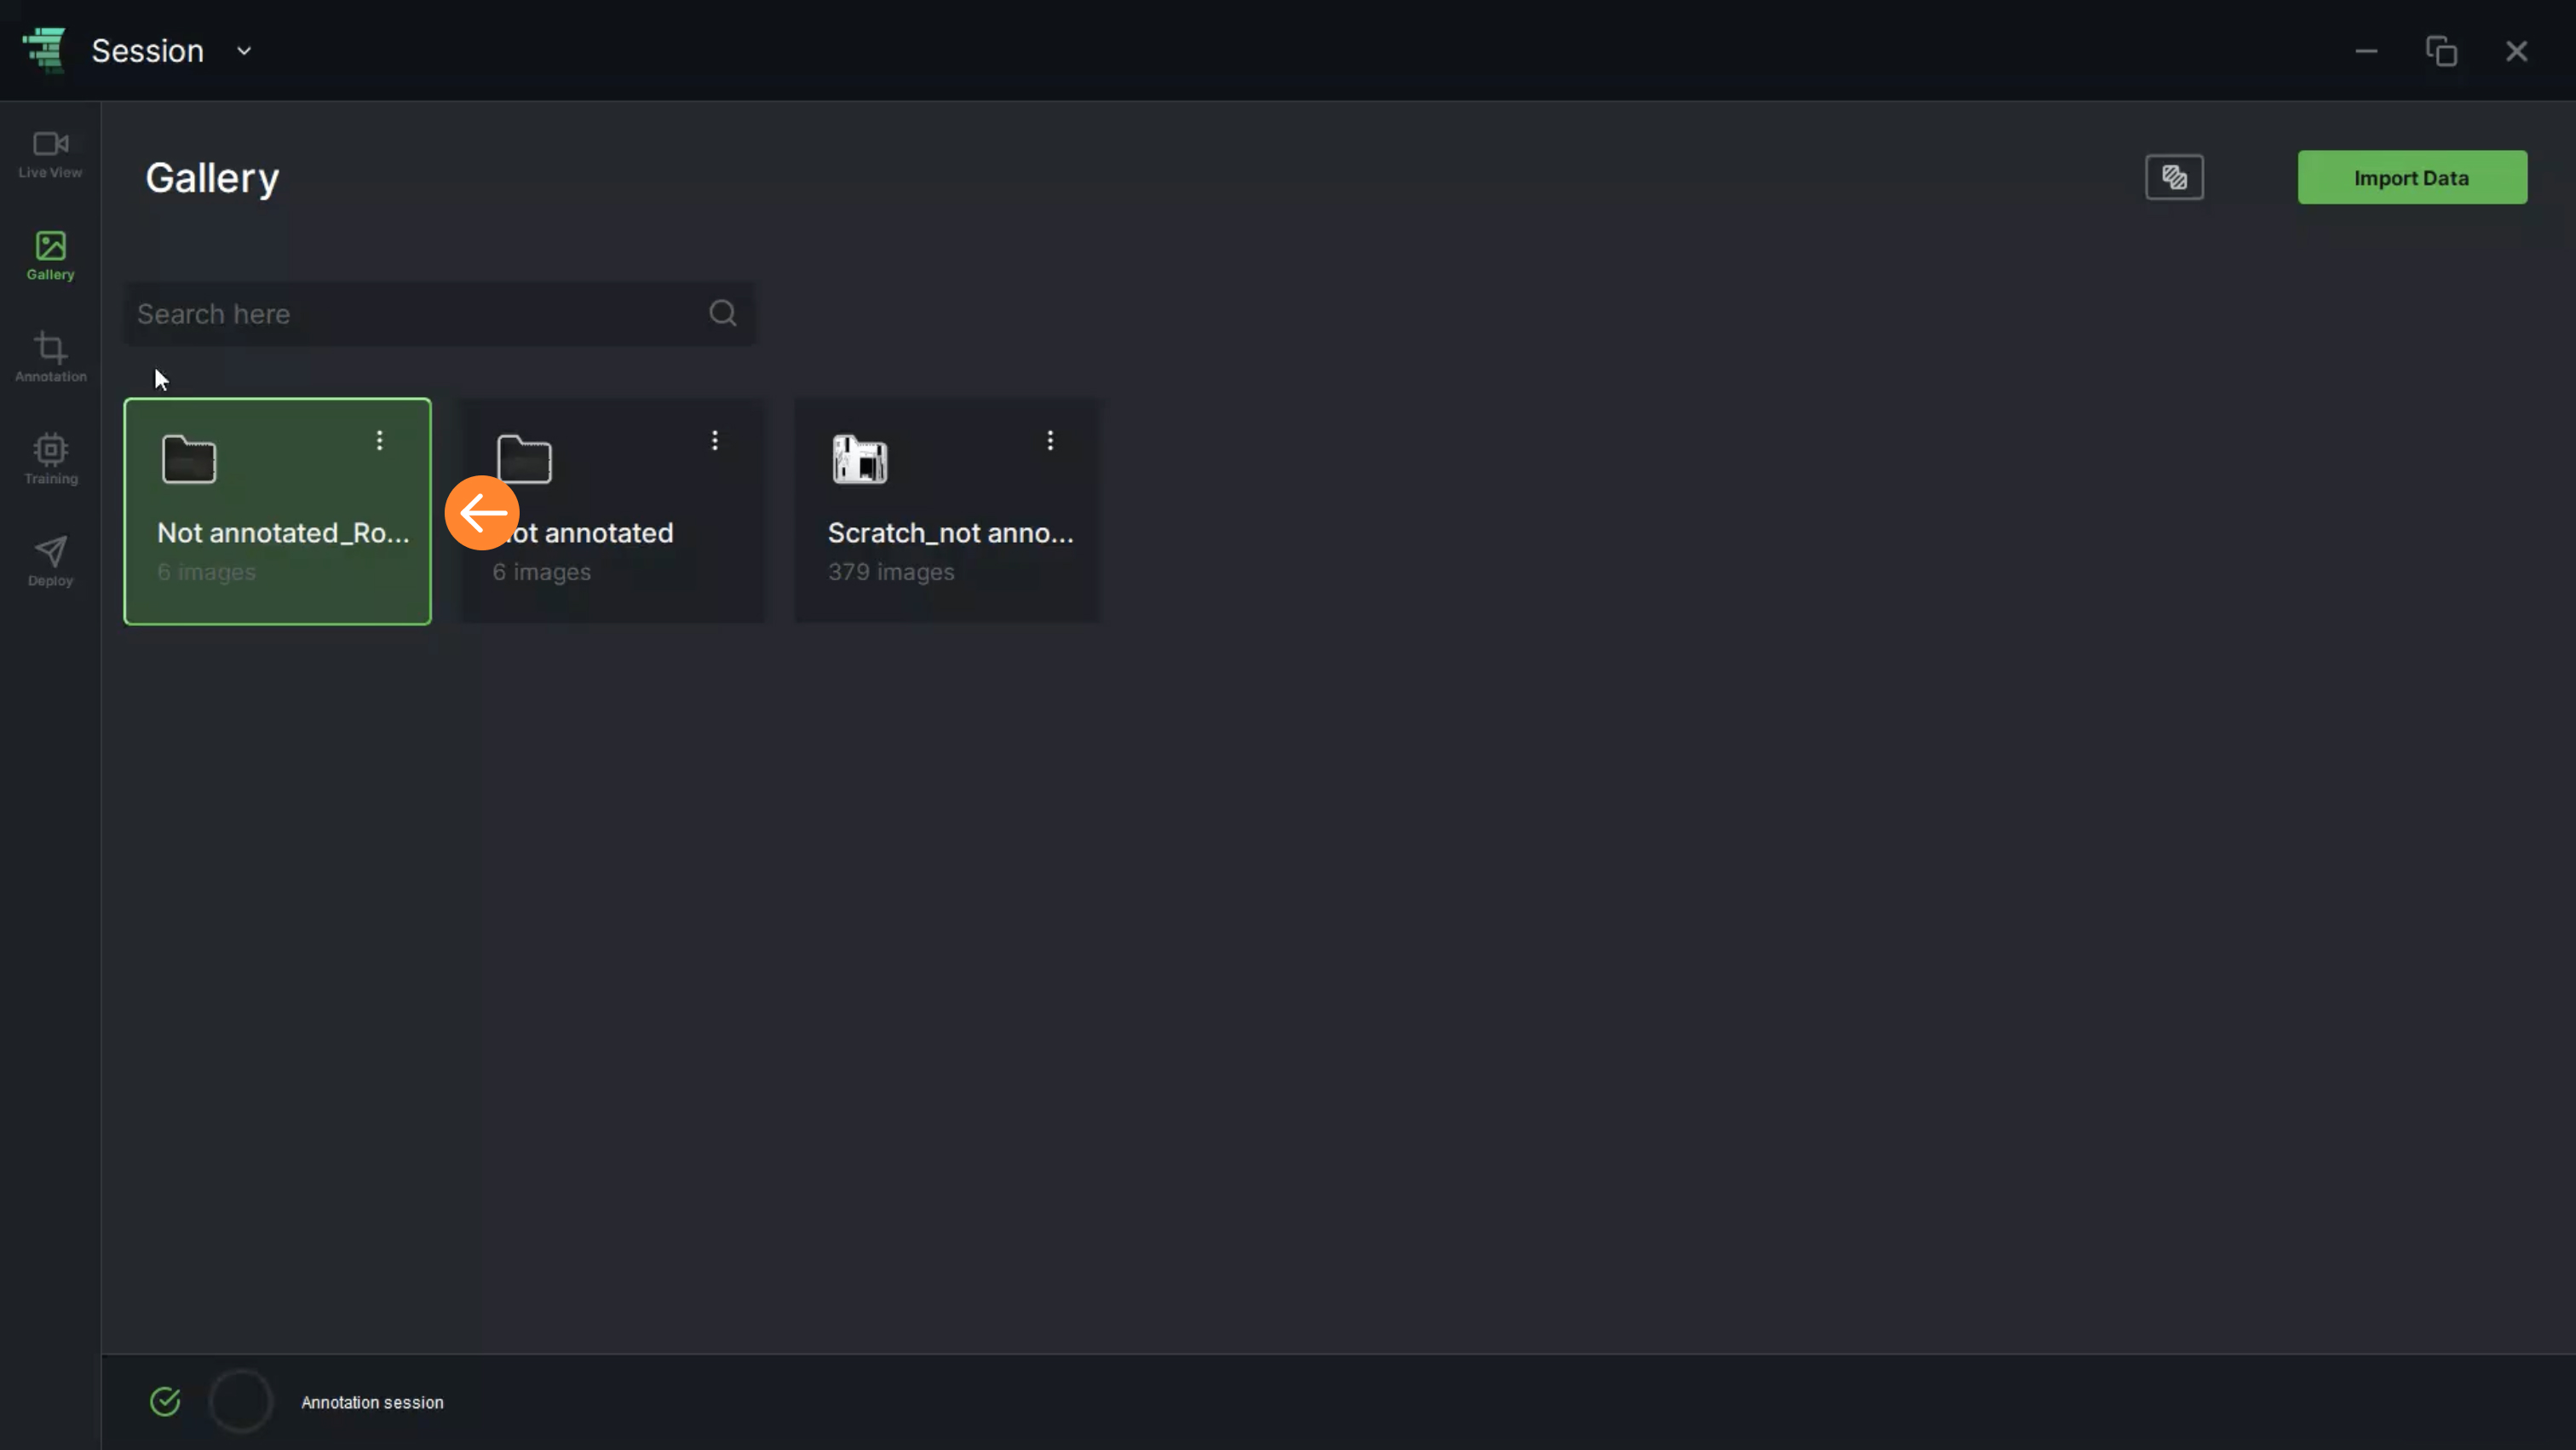
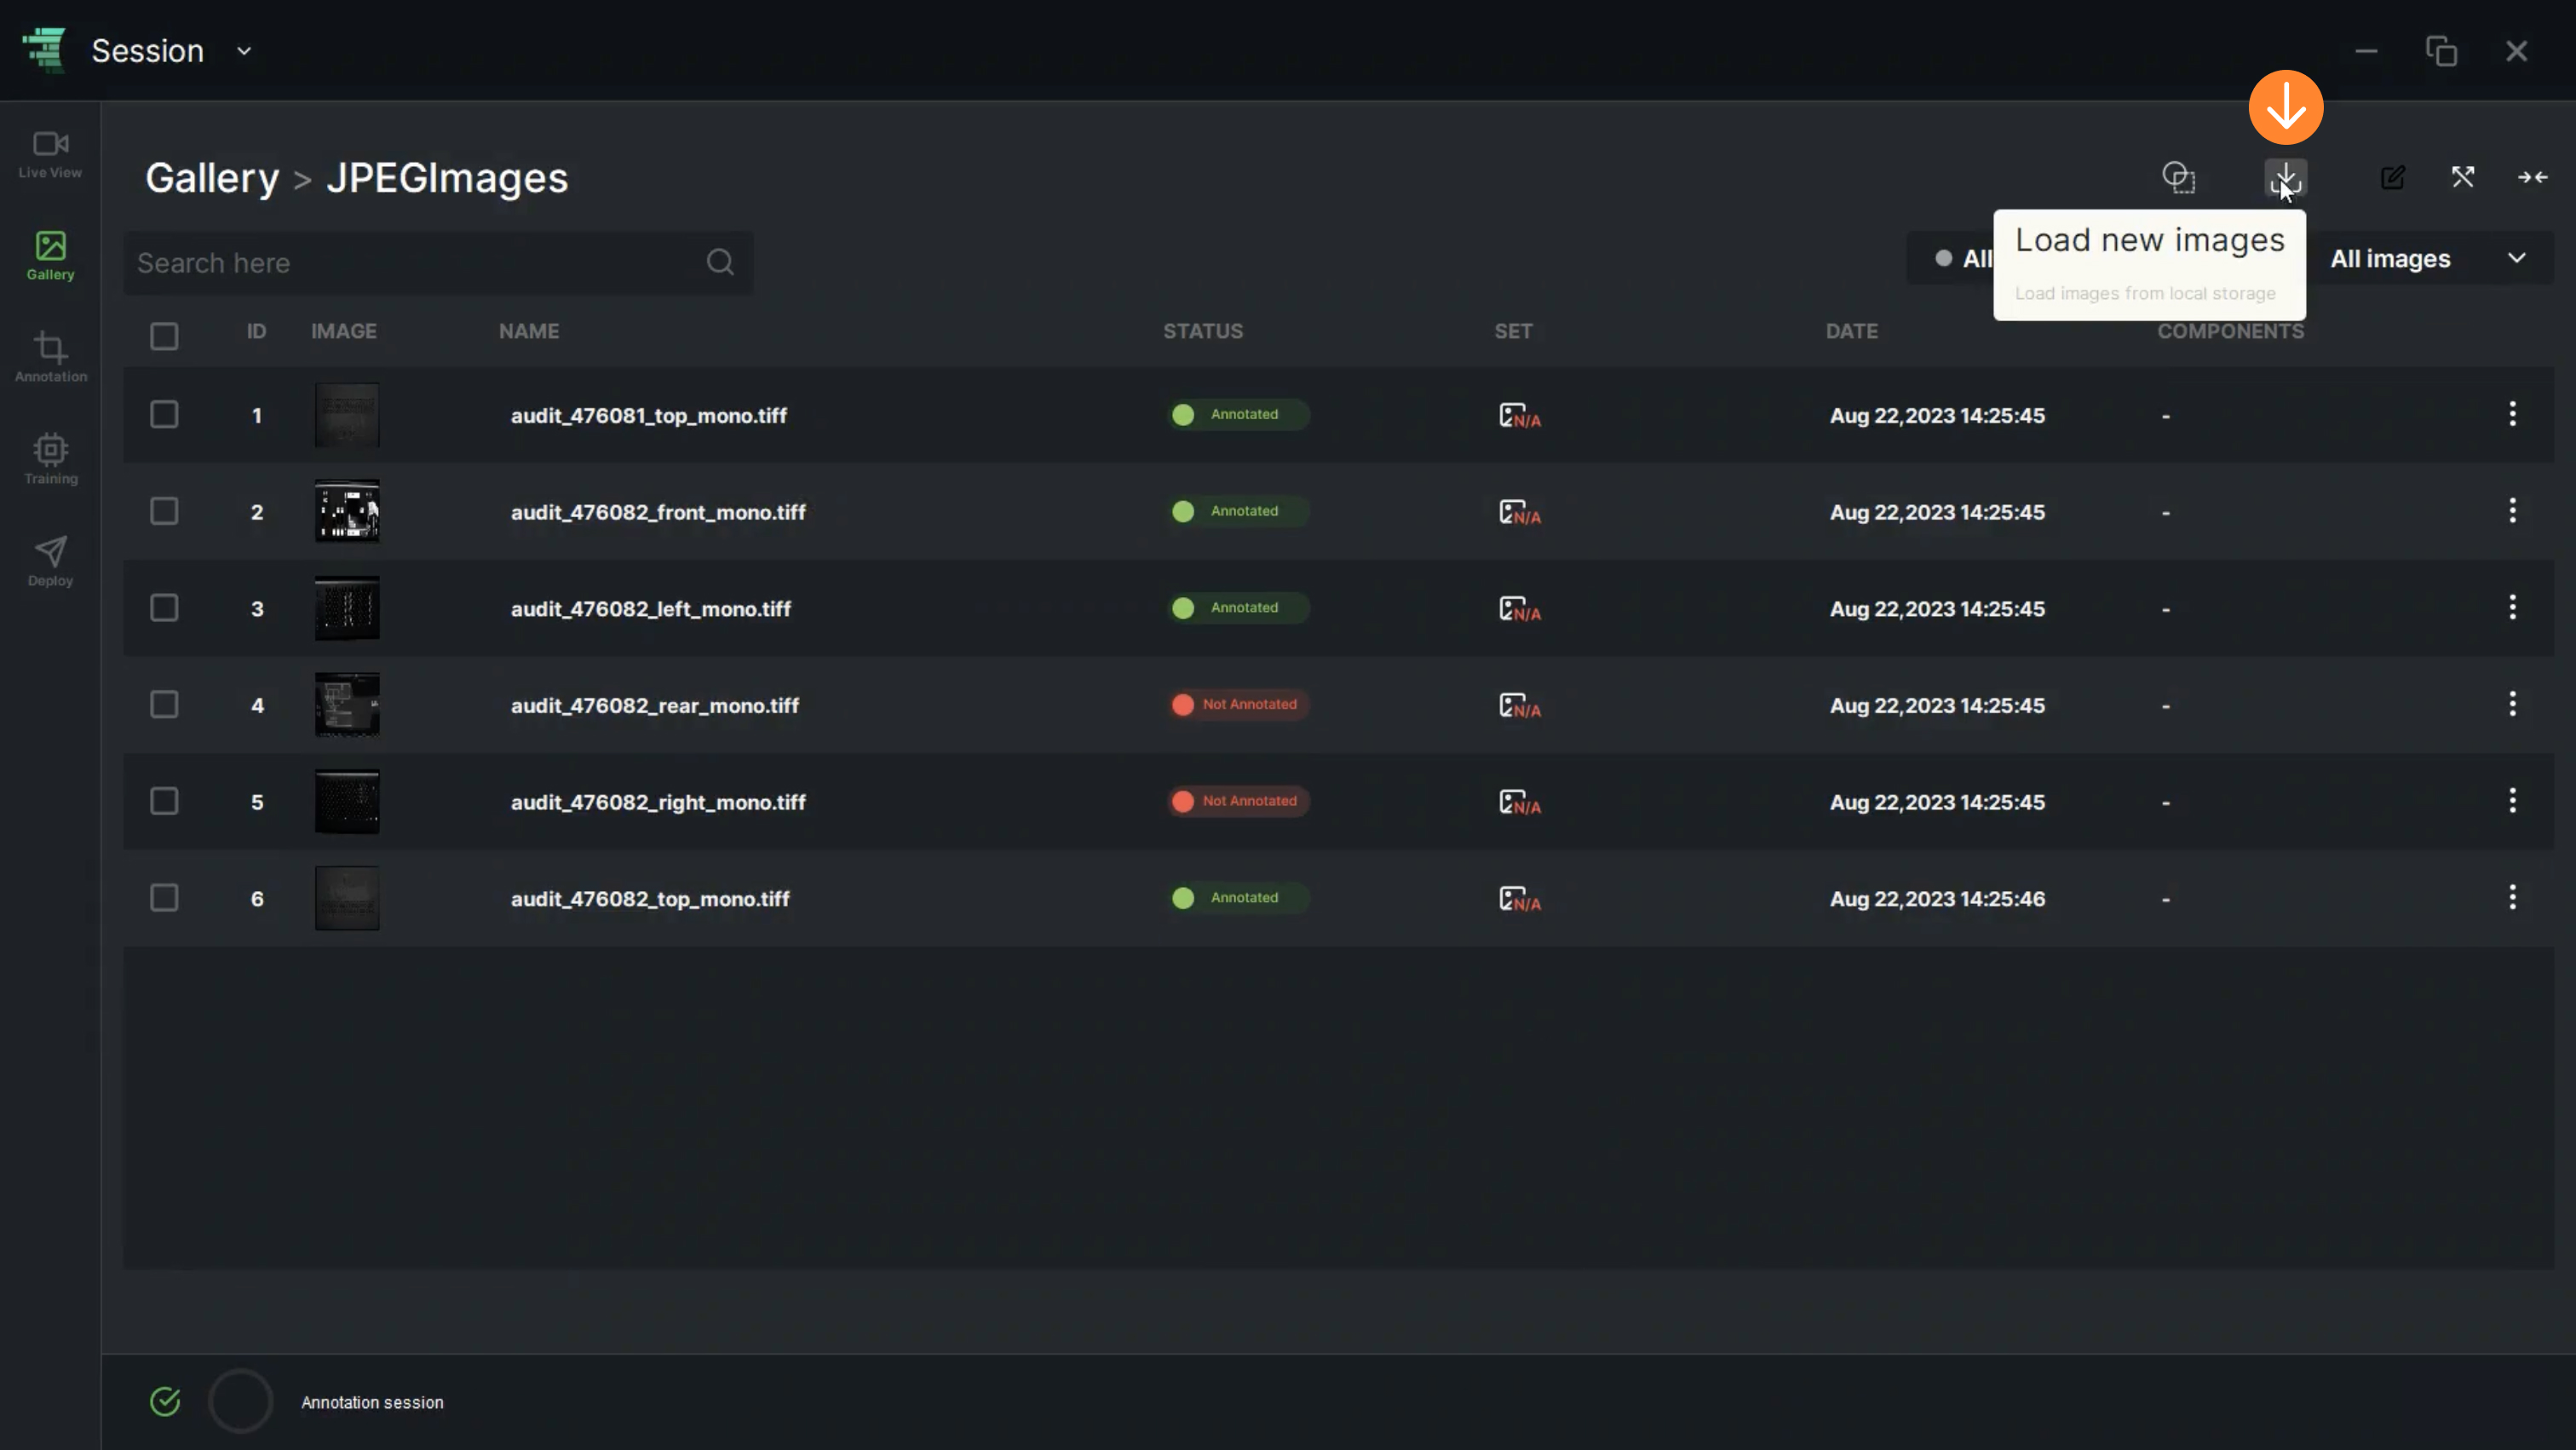
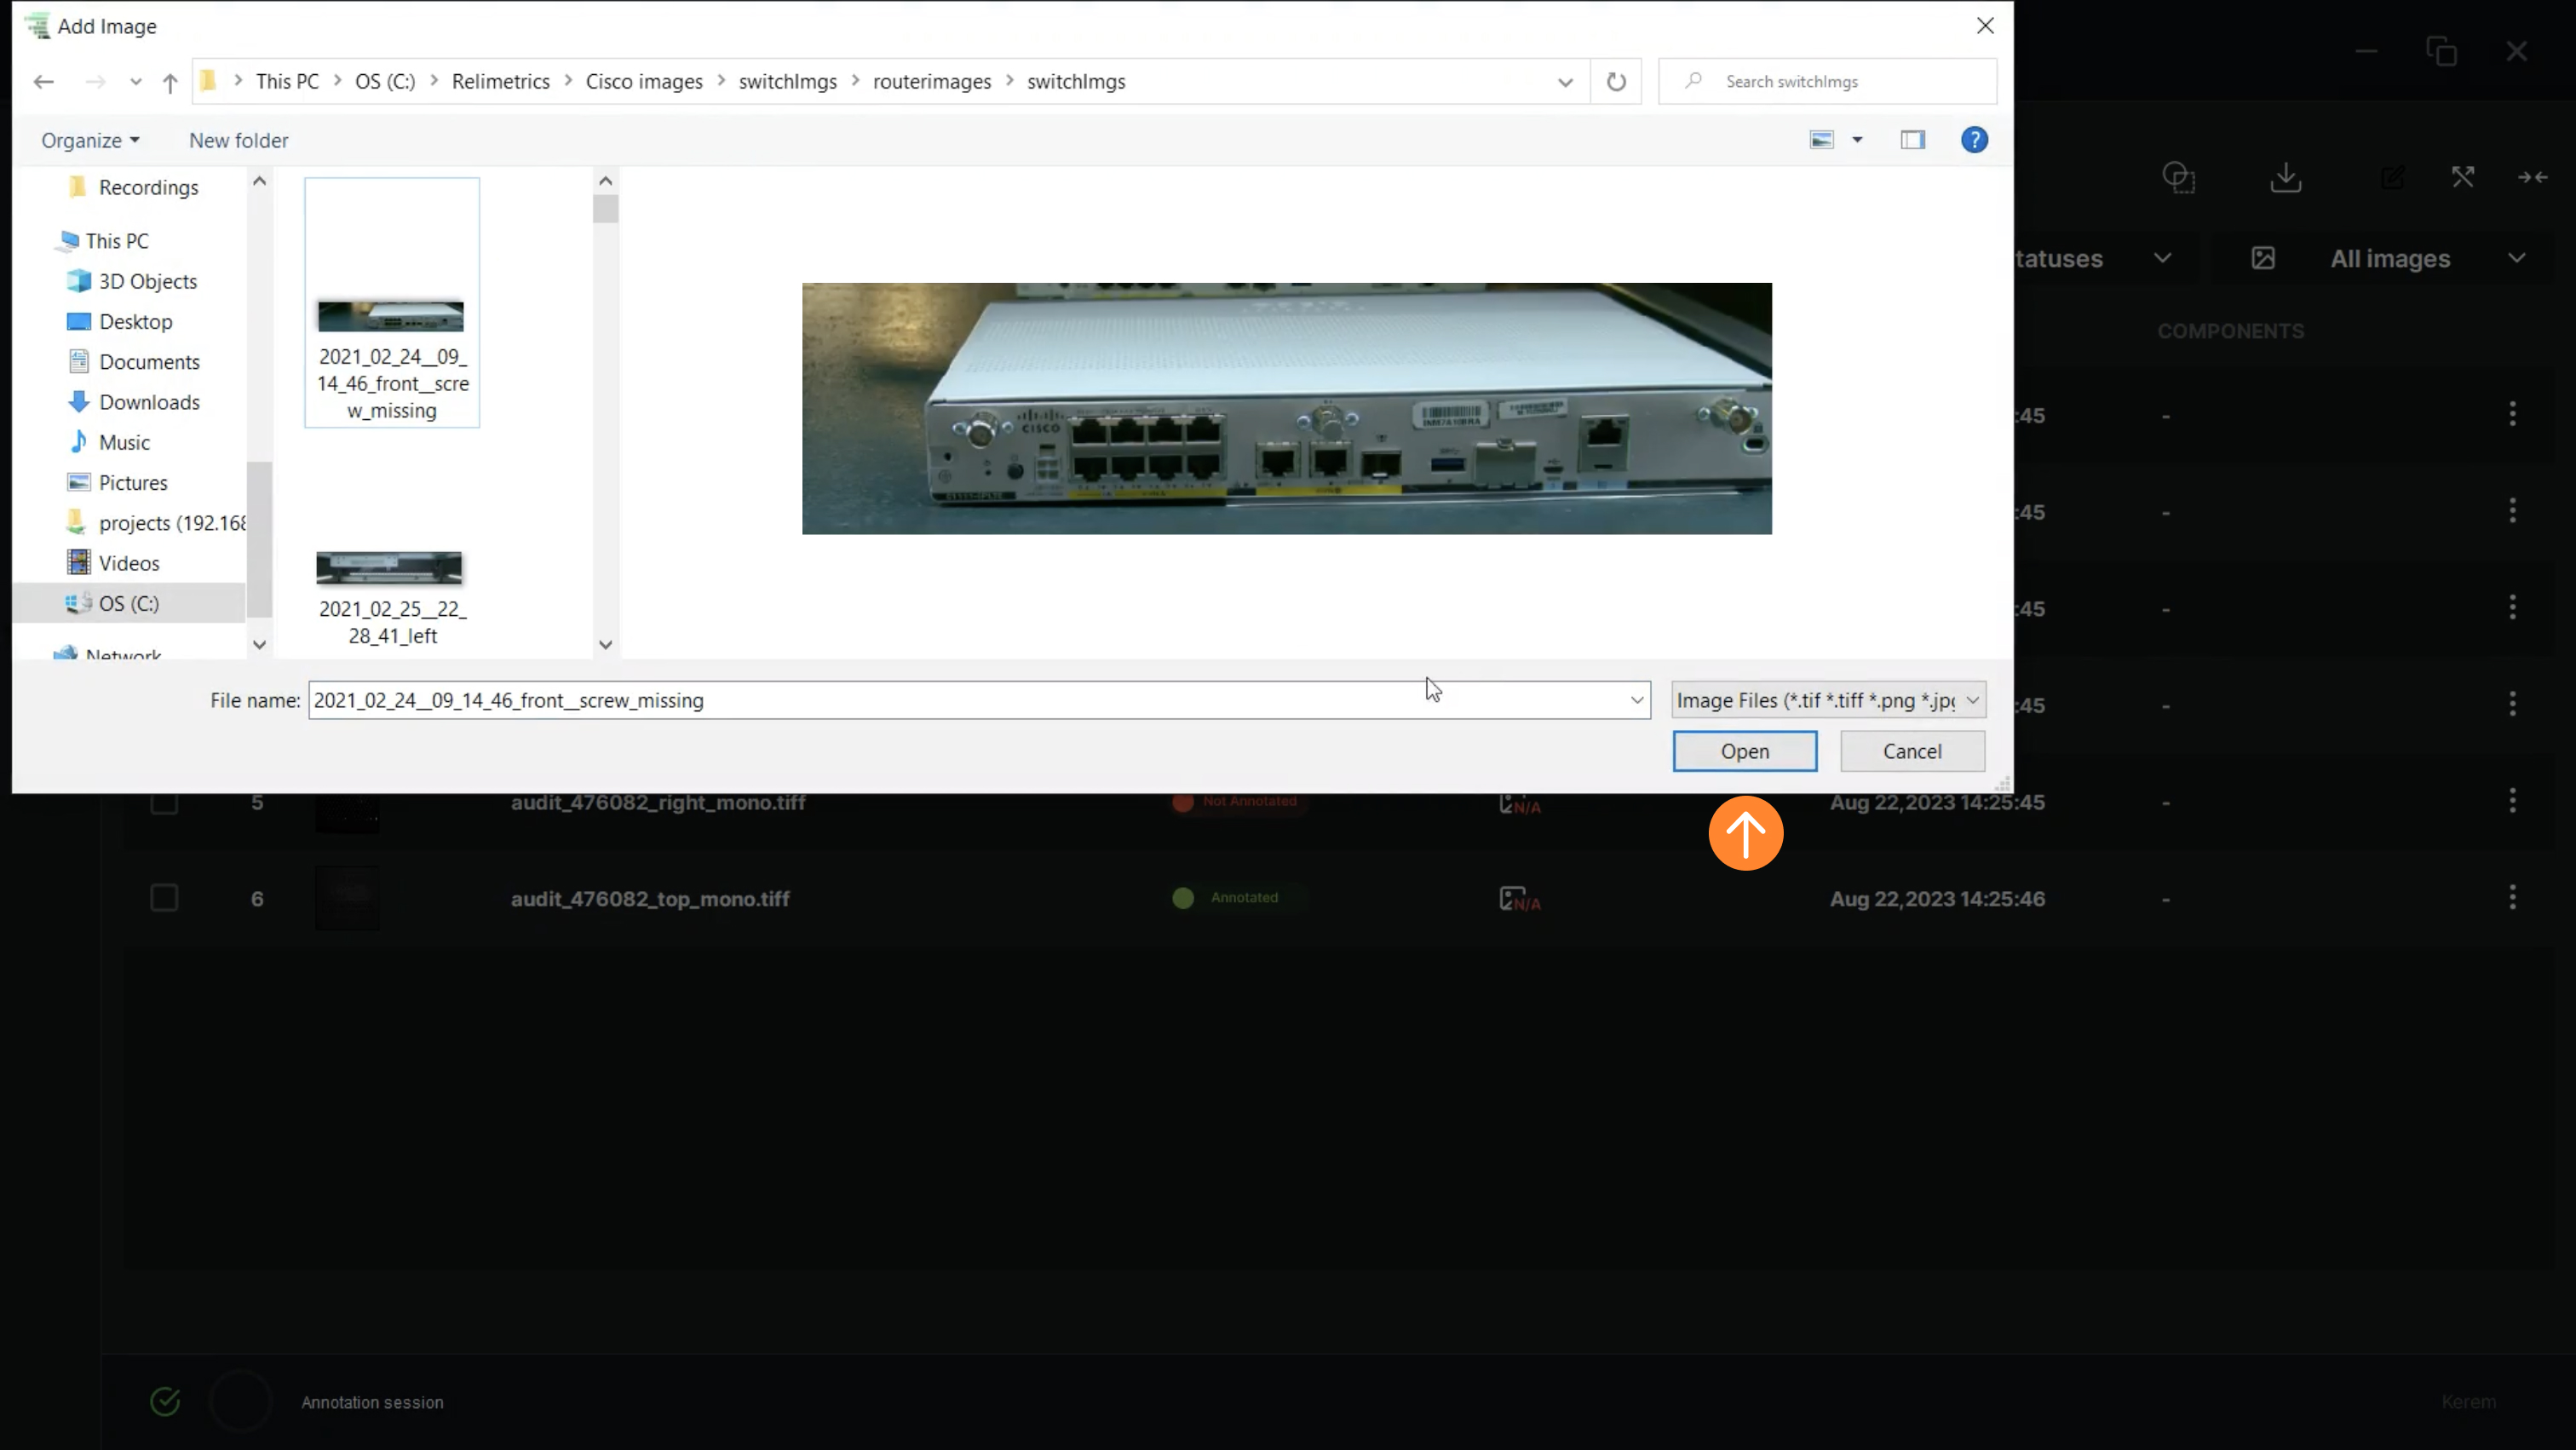
3. “Load New Images” allows the user to upload images locally

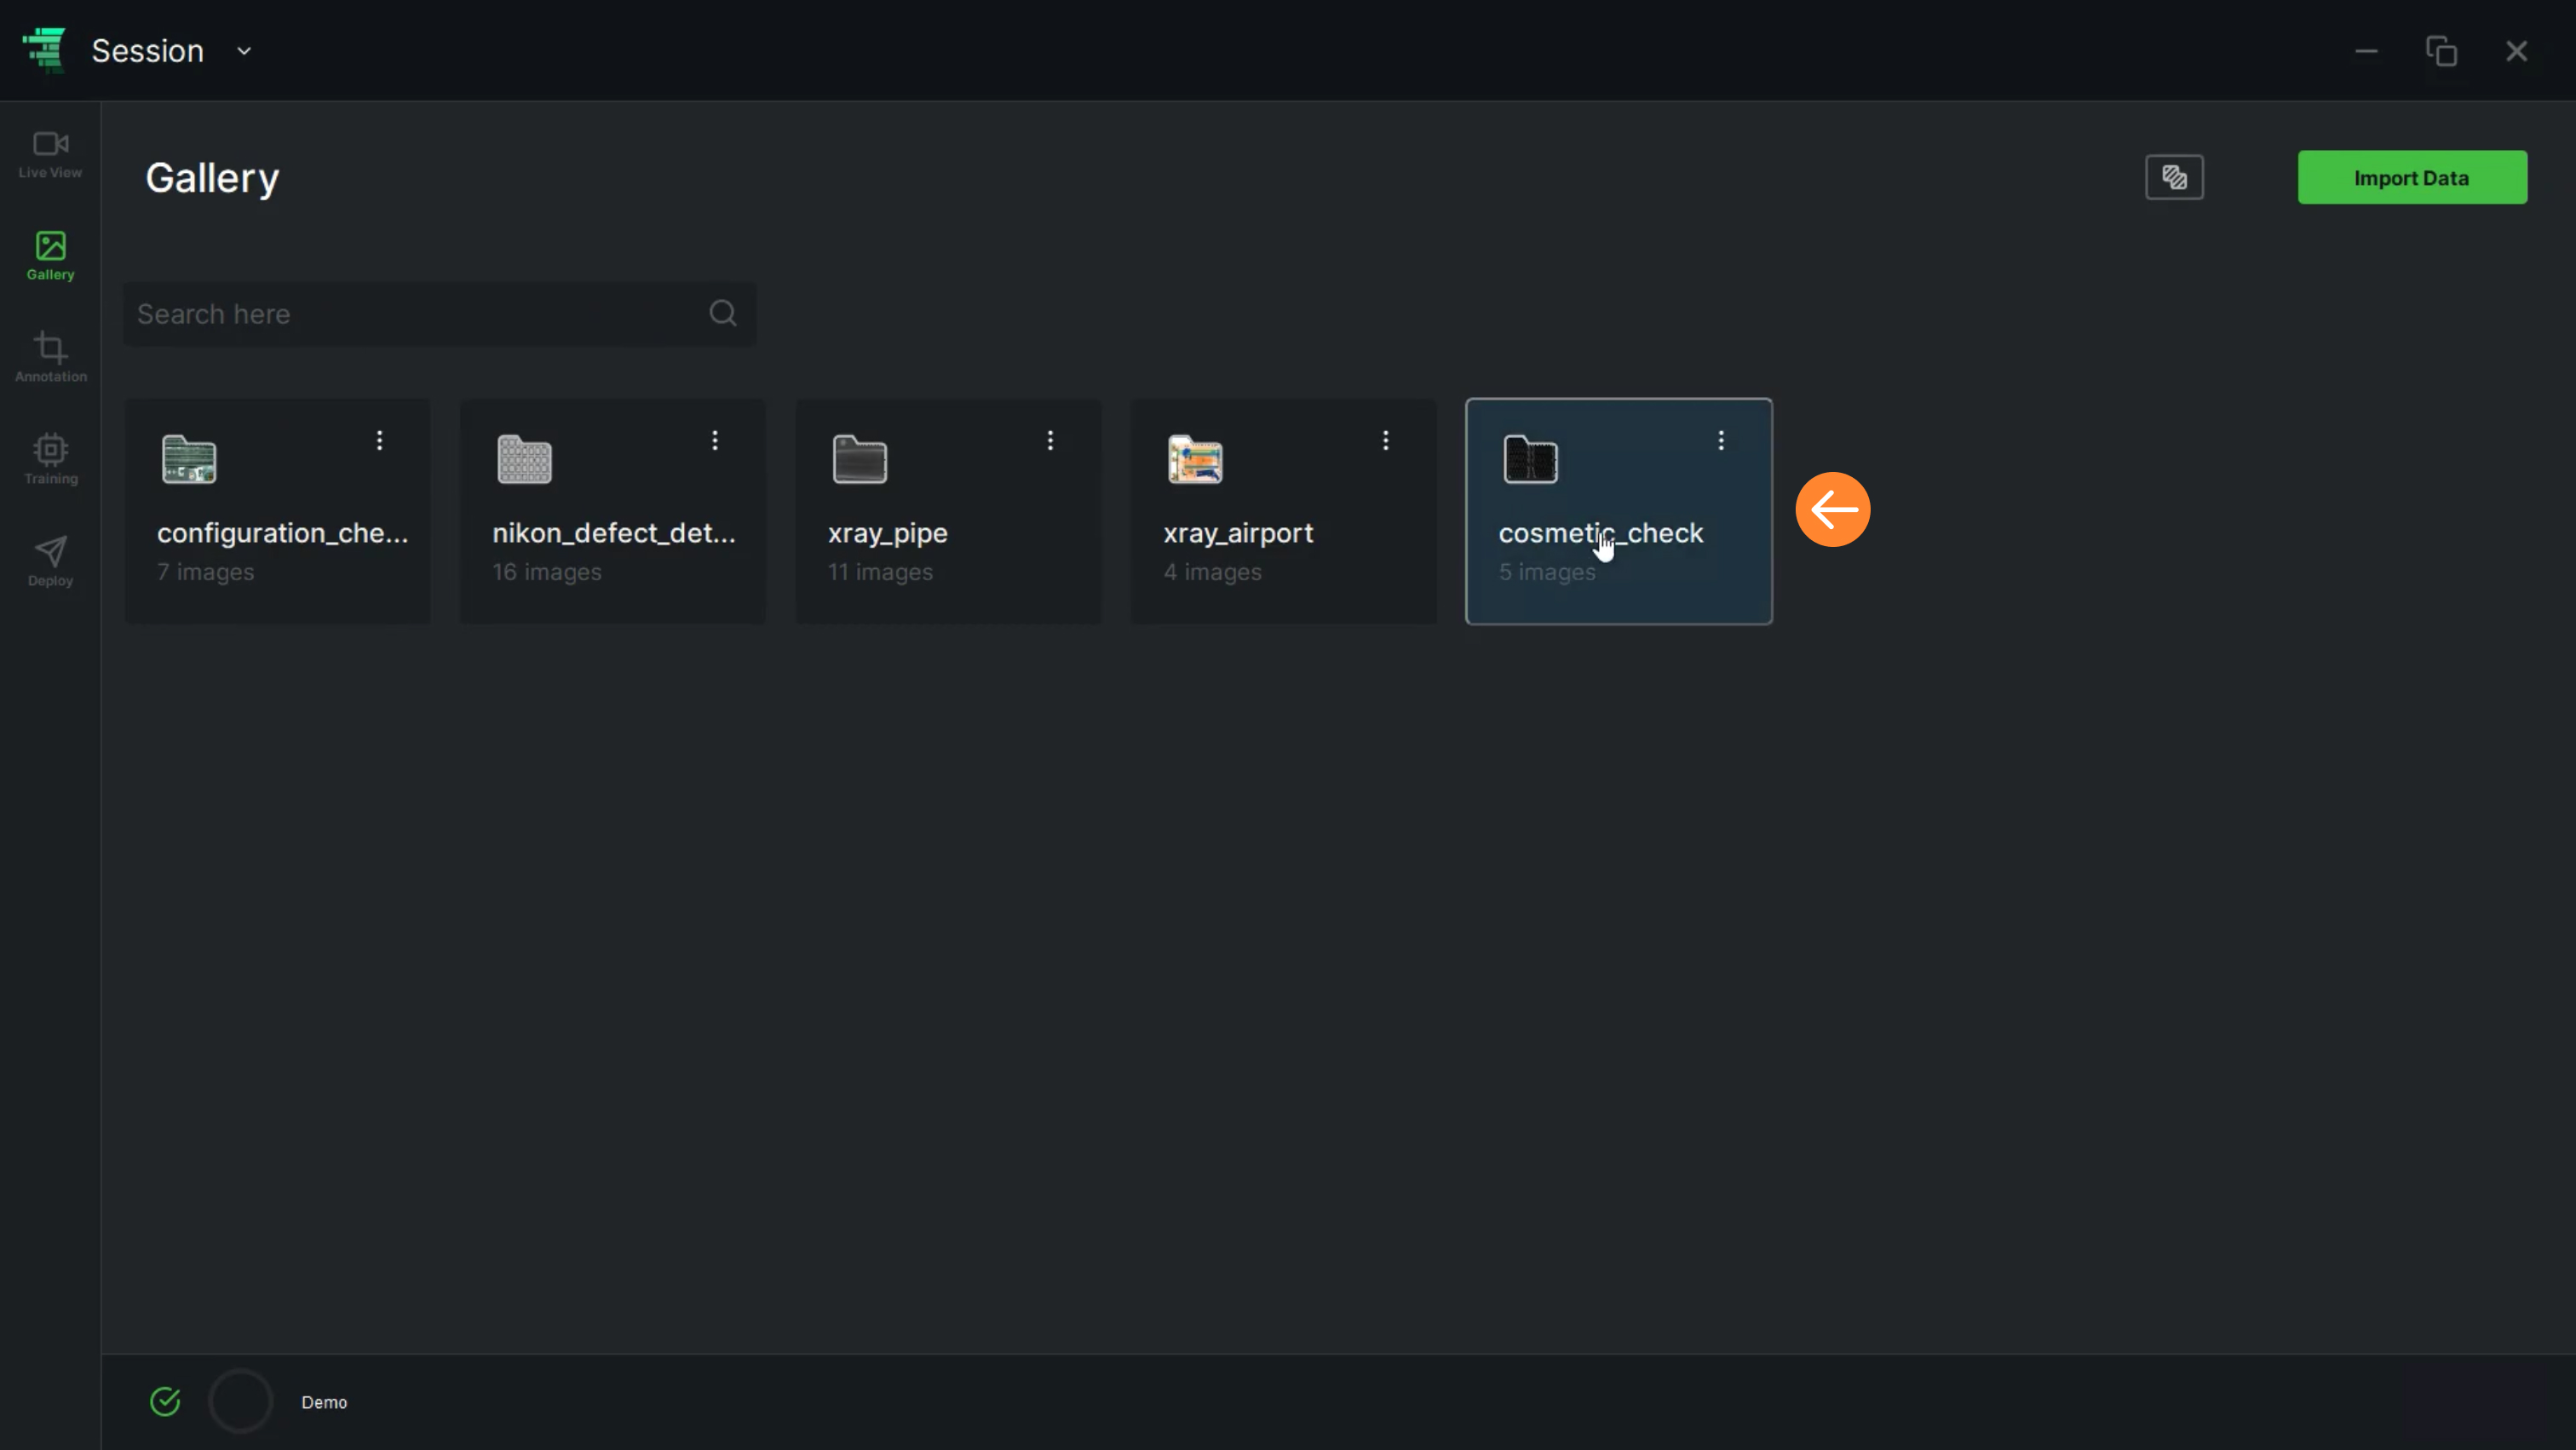
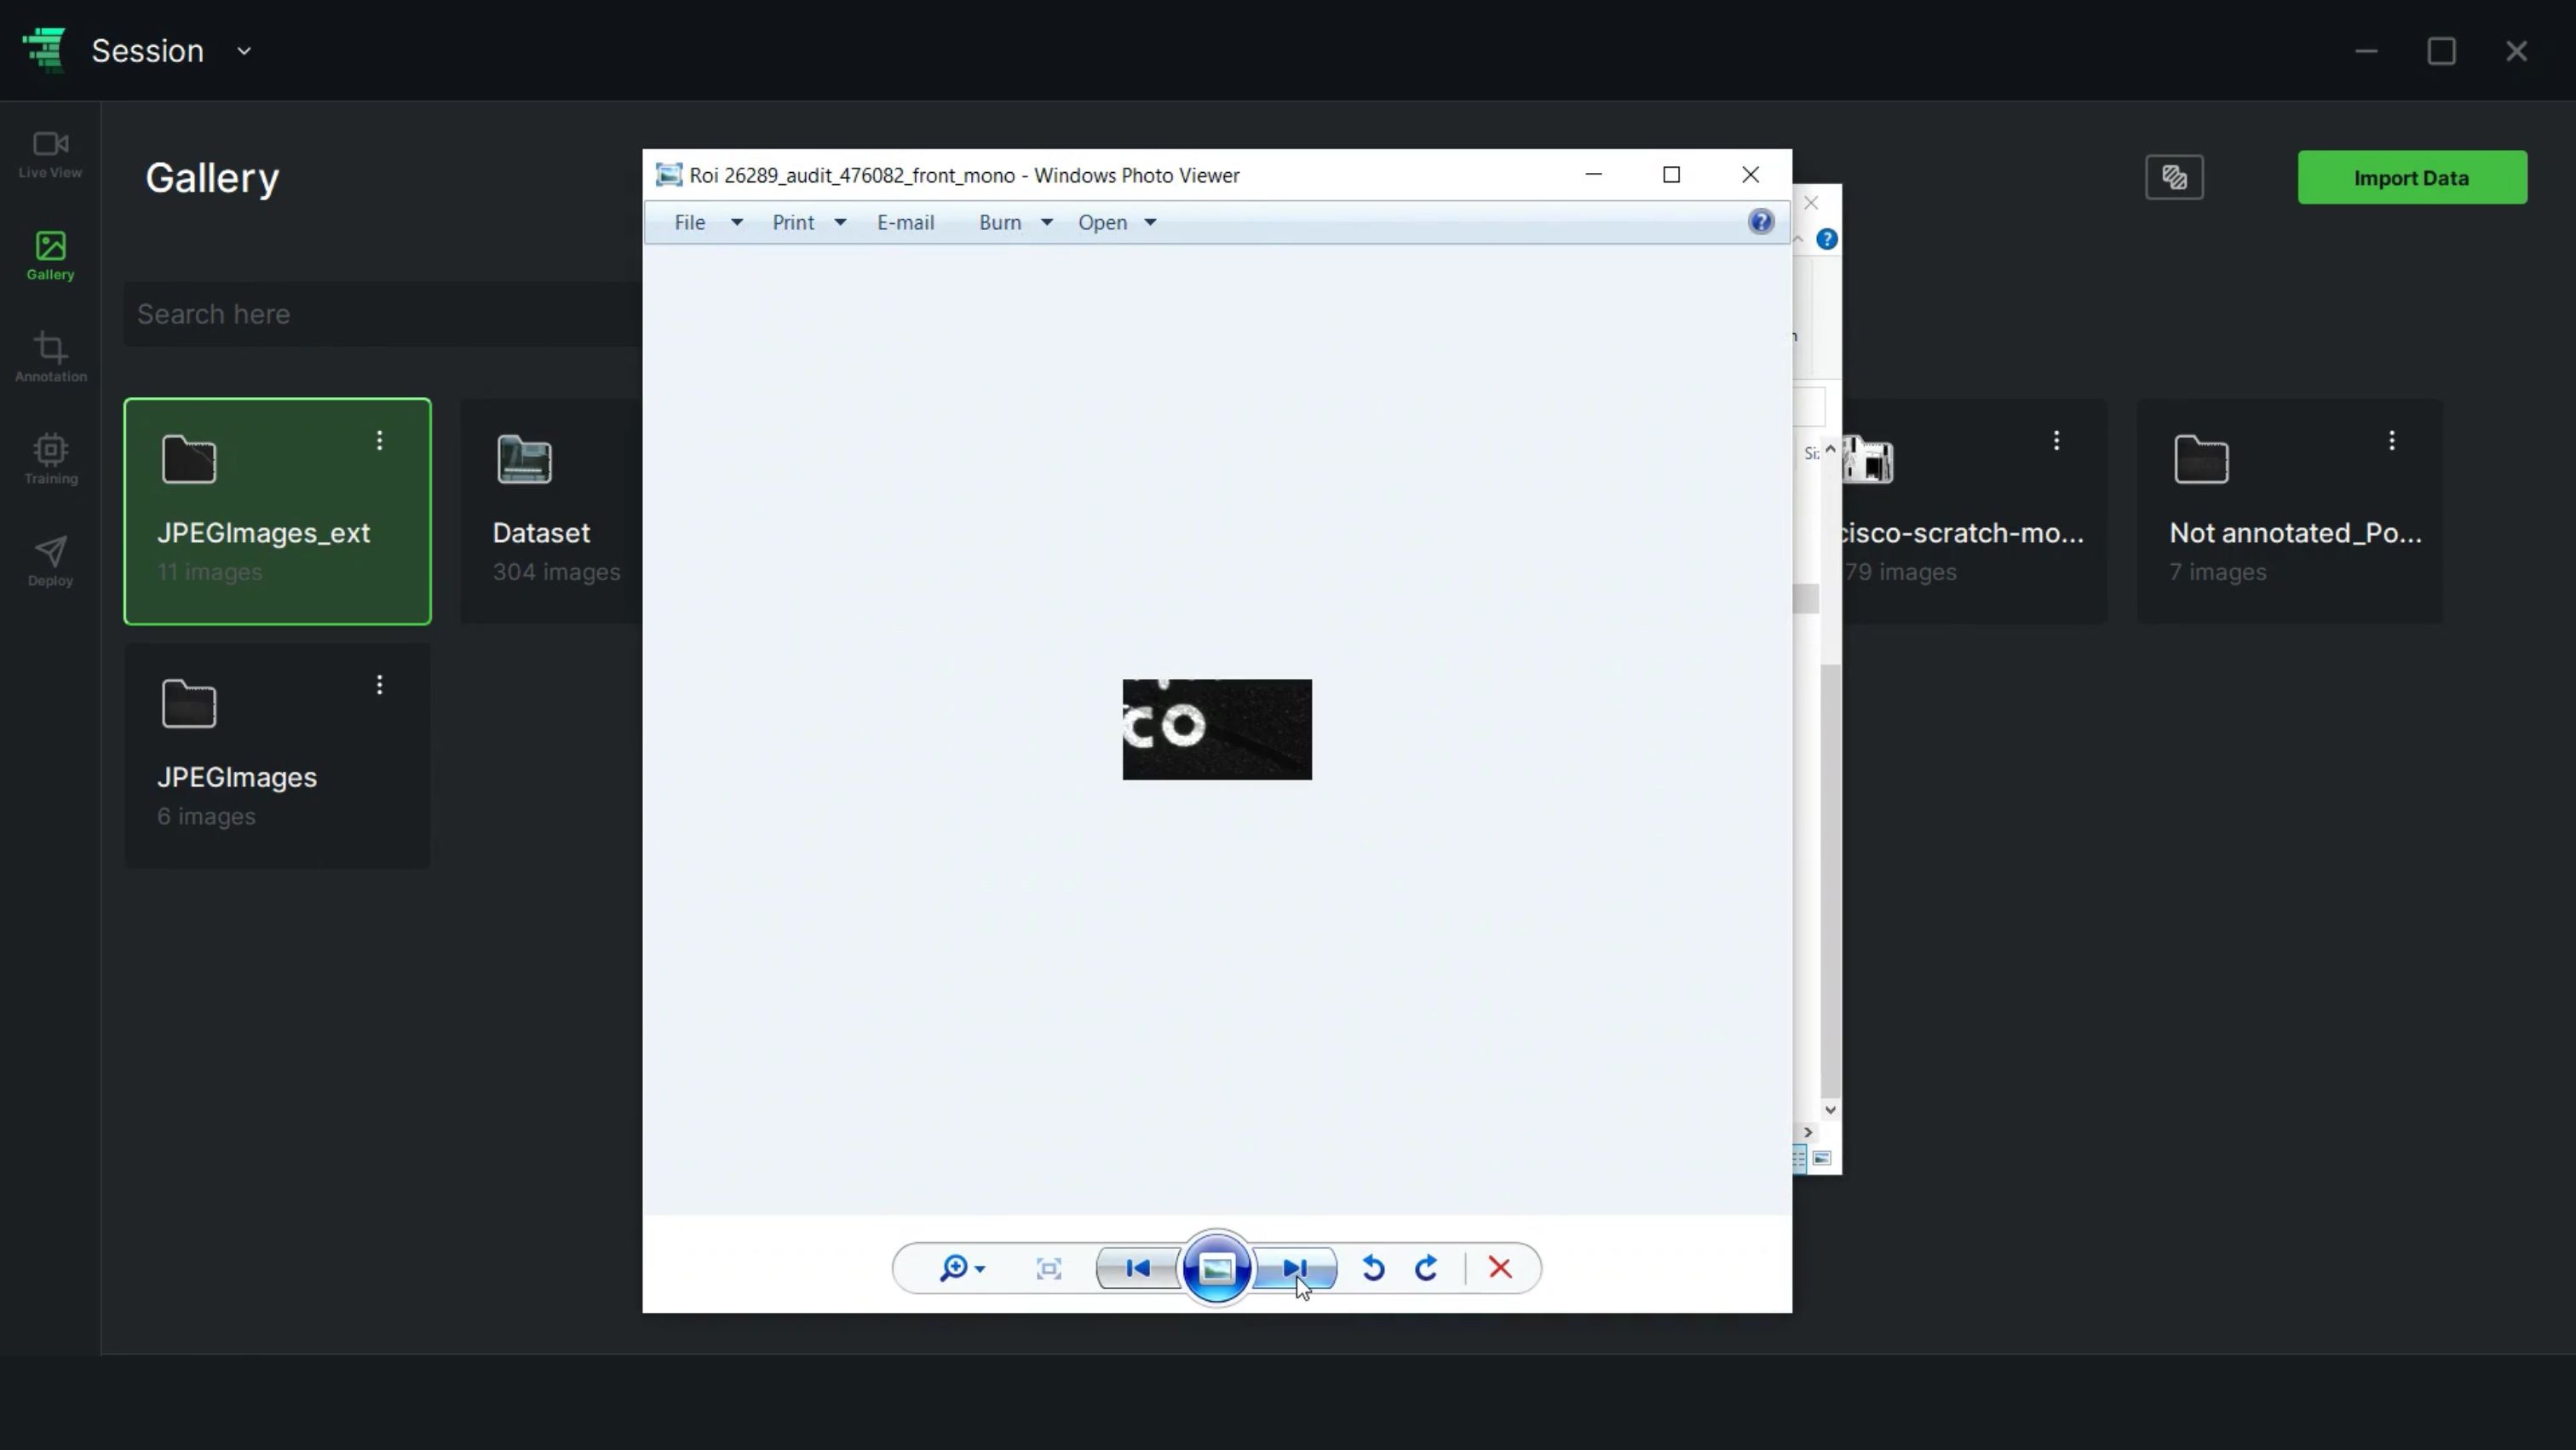
4. The user should select an image from the directory. Once an image is selected, click on “Open”

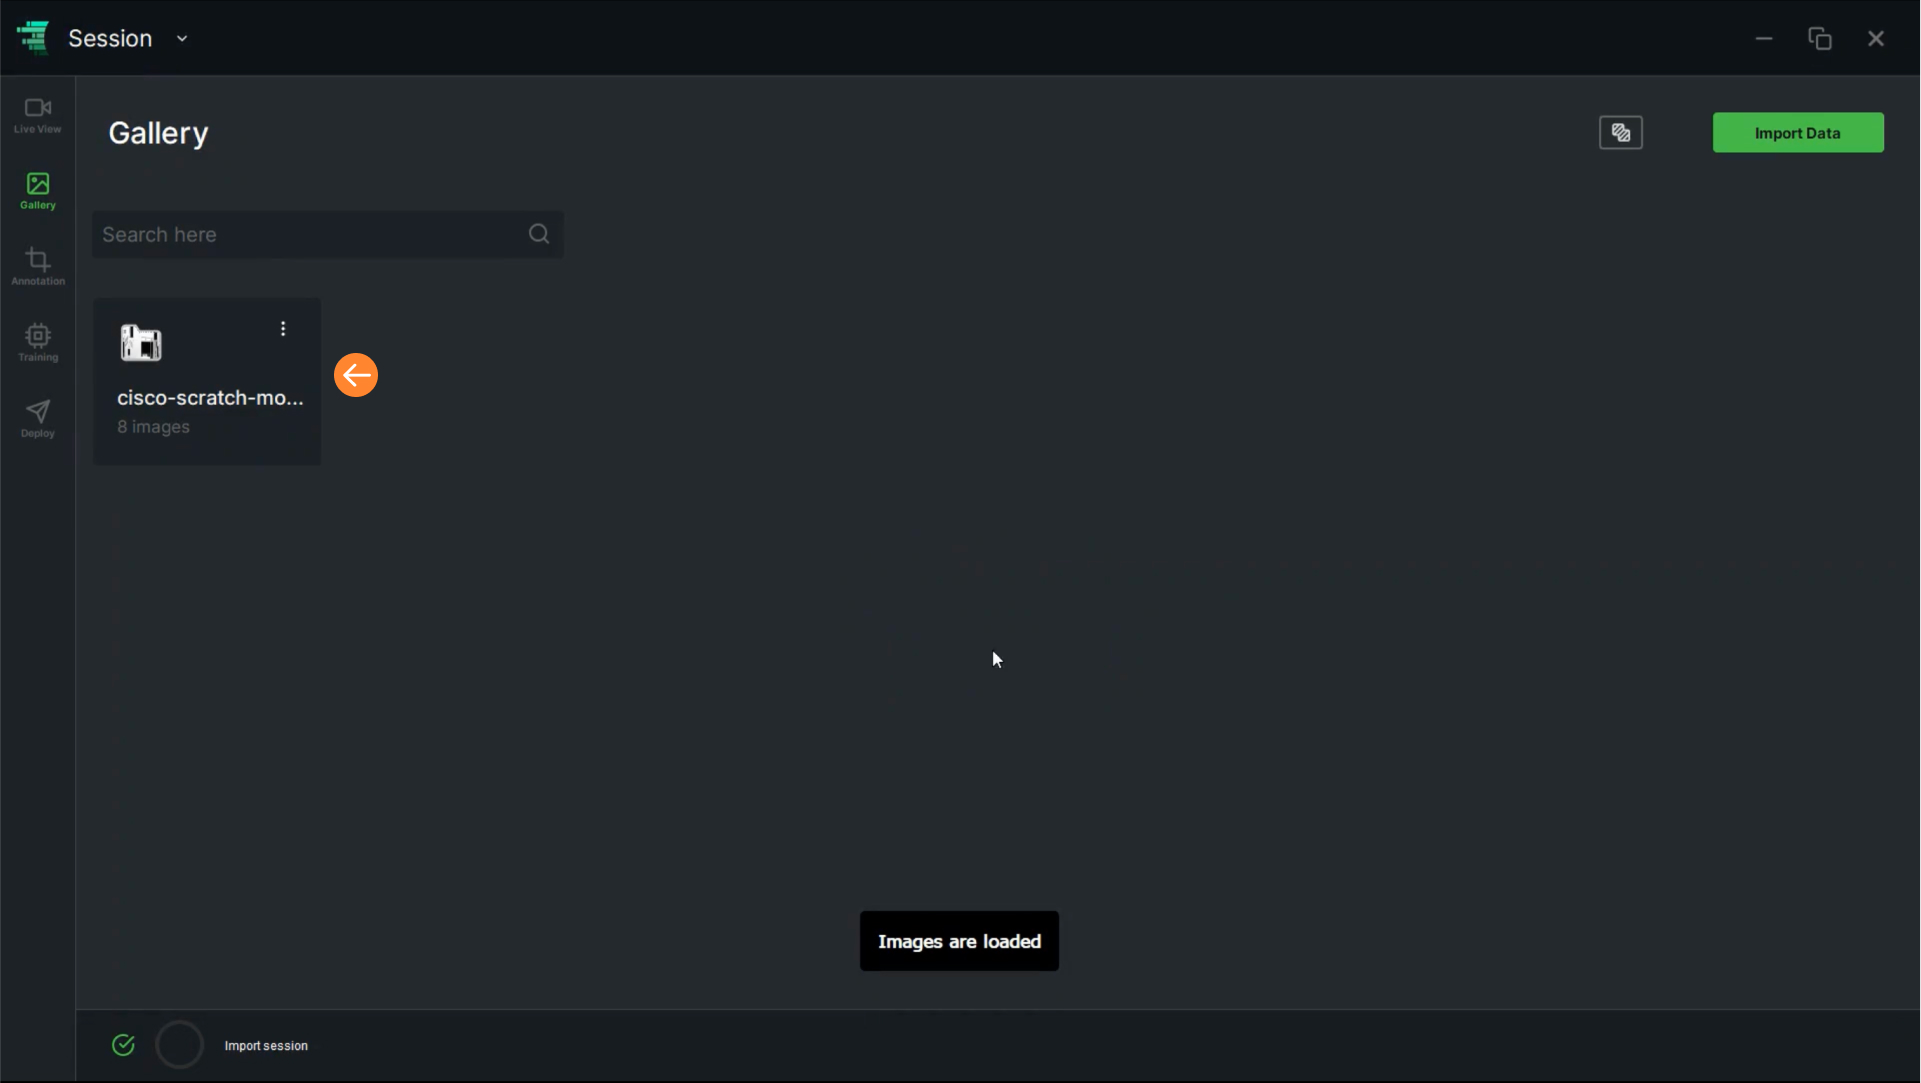
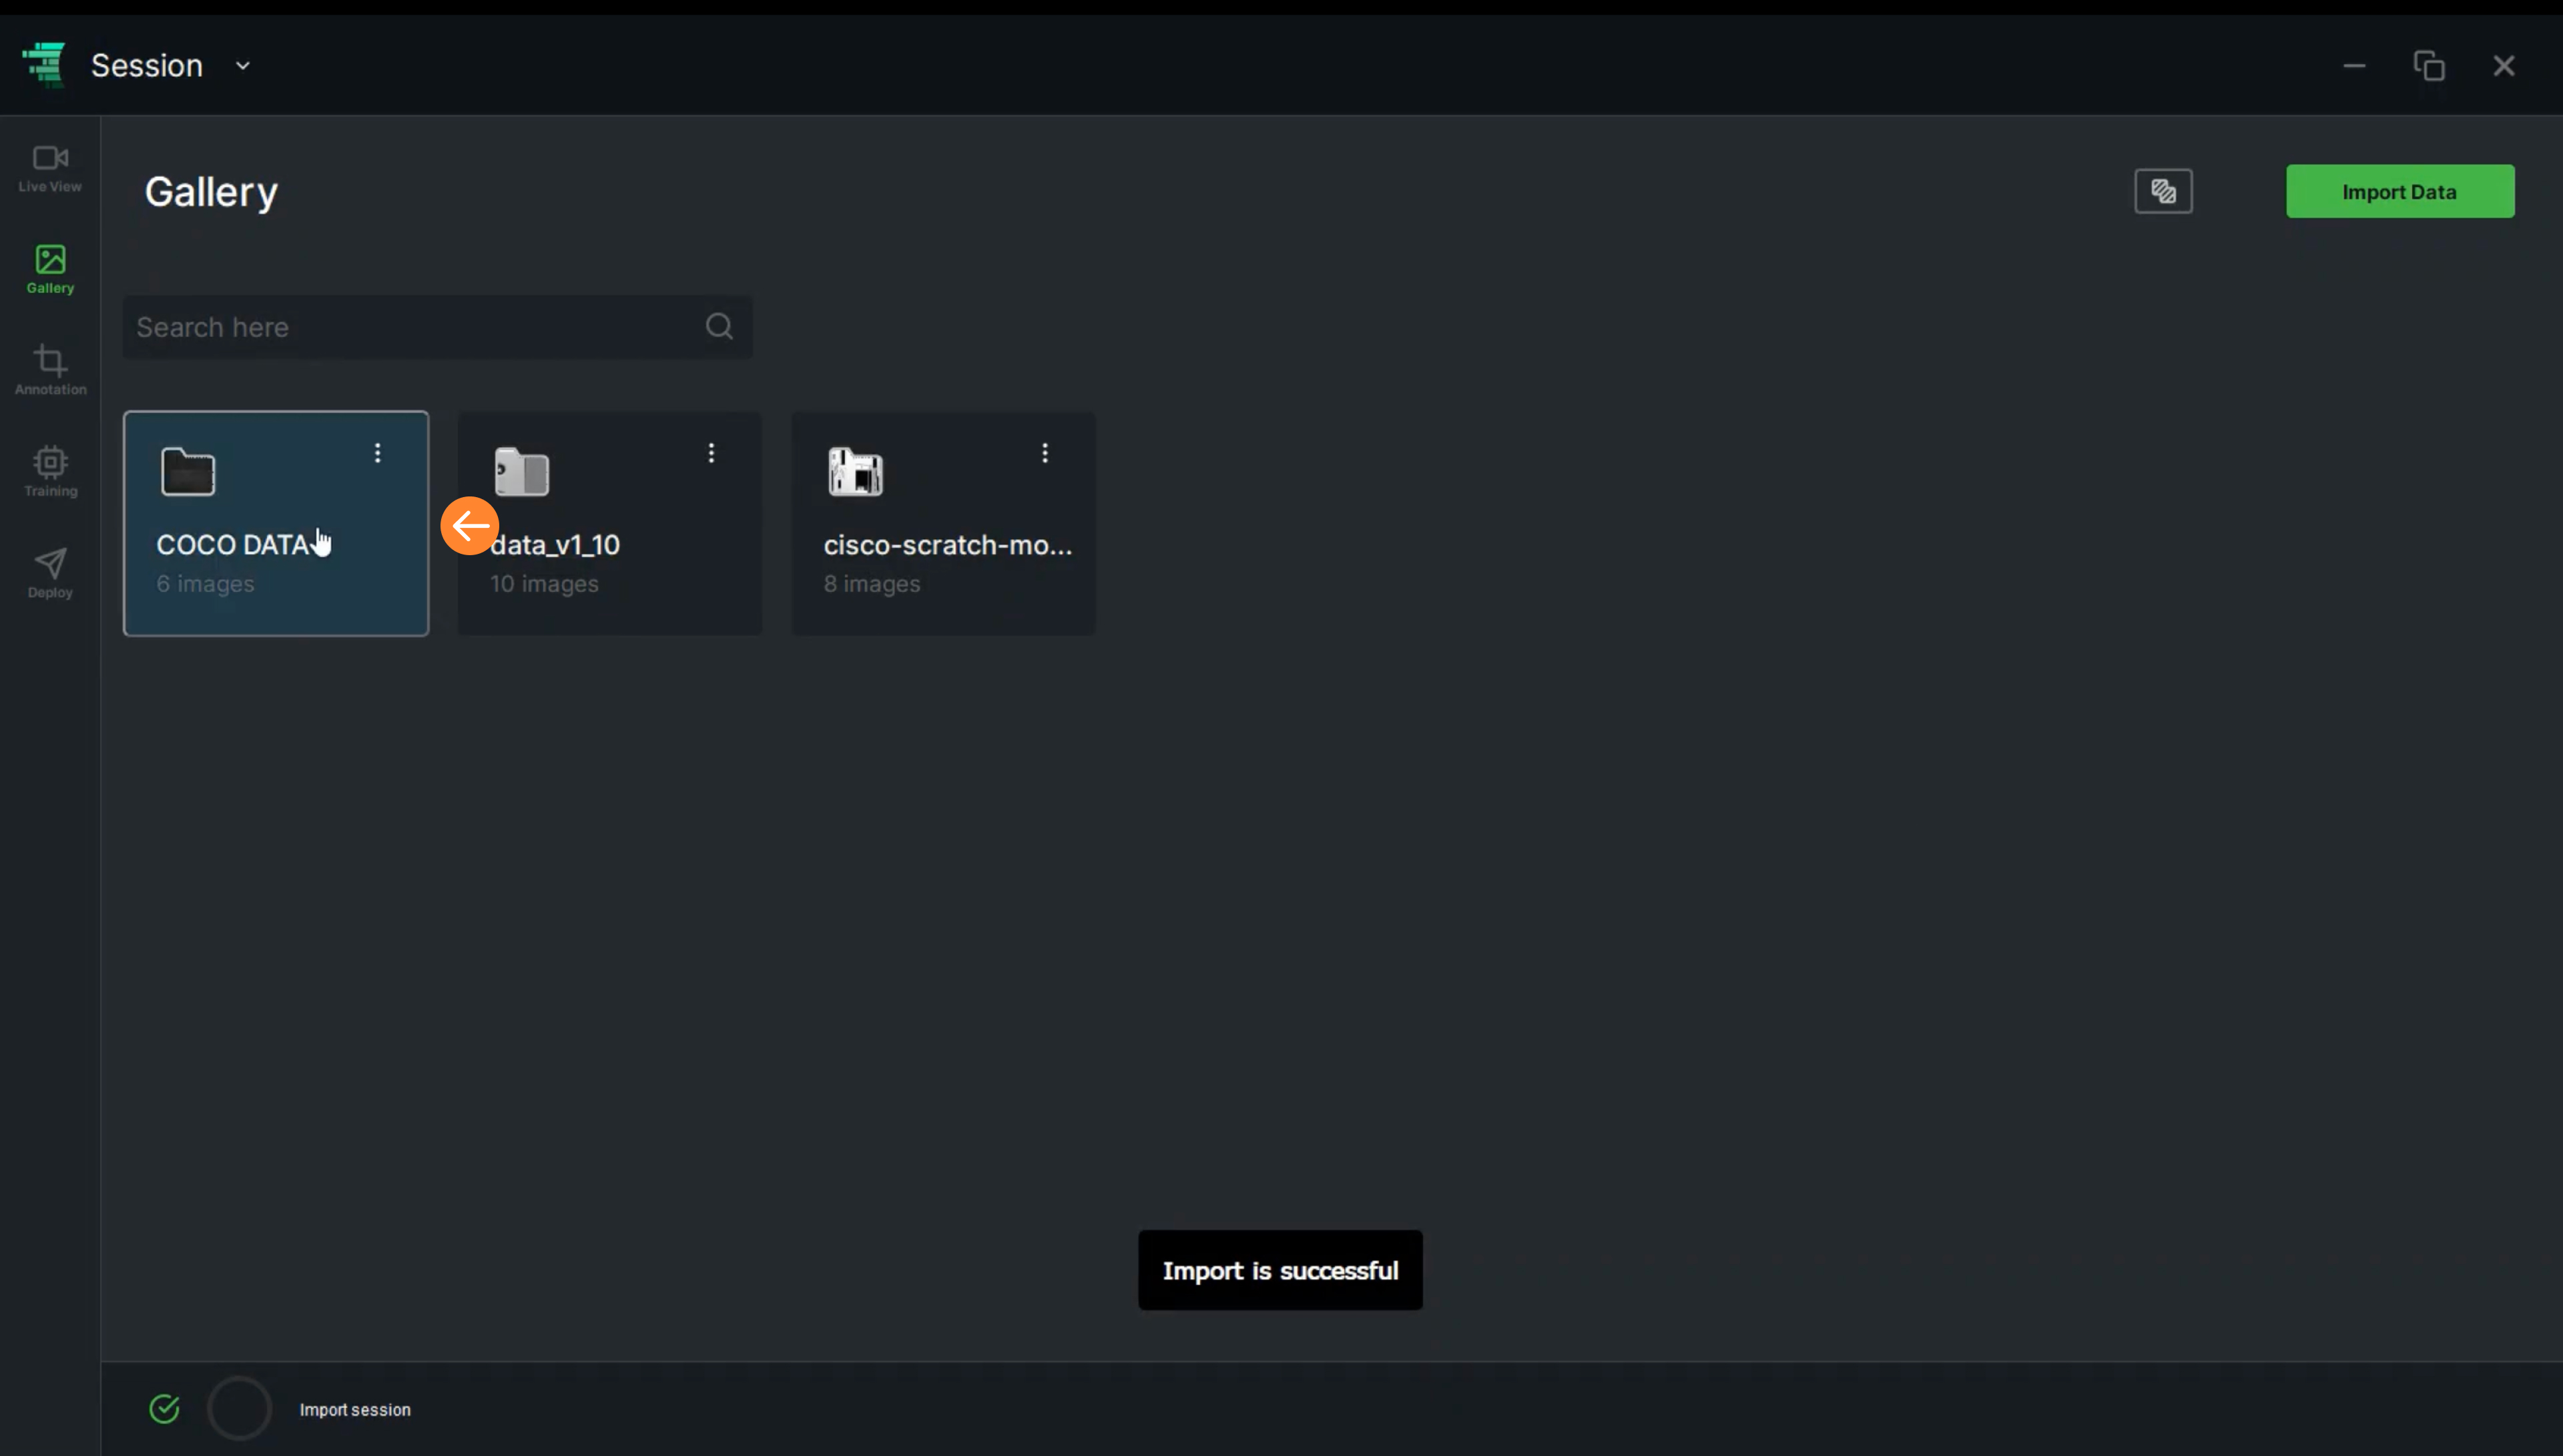
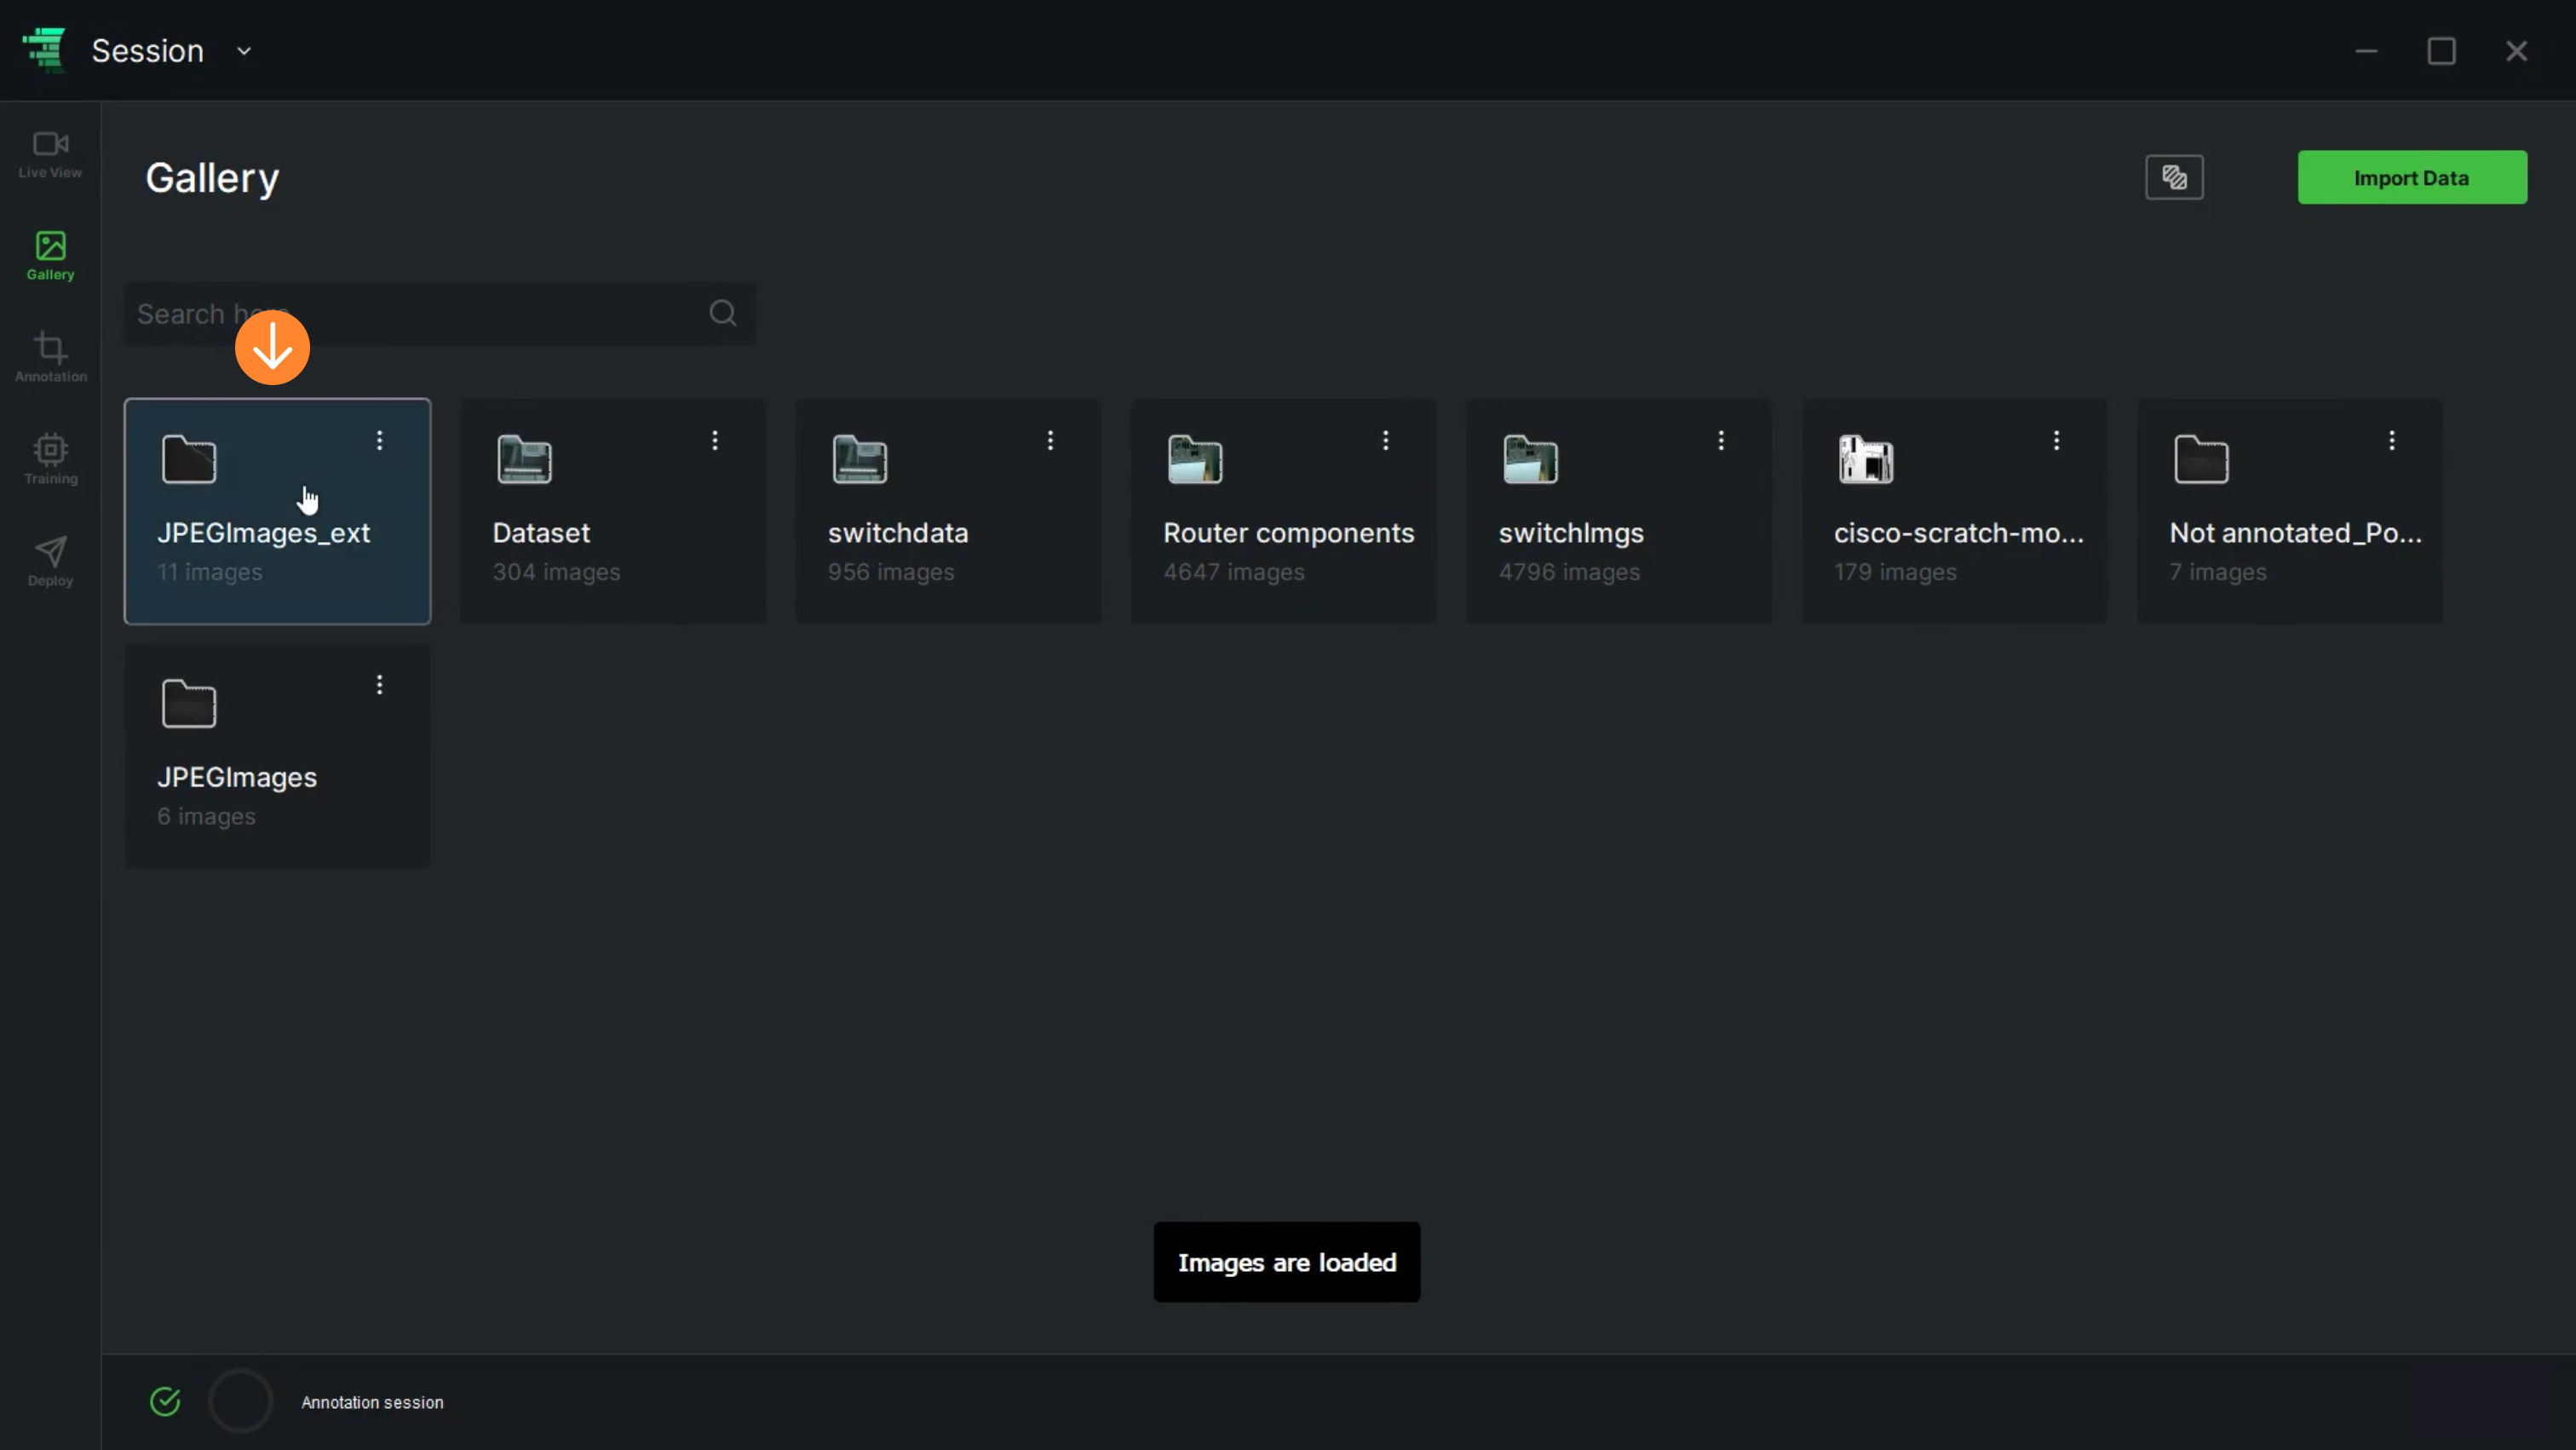
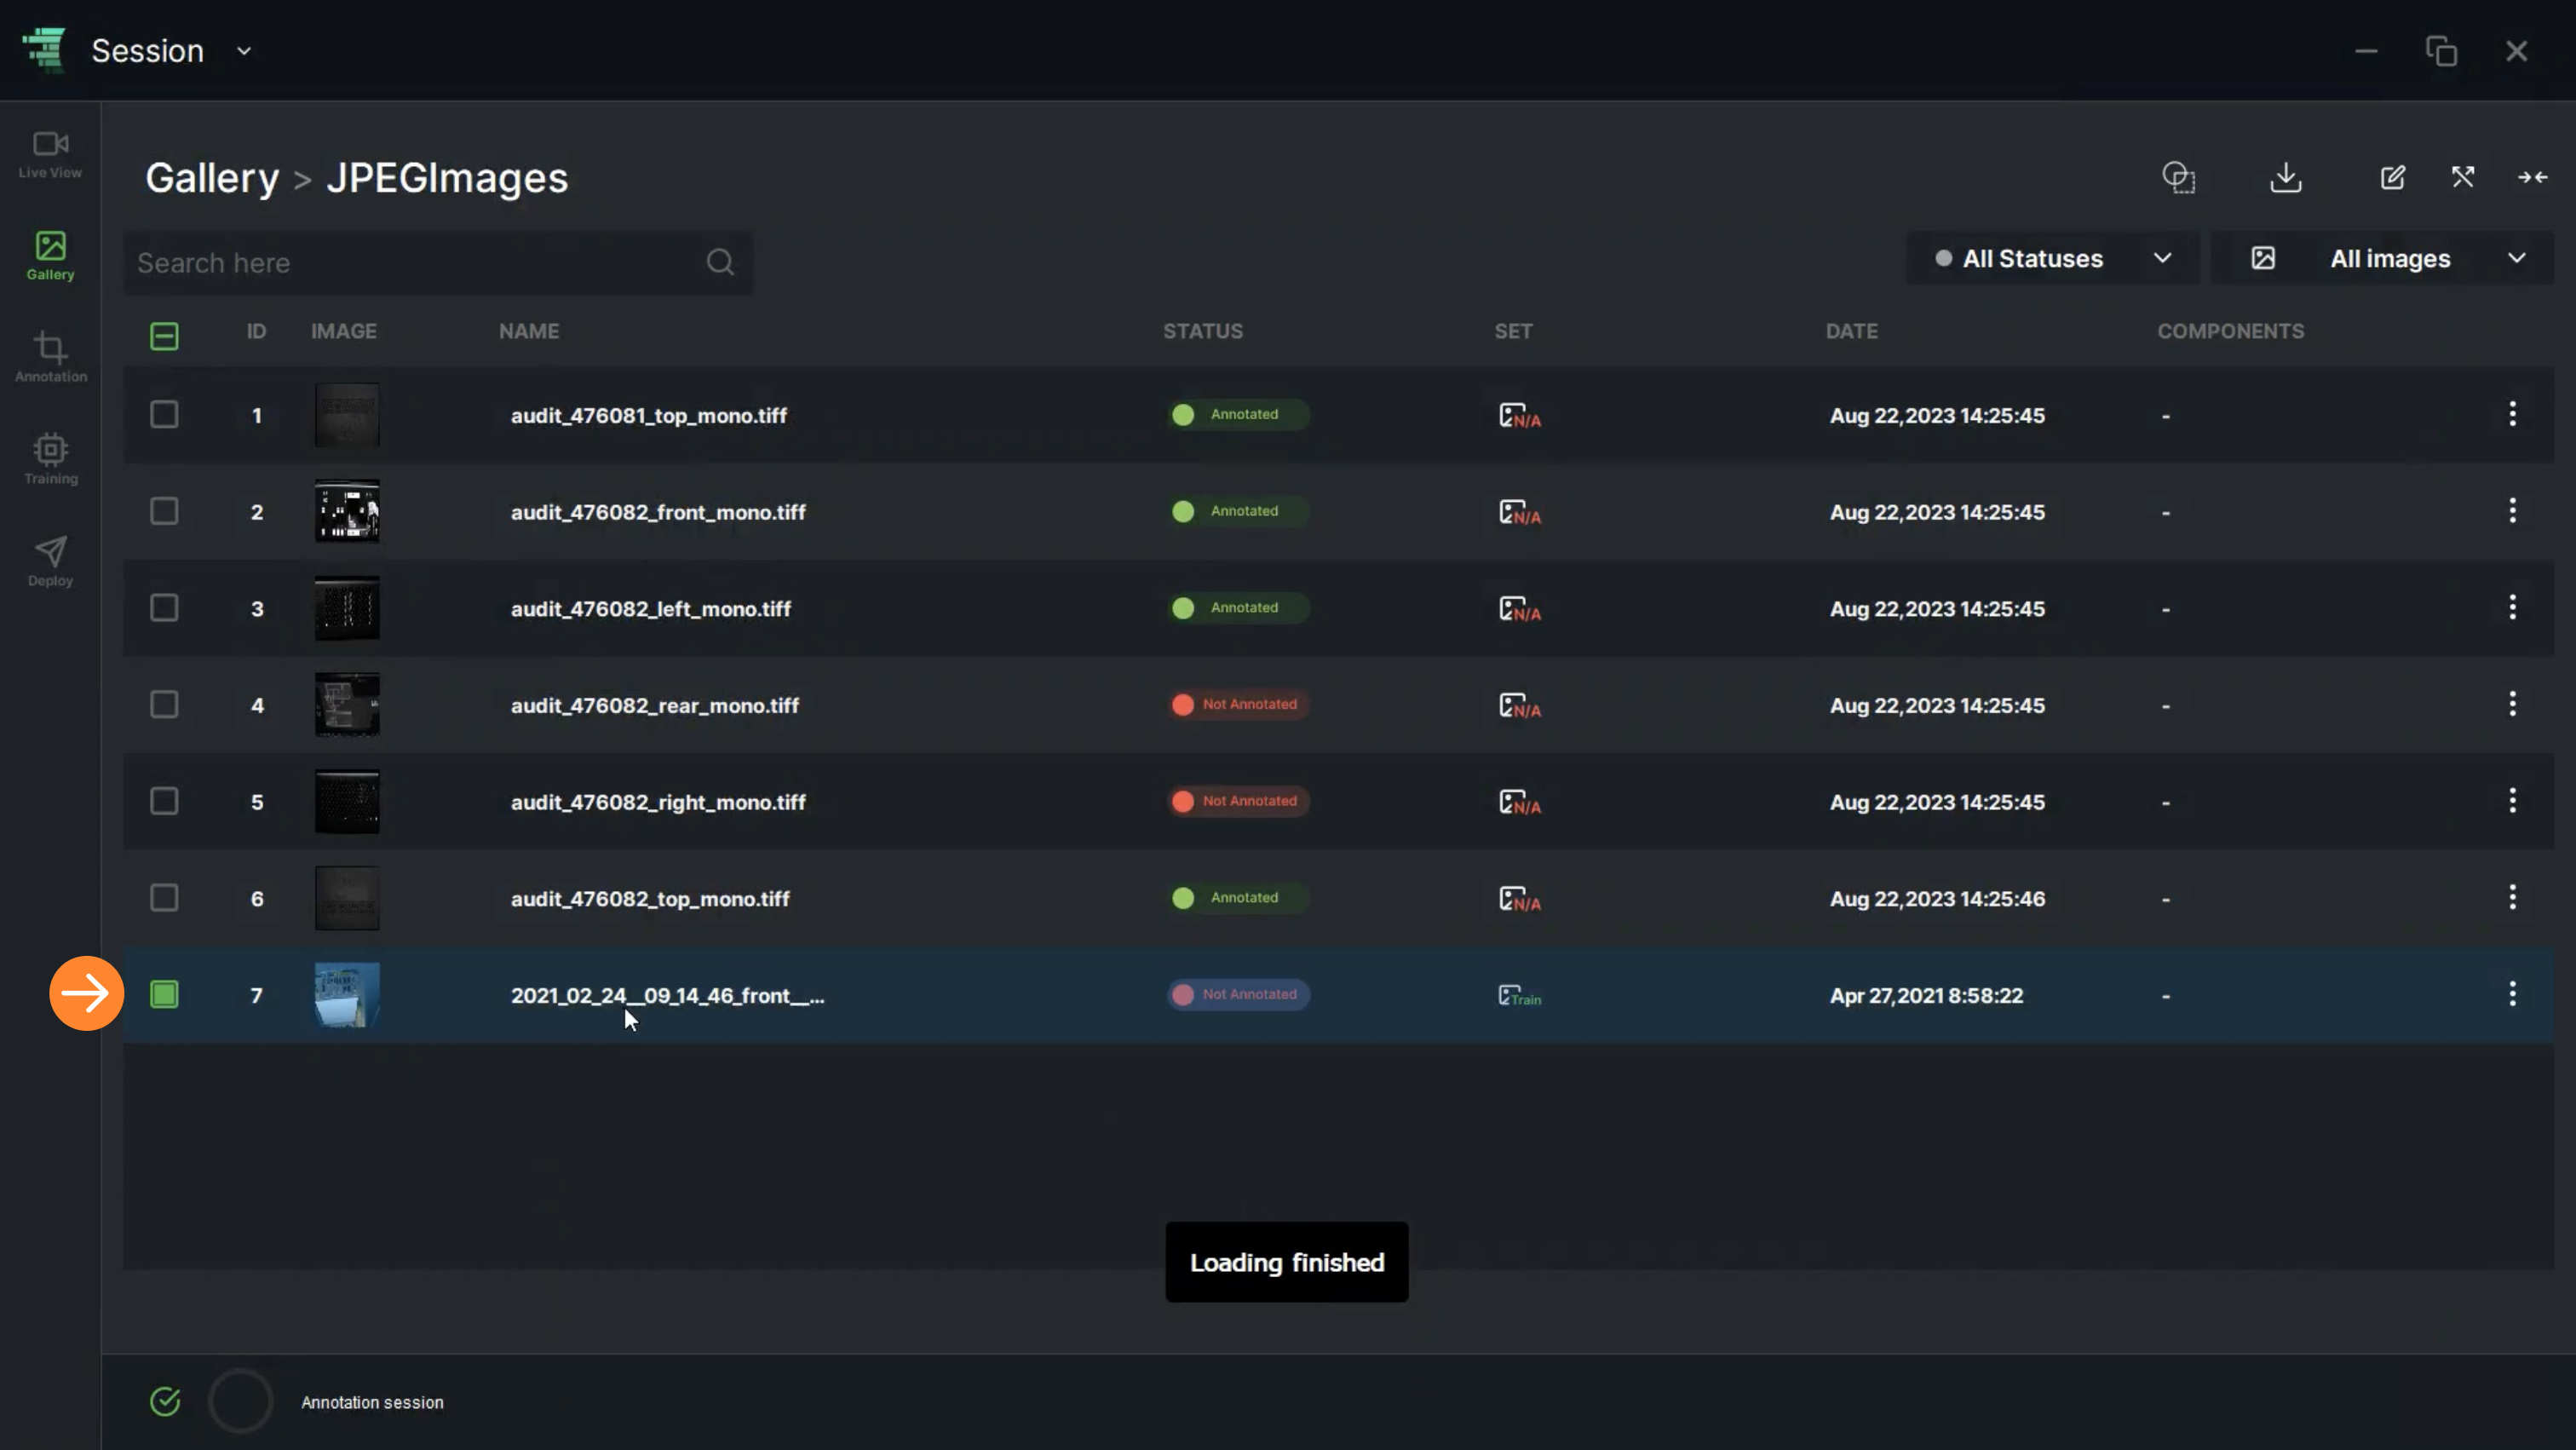
5. The imported image will be shown in the image list

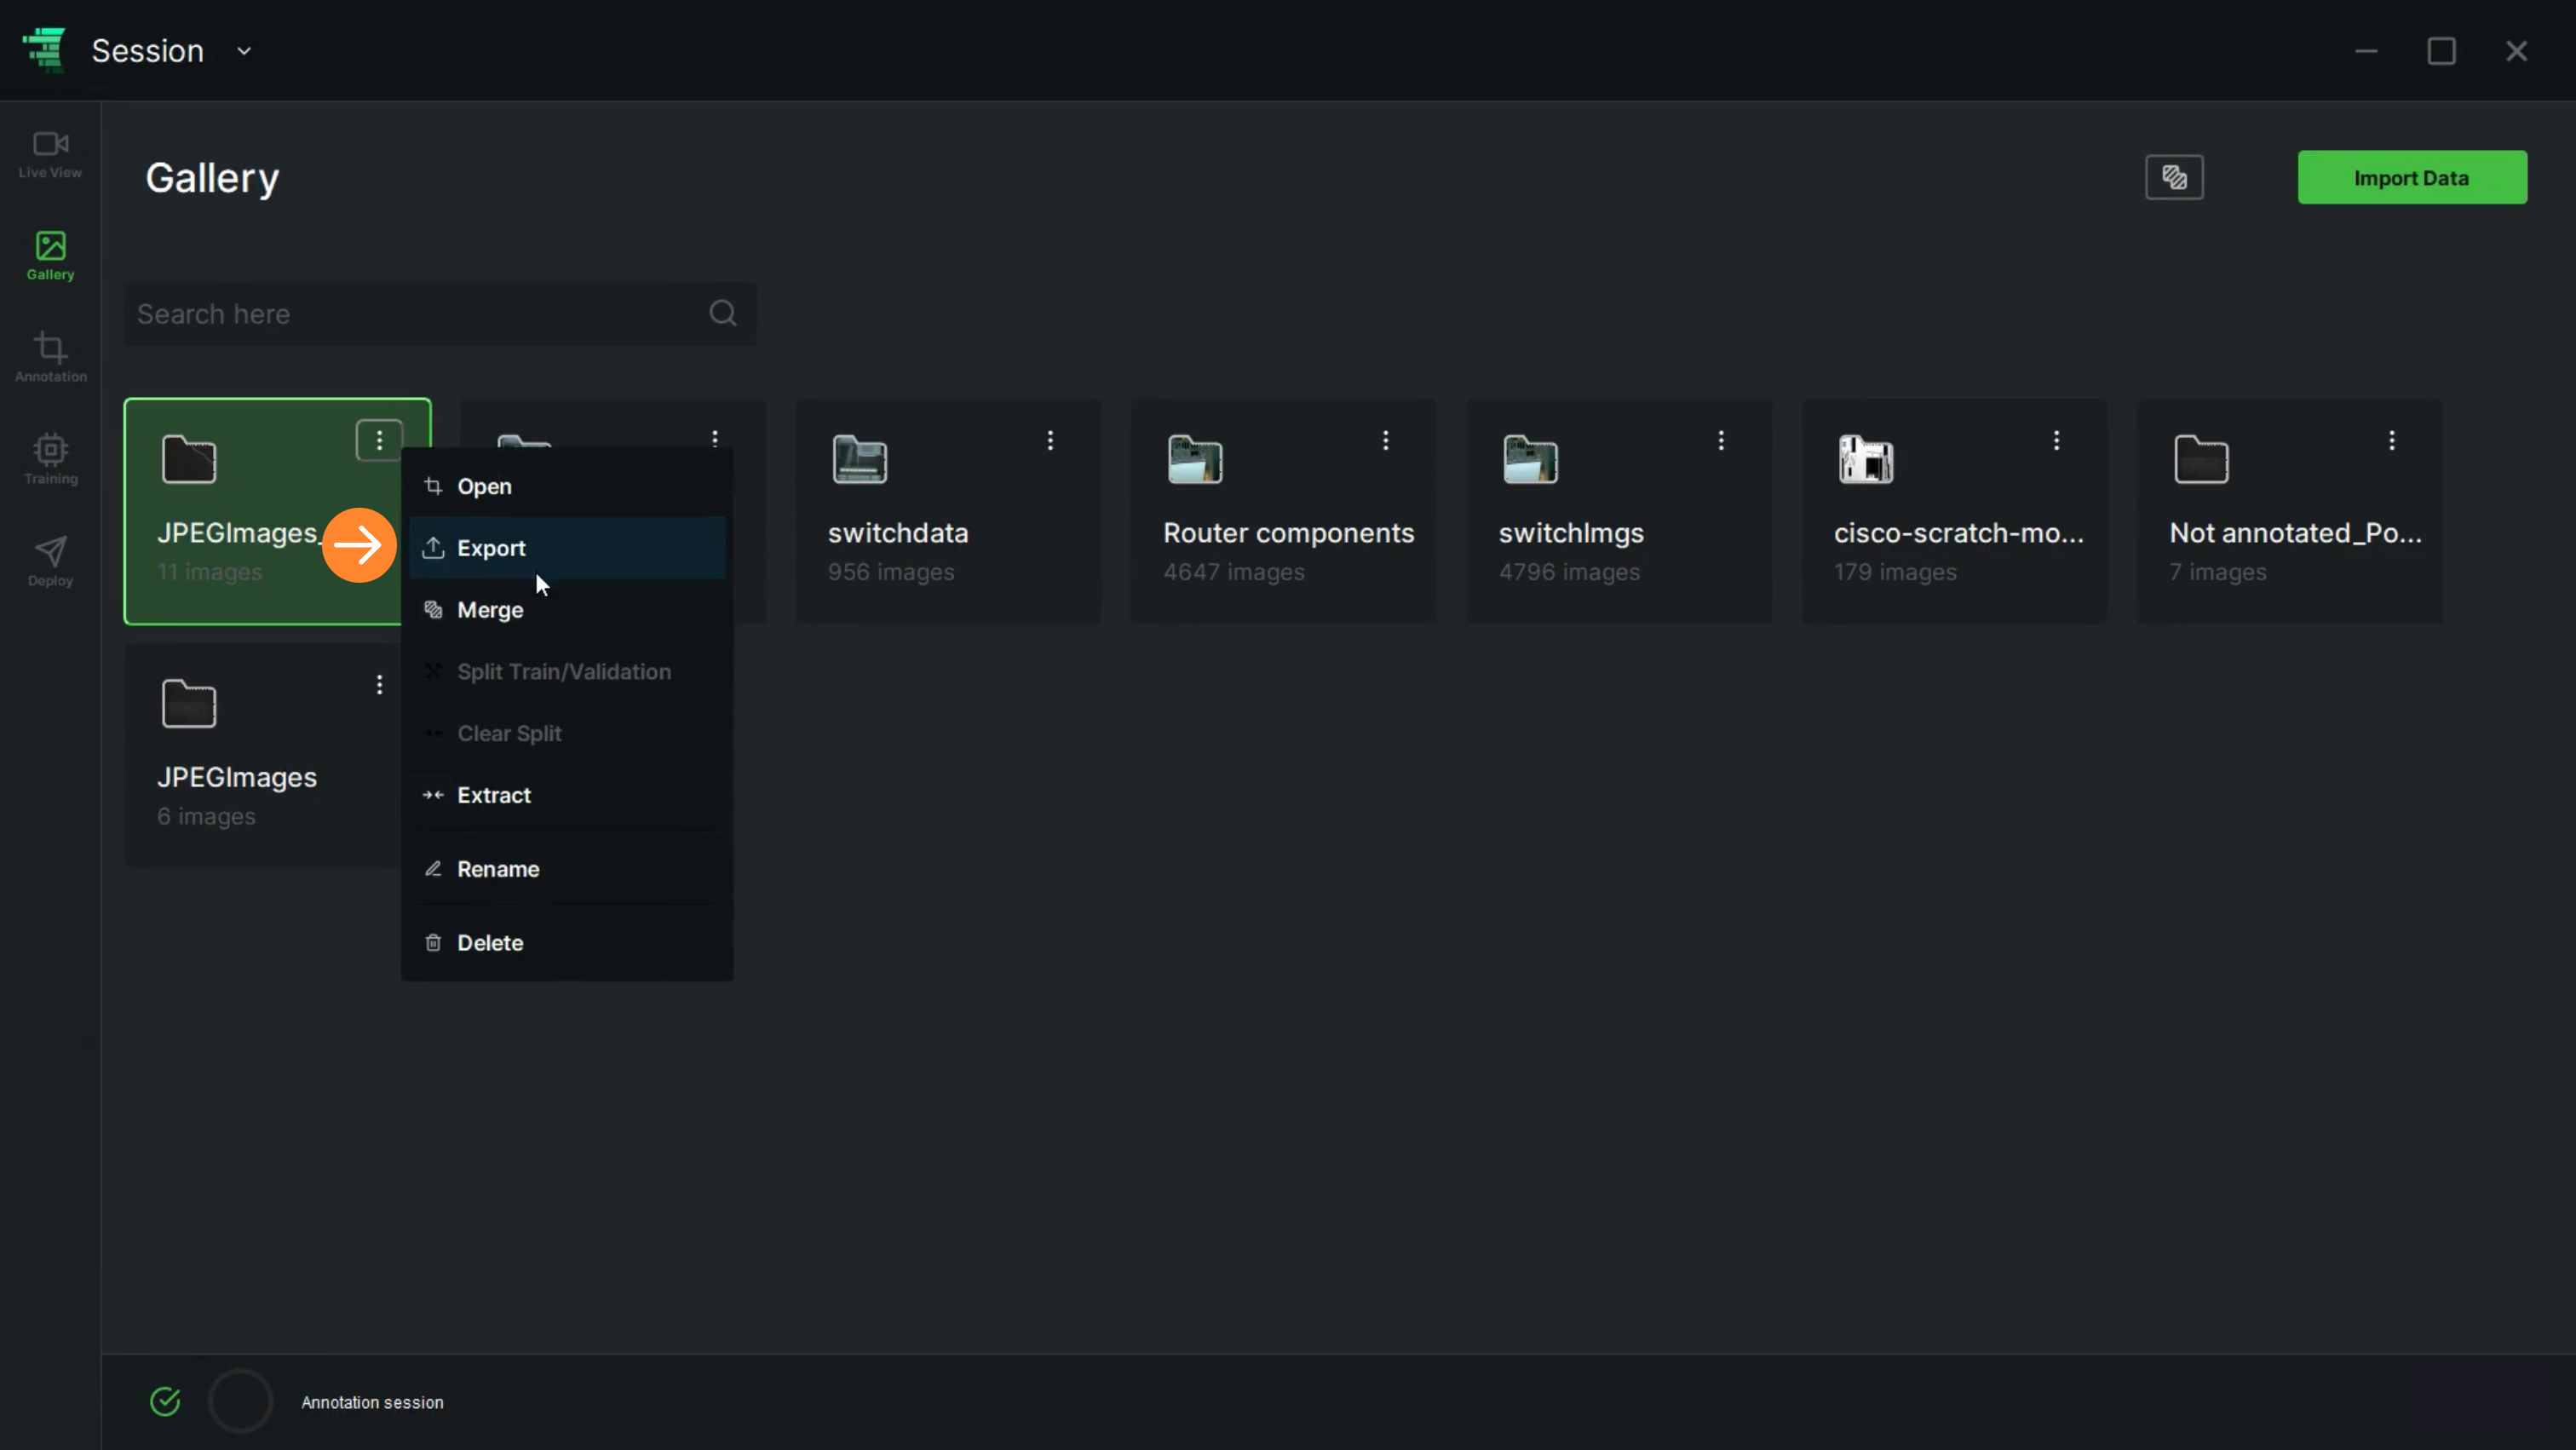
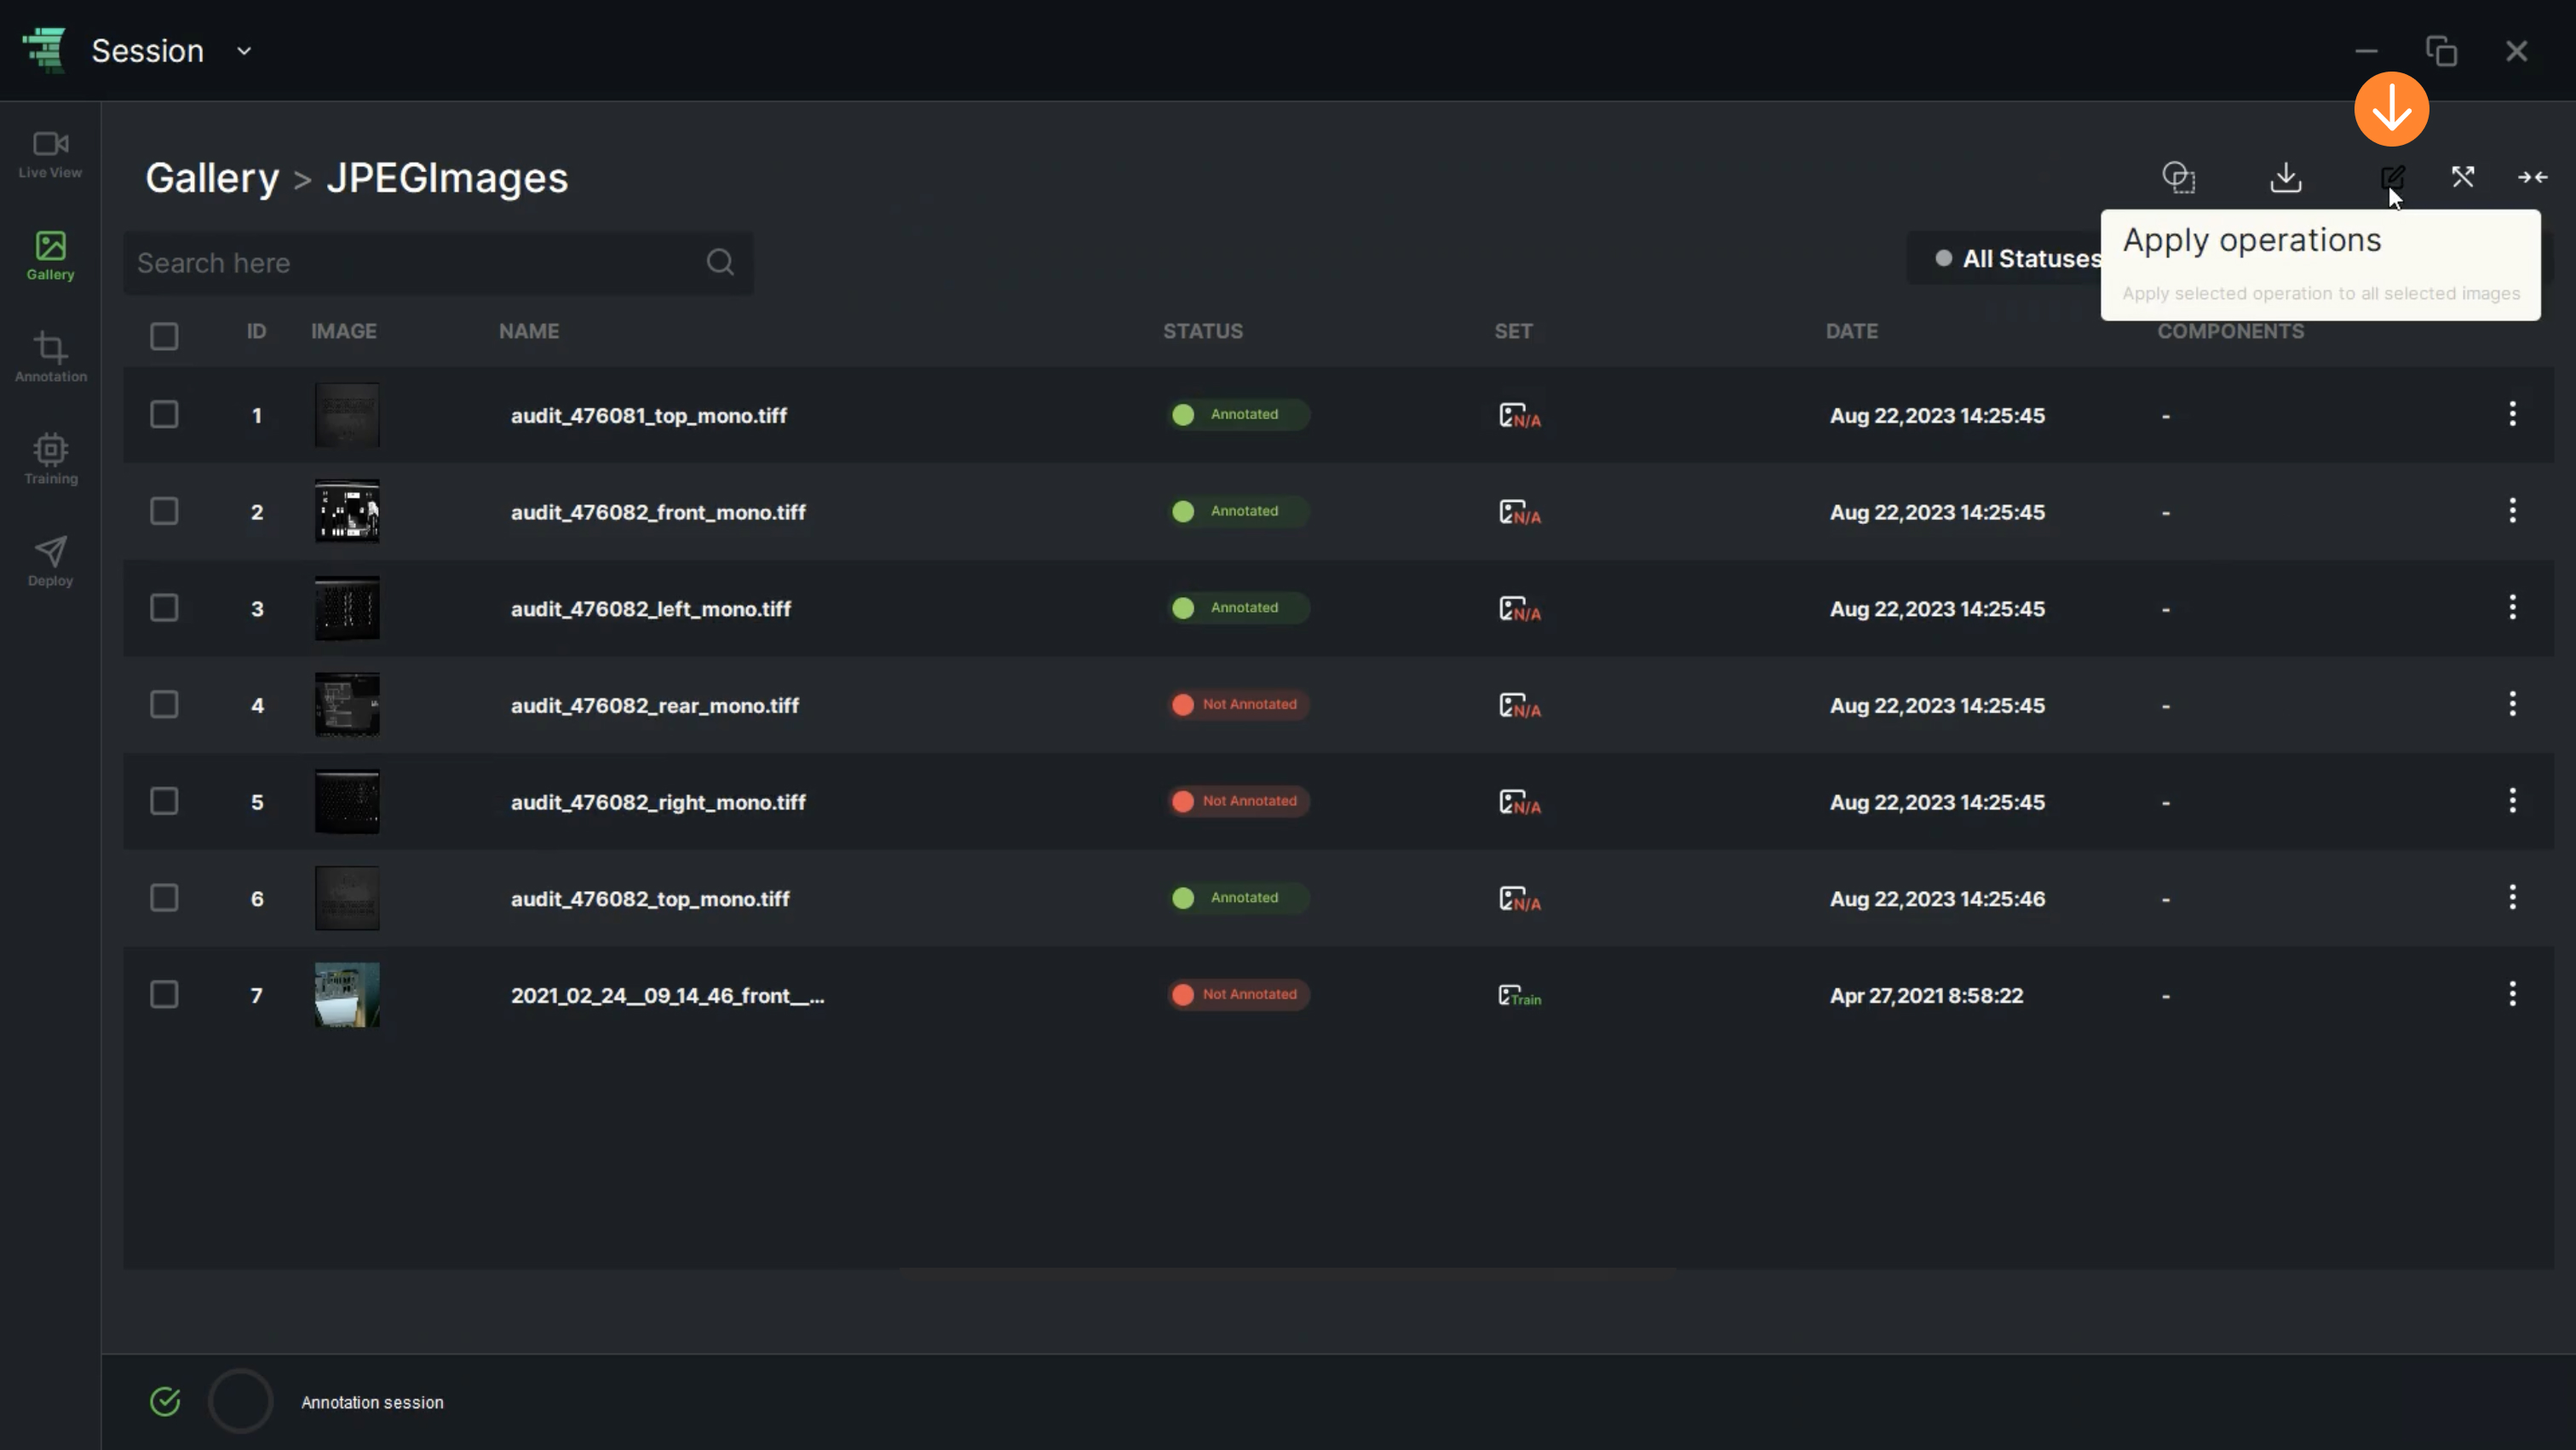
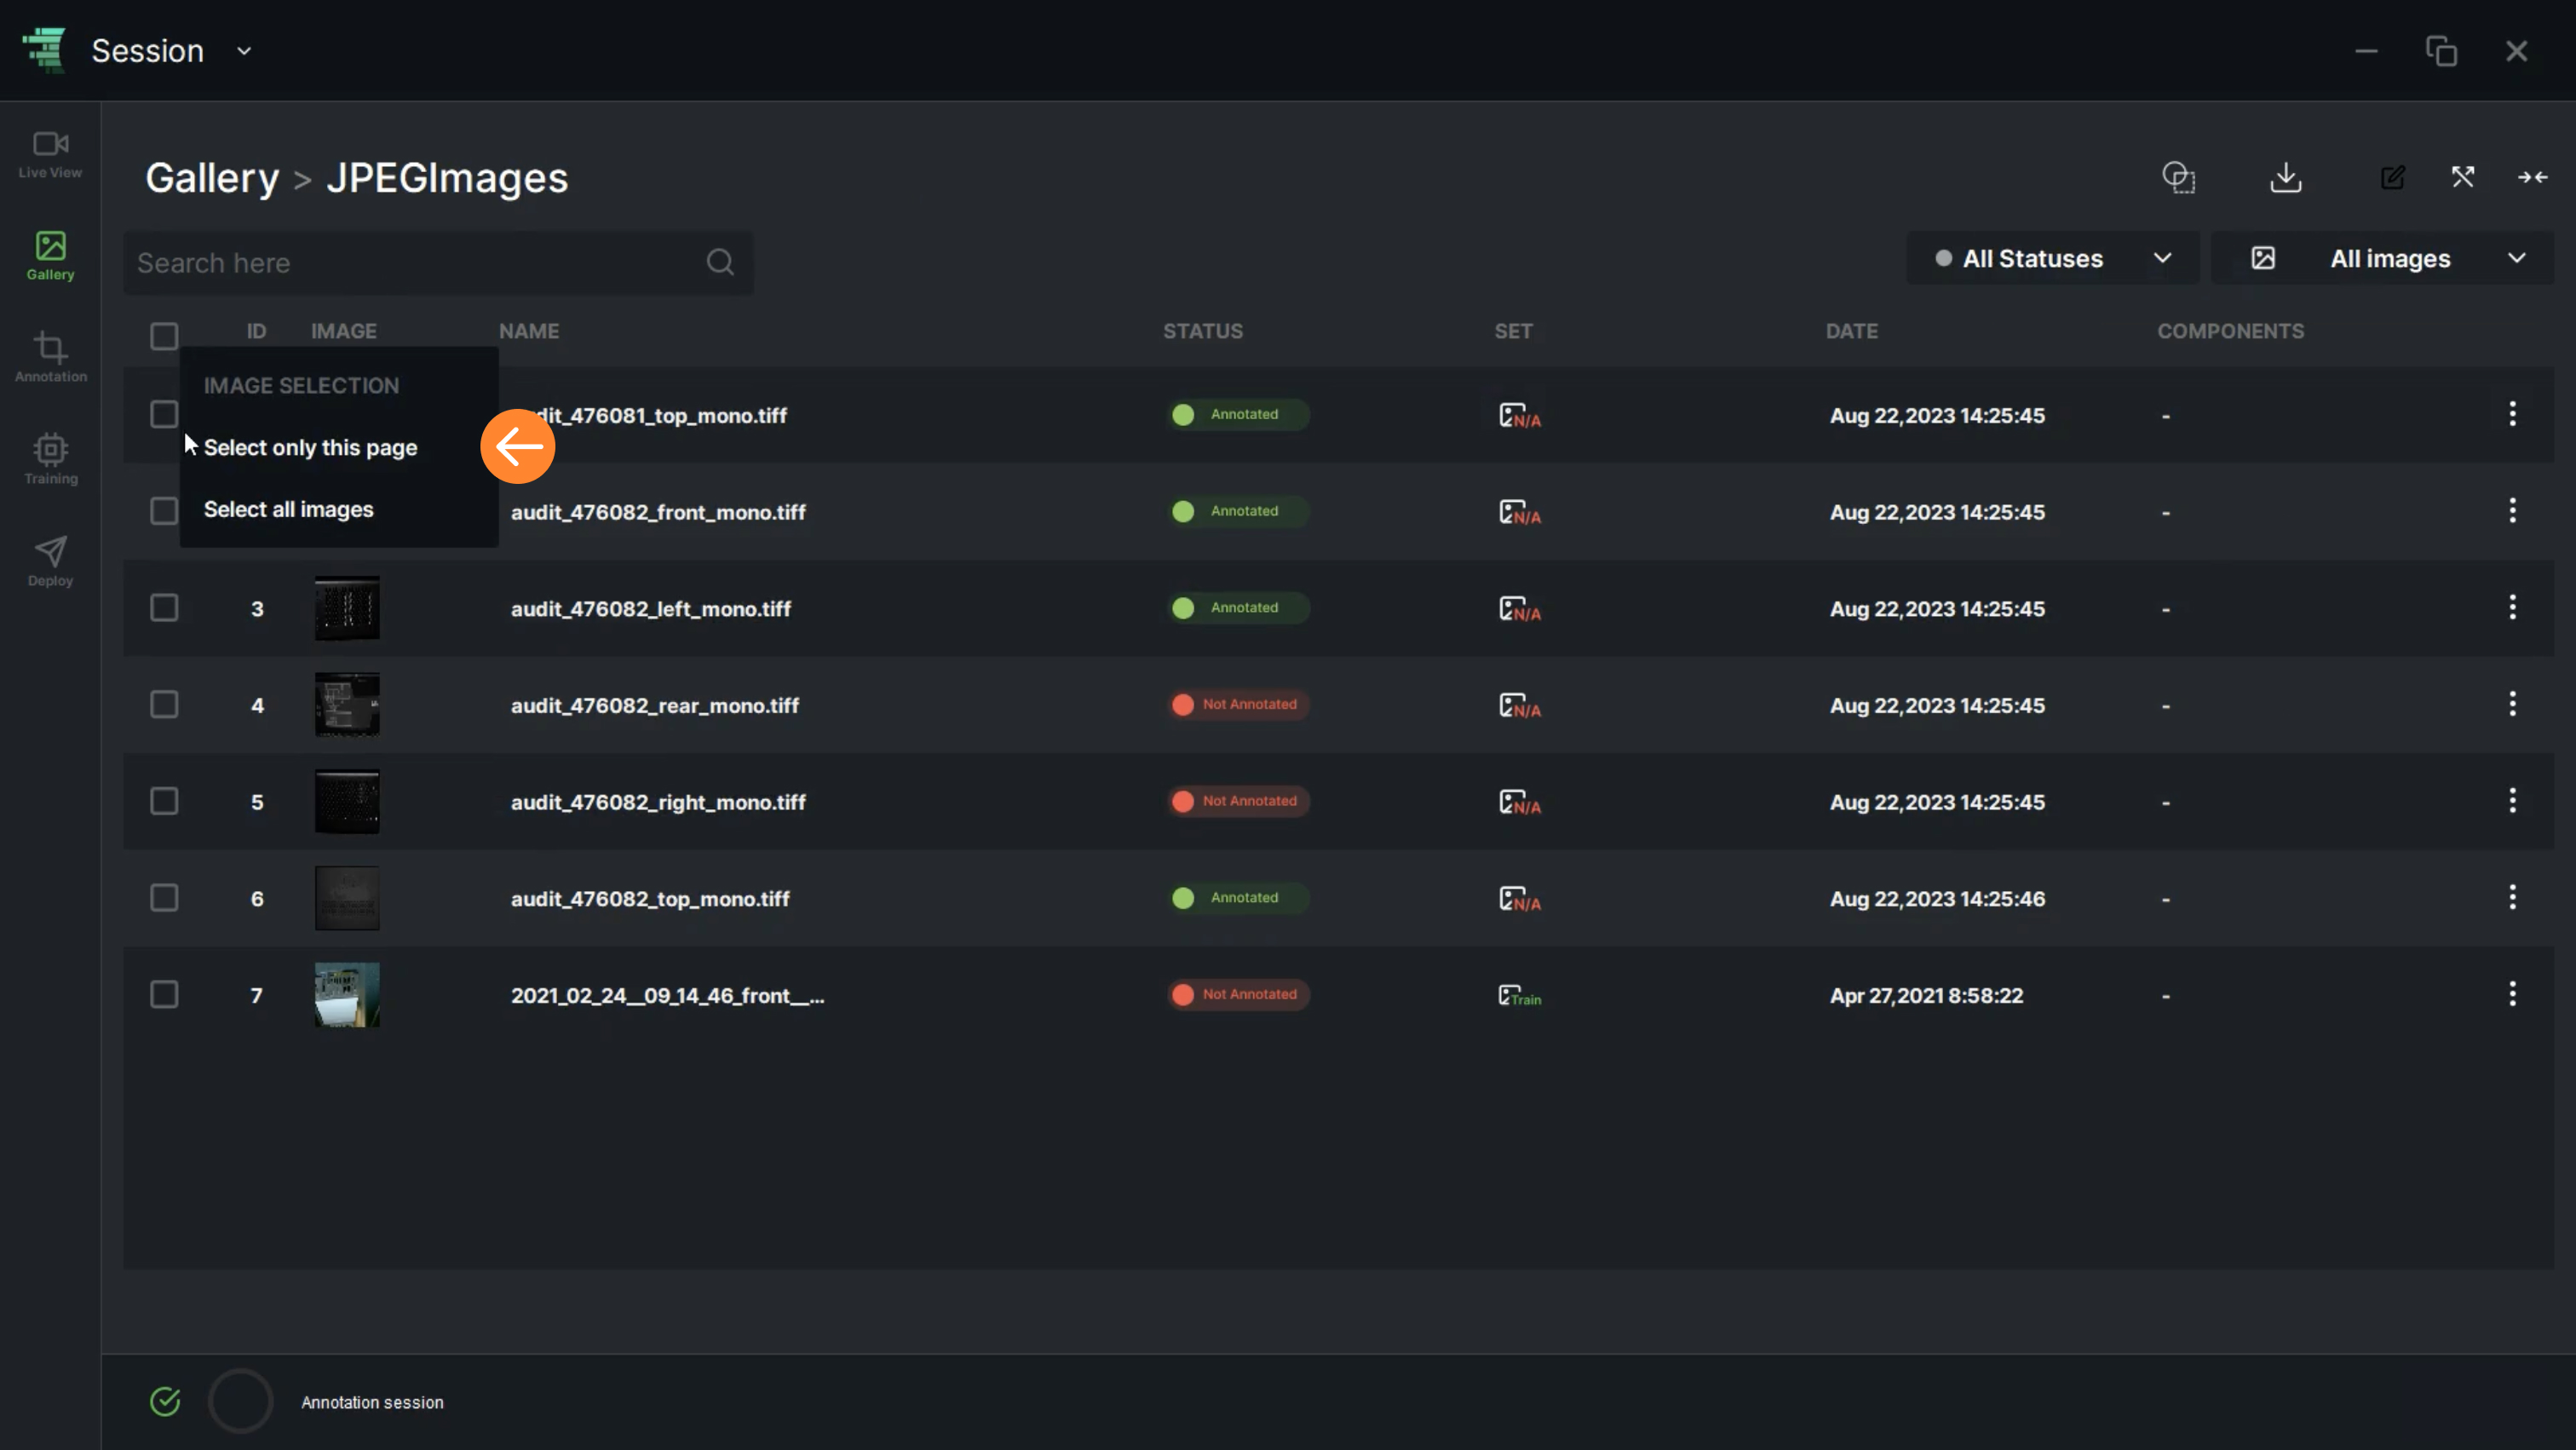
6. “Apply Operations” allows the user to perform multiple operations. To enable this function, the user should choose “Only this page” or “Select all images” option to select images

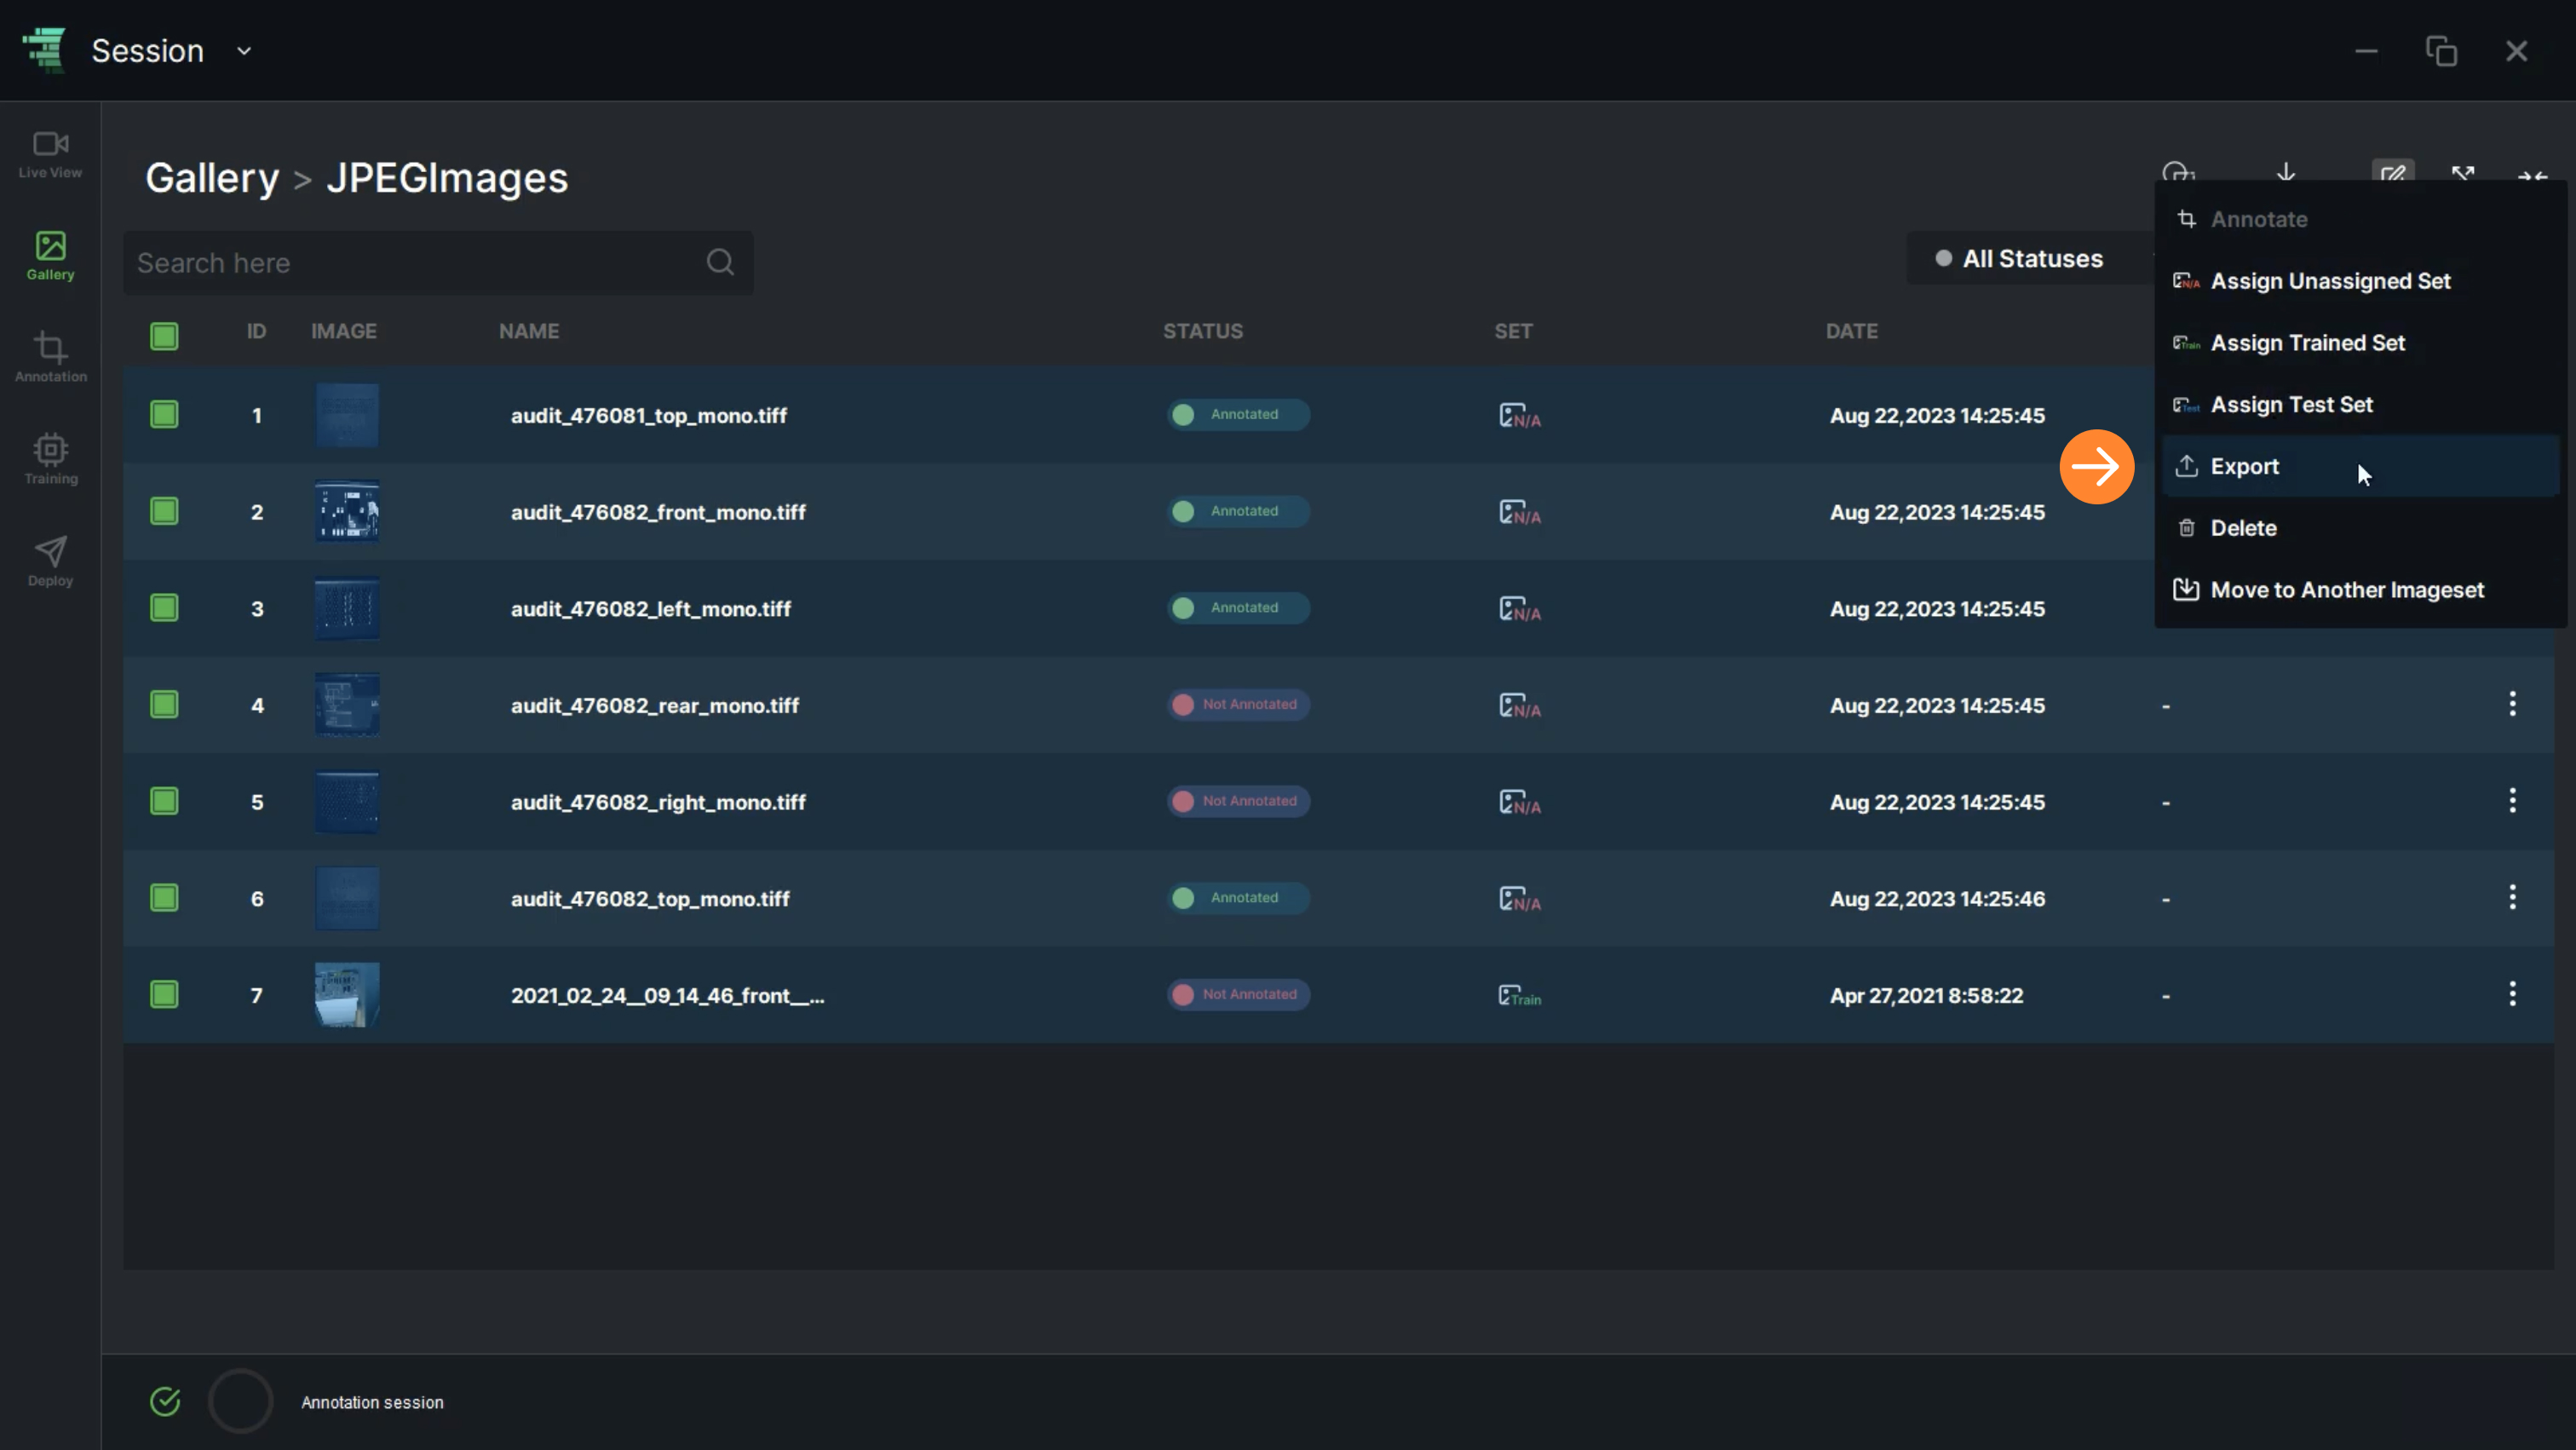
7. Once “Apply Operations” dialog box is displayed, the user can:

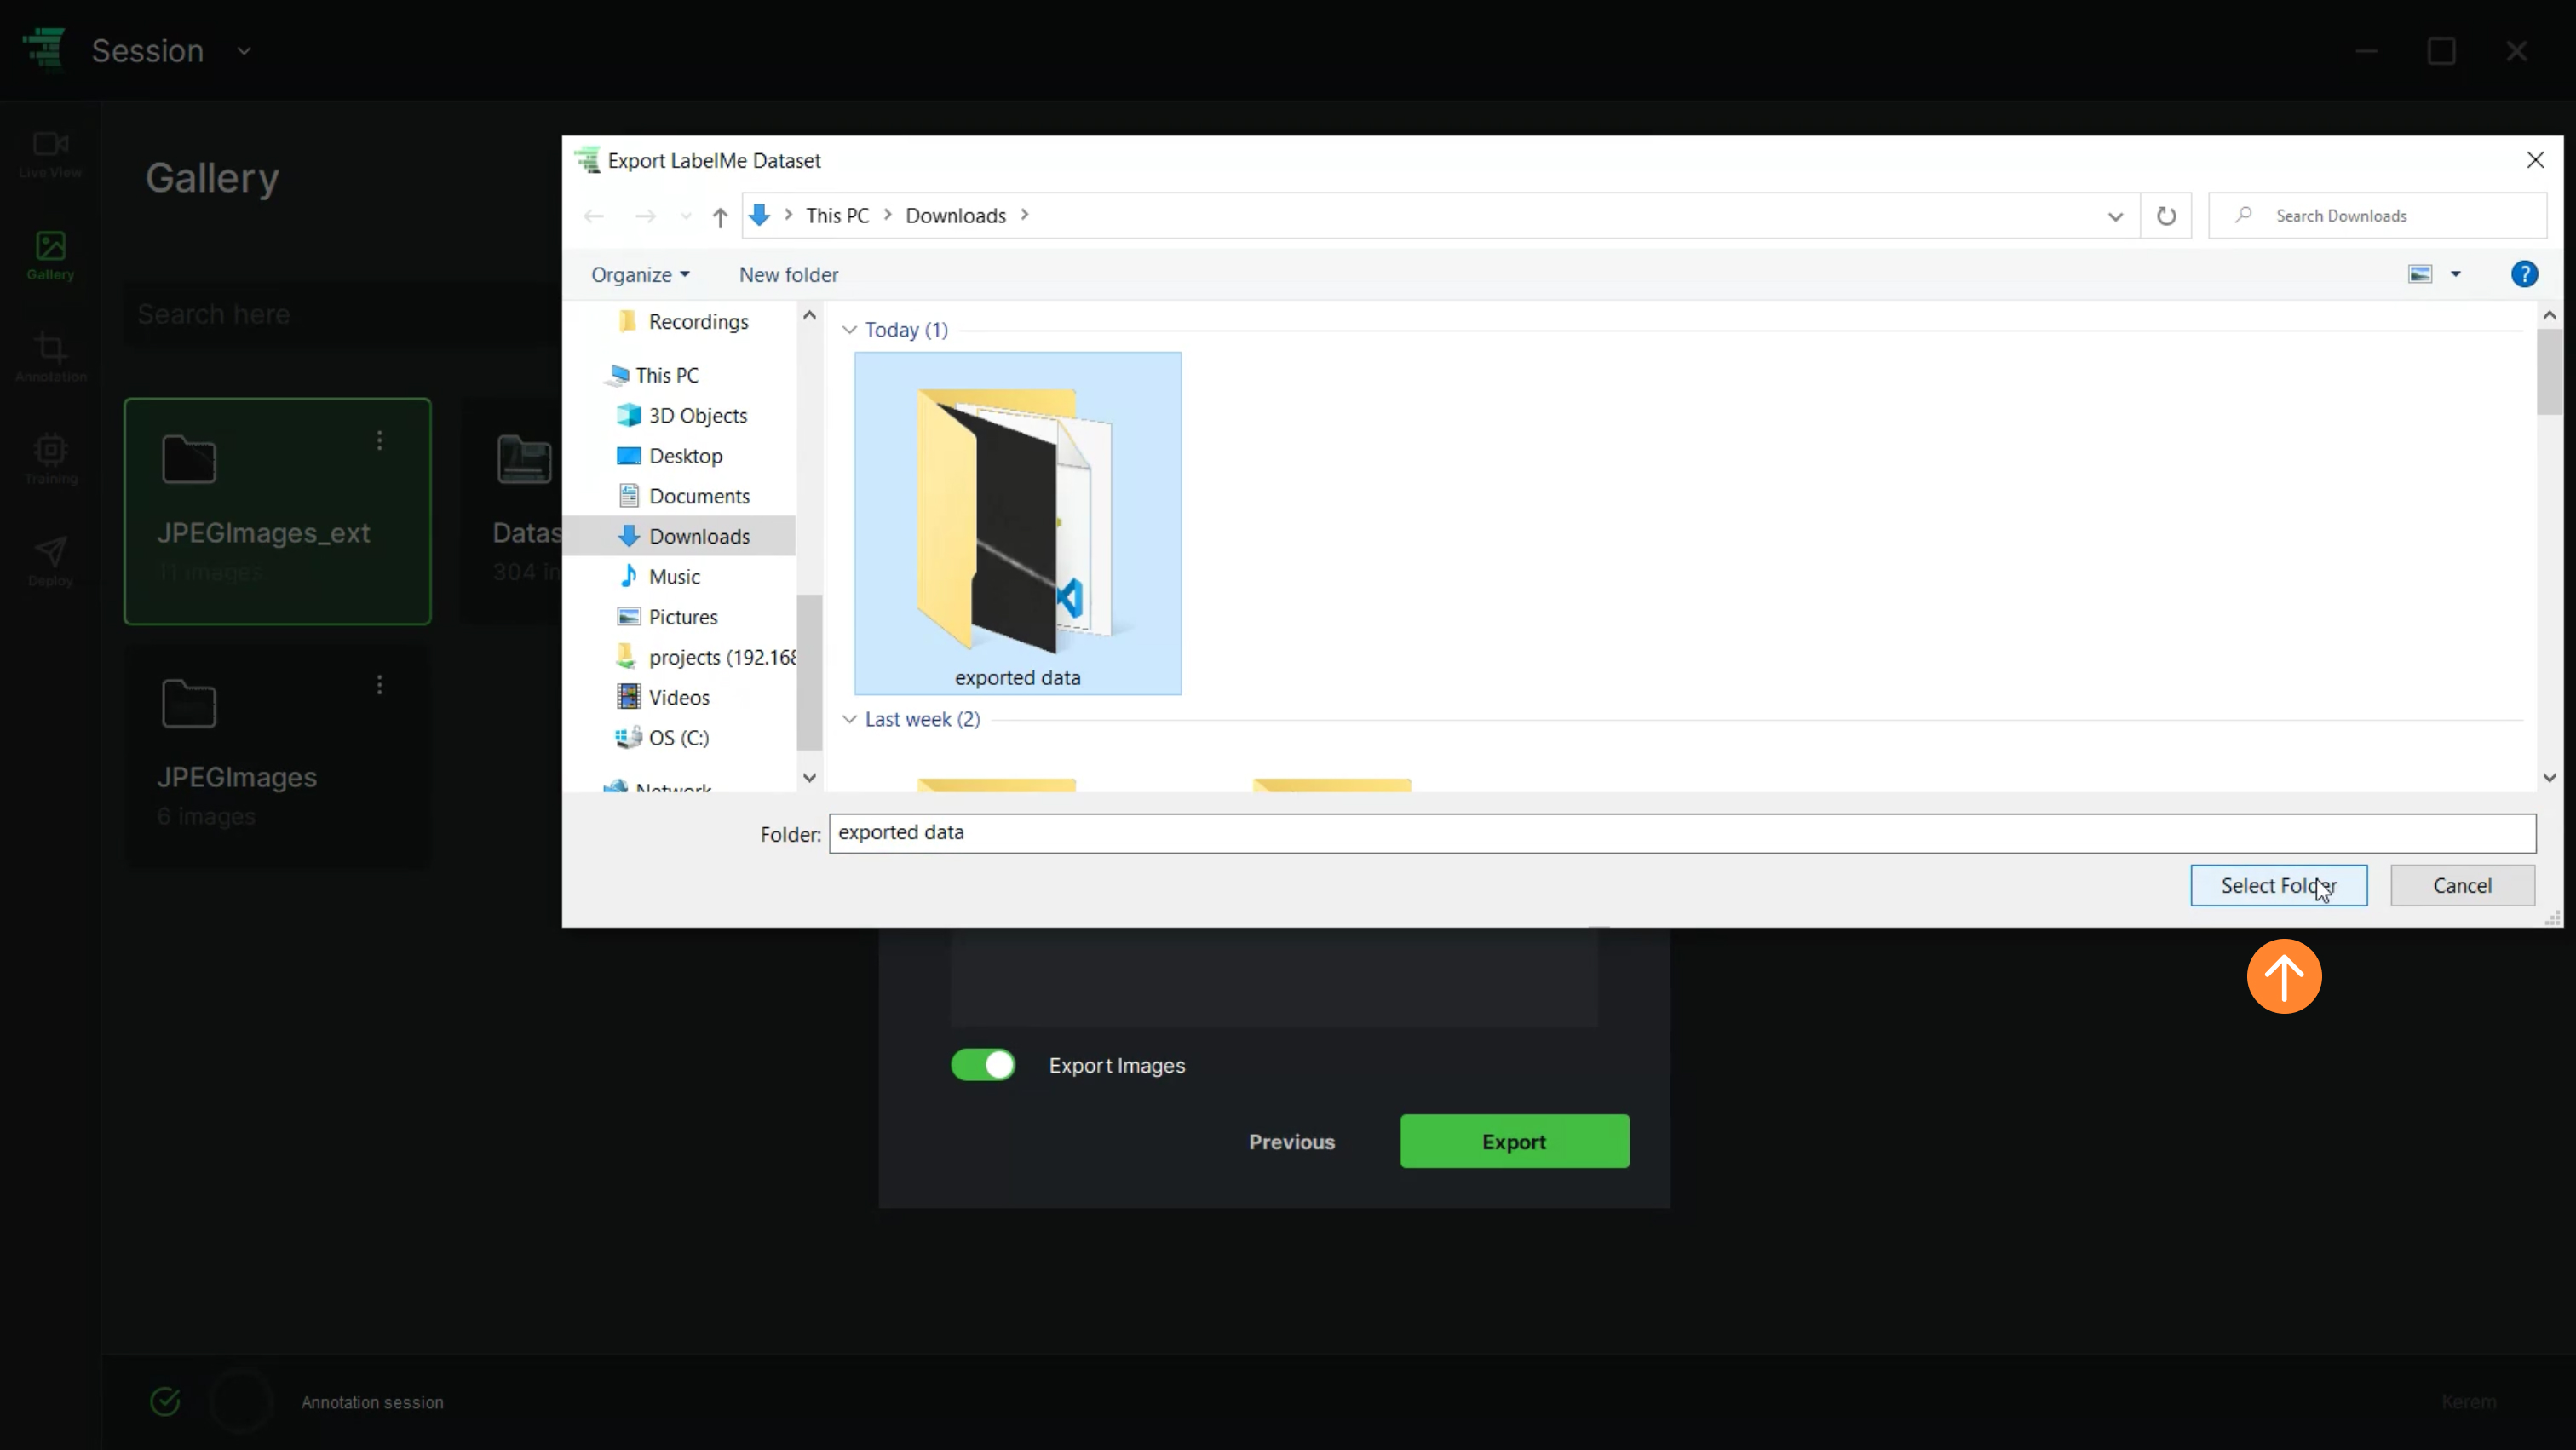
  • Export or Delete images by clicking on these selections
  • Move images to another dataset by selecting Move to Another Imageset

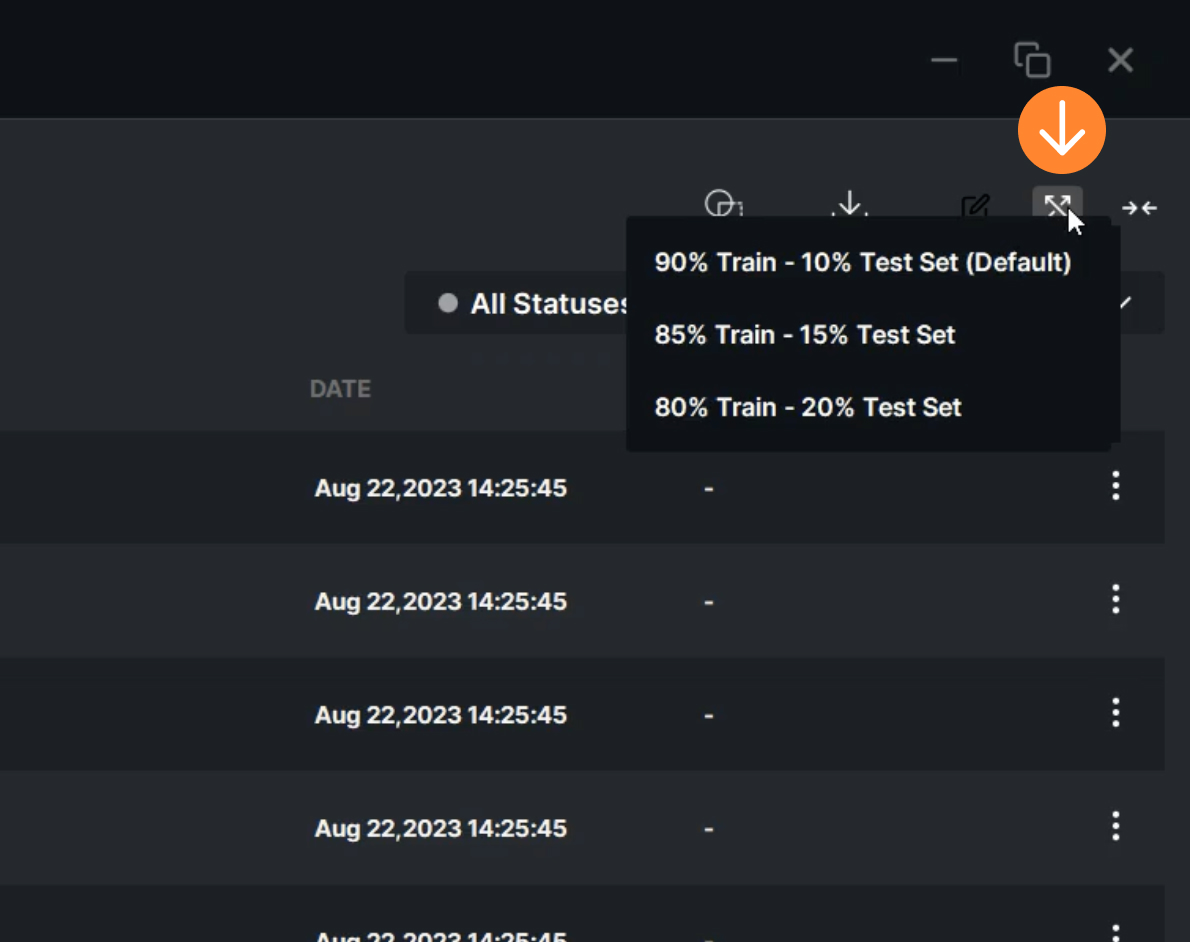
8. “Split Images” allows the user to split images before the training as Train/Test Sets with three options

9. As the dataset is split, the image status will change from “Unassigned” to “Train/Test Sets”

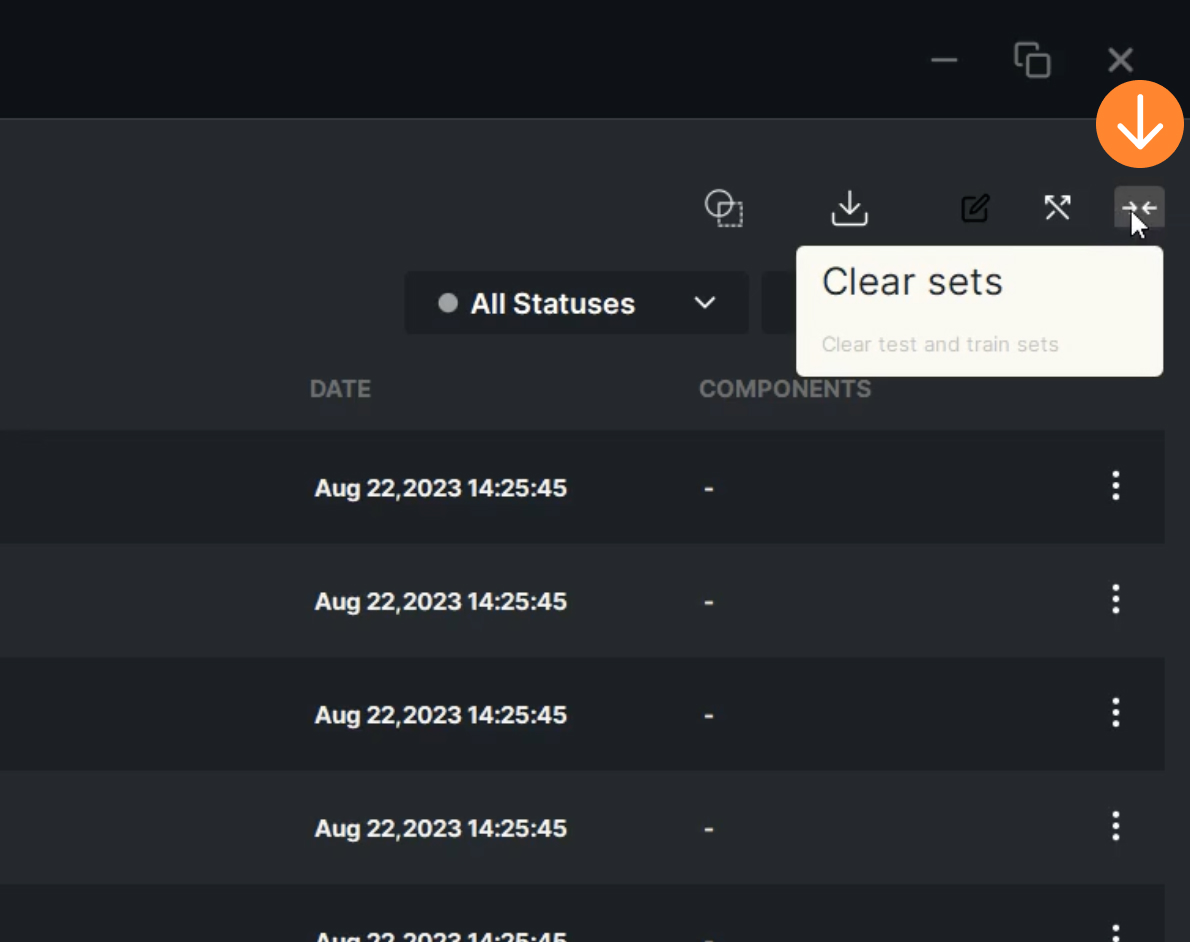
10. “Clear Sets” allows the user to clear all the current statuses. The new status of images will change to Unassigned Set

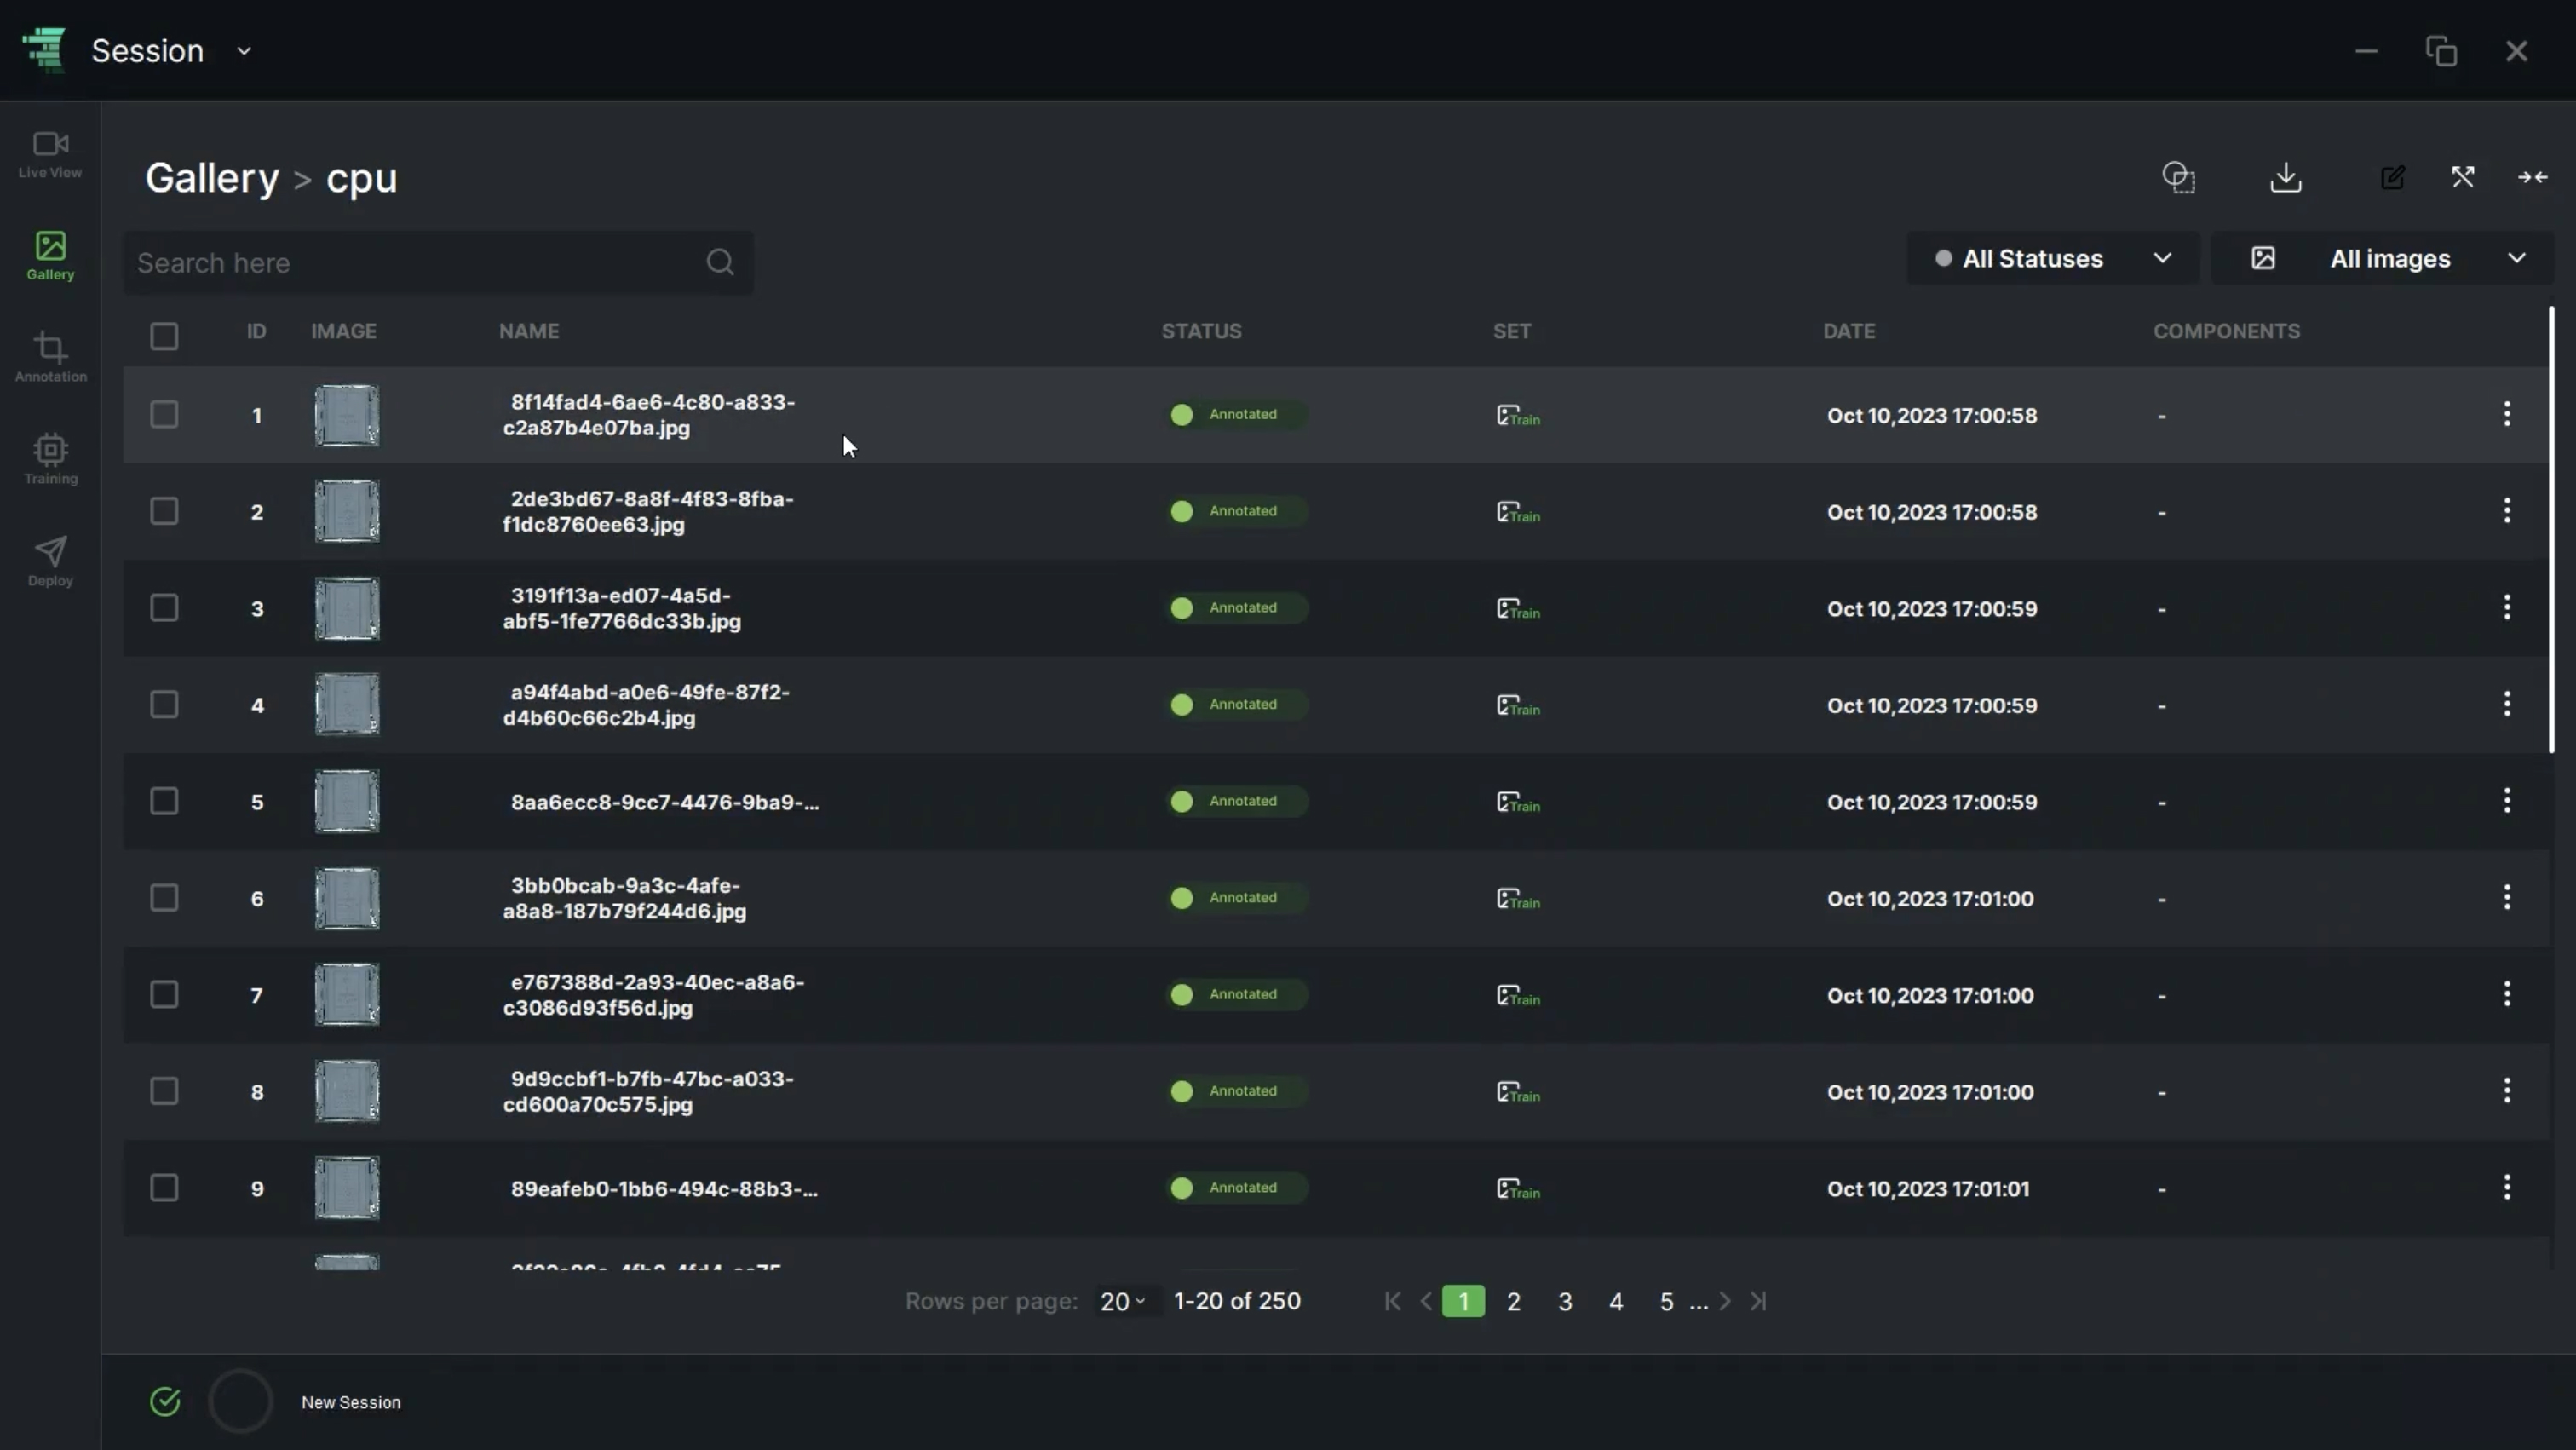
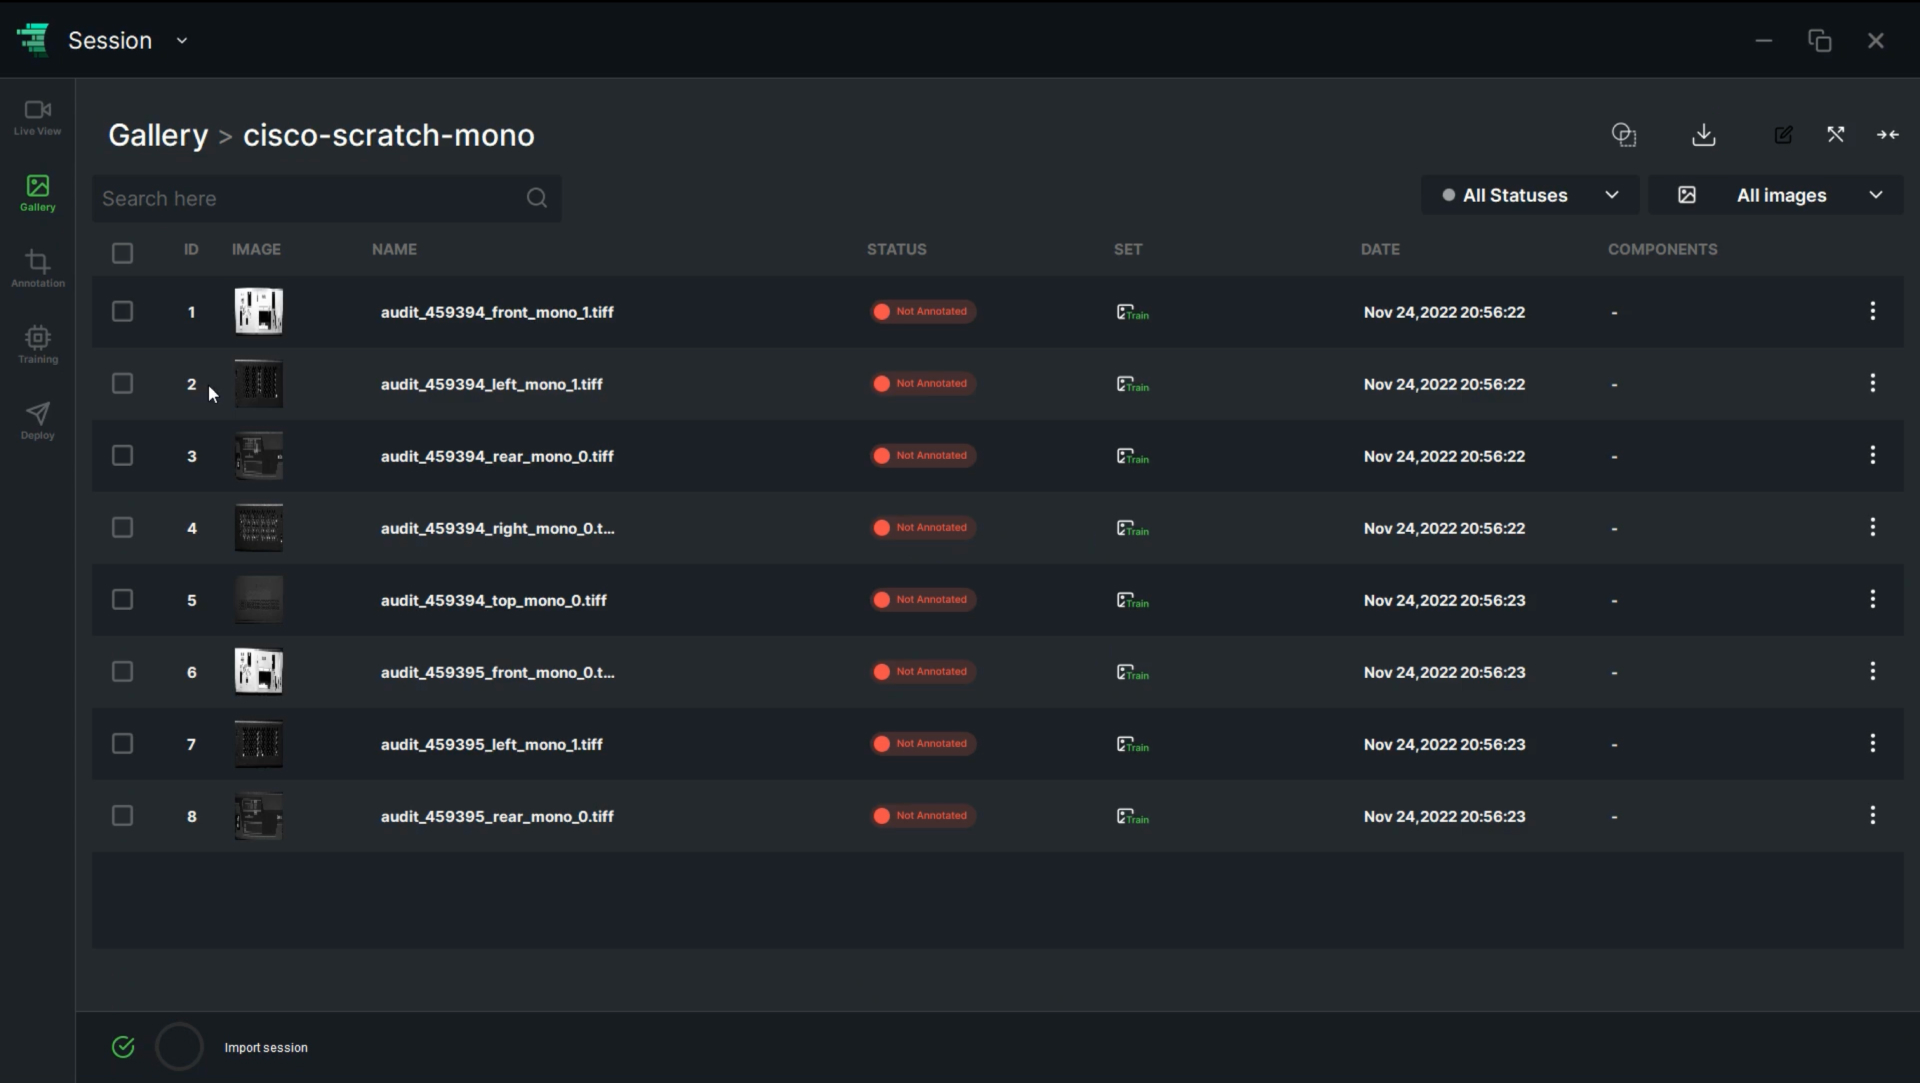
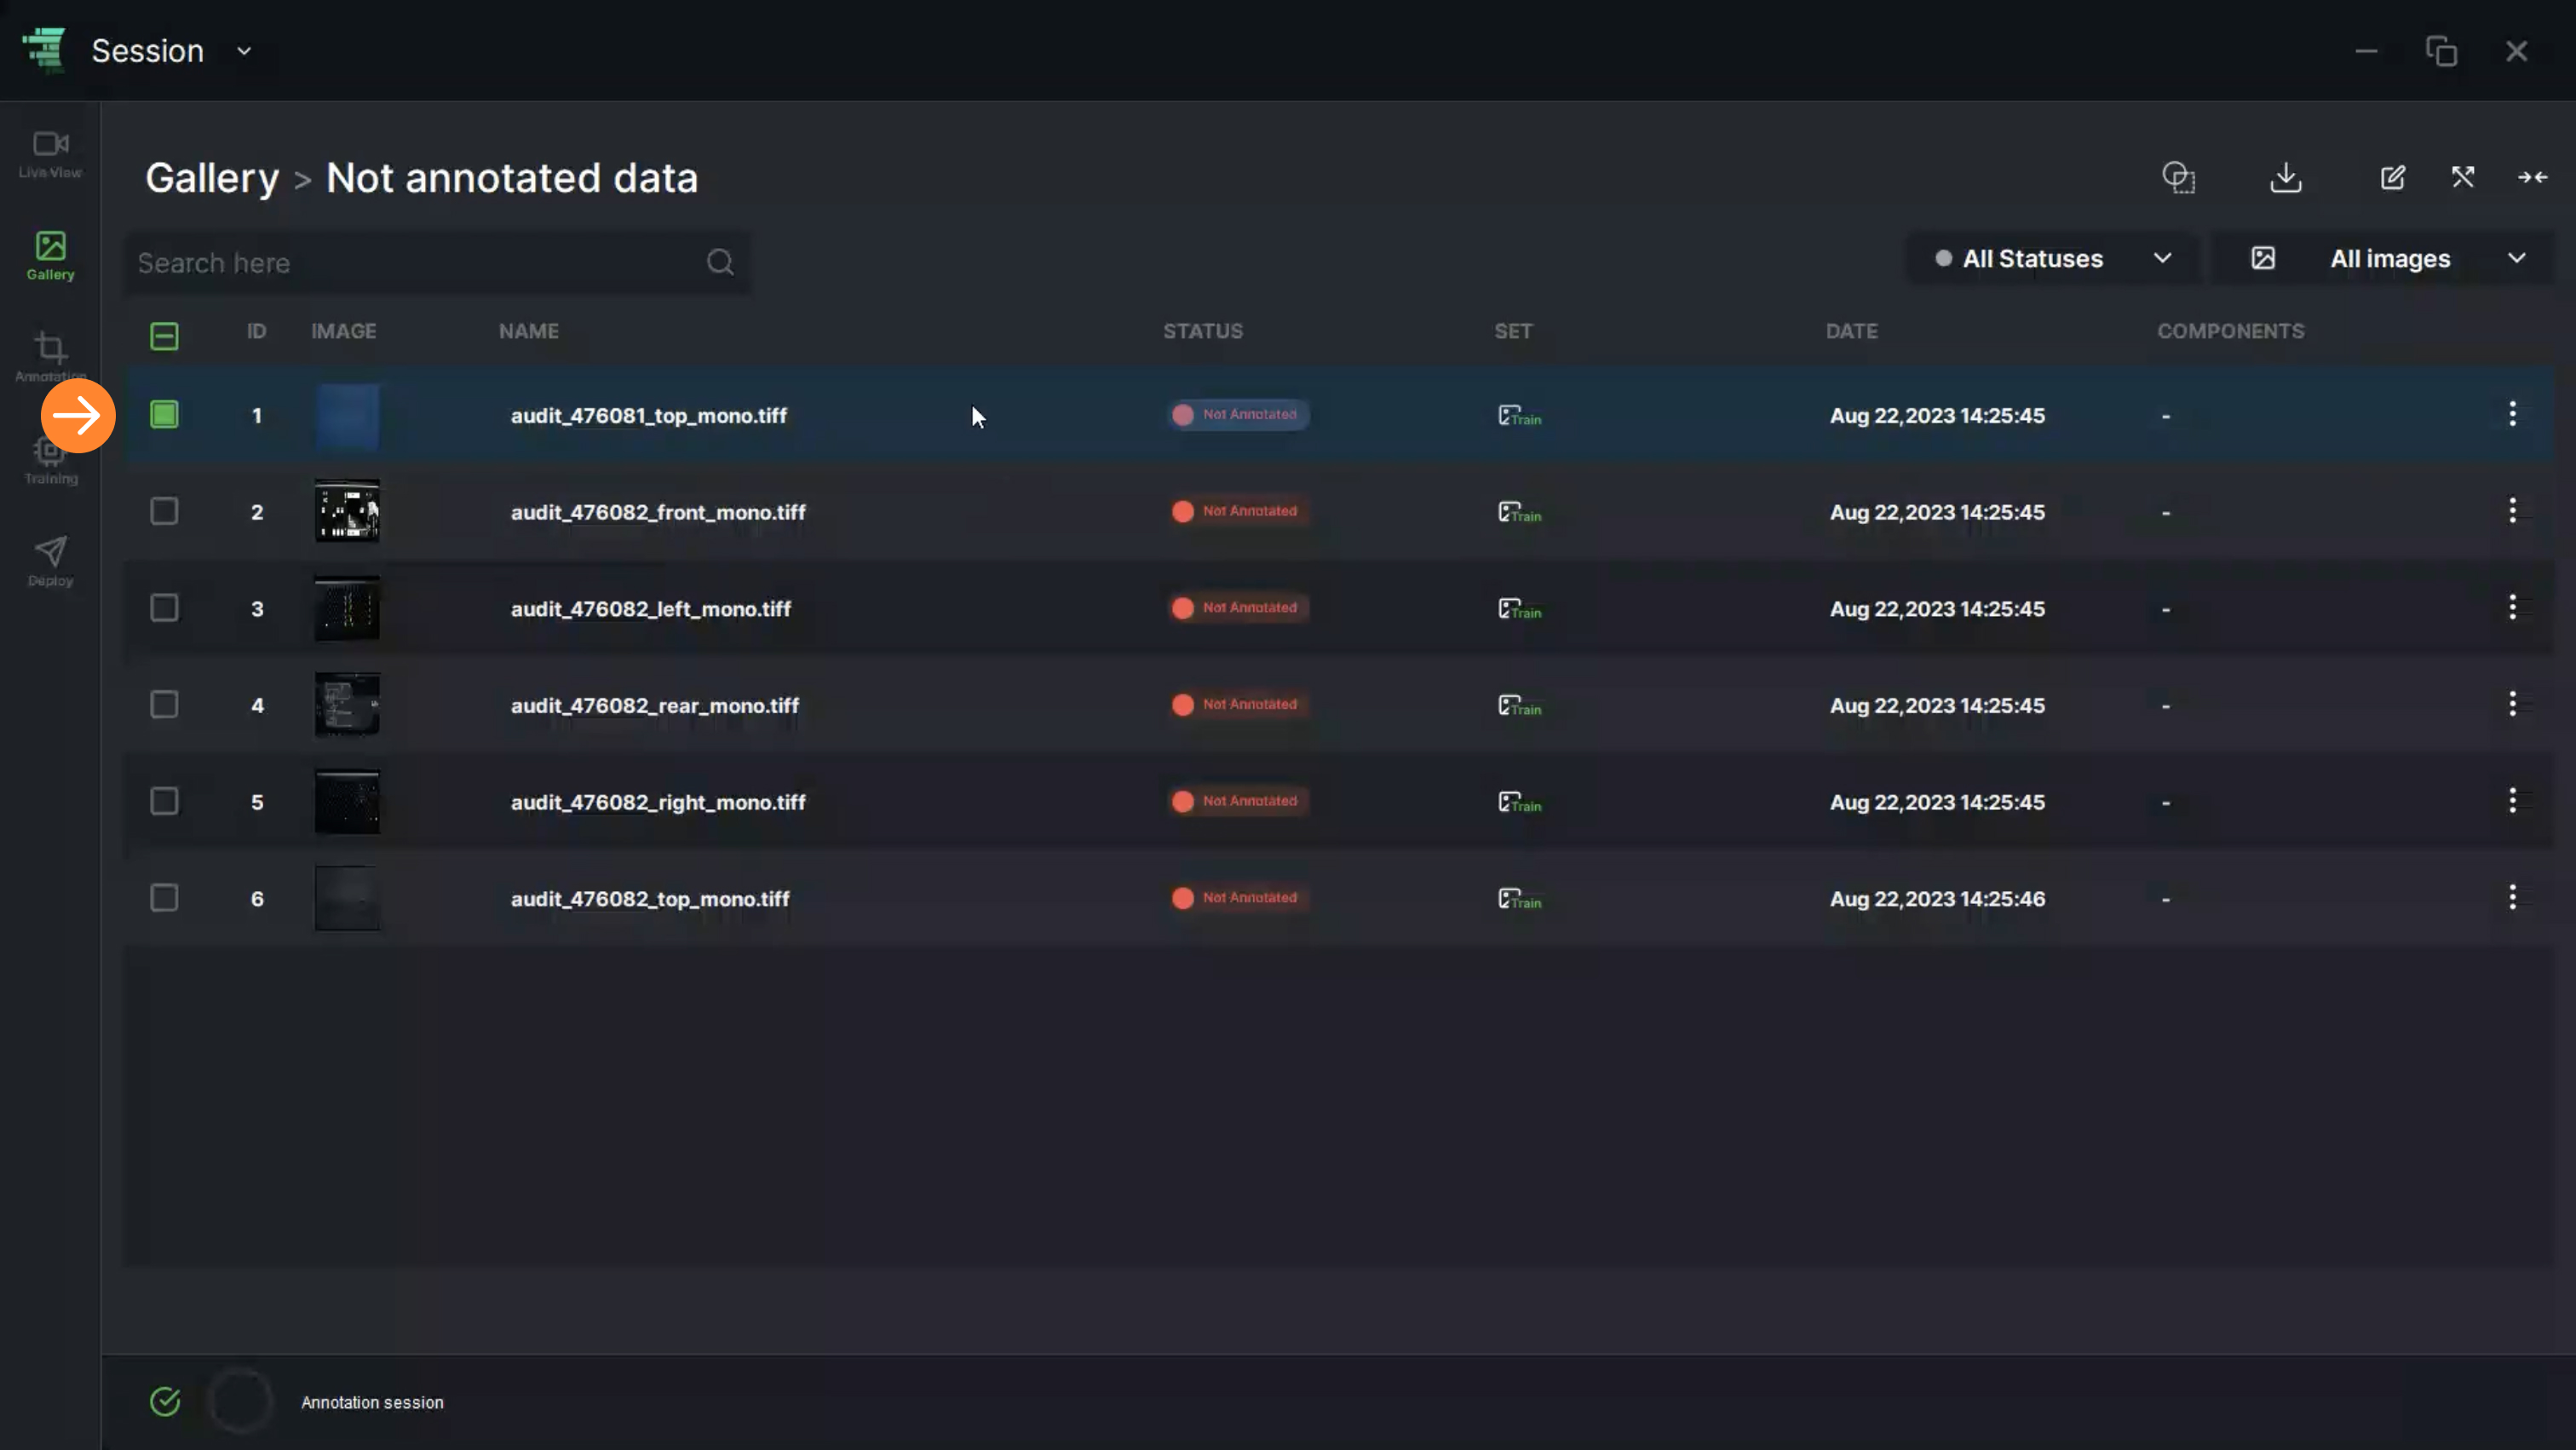
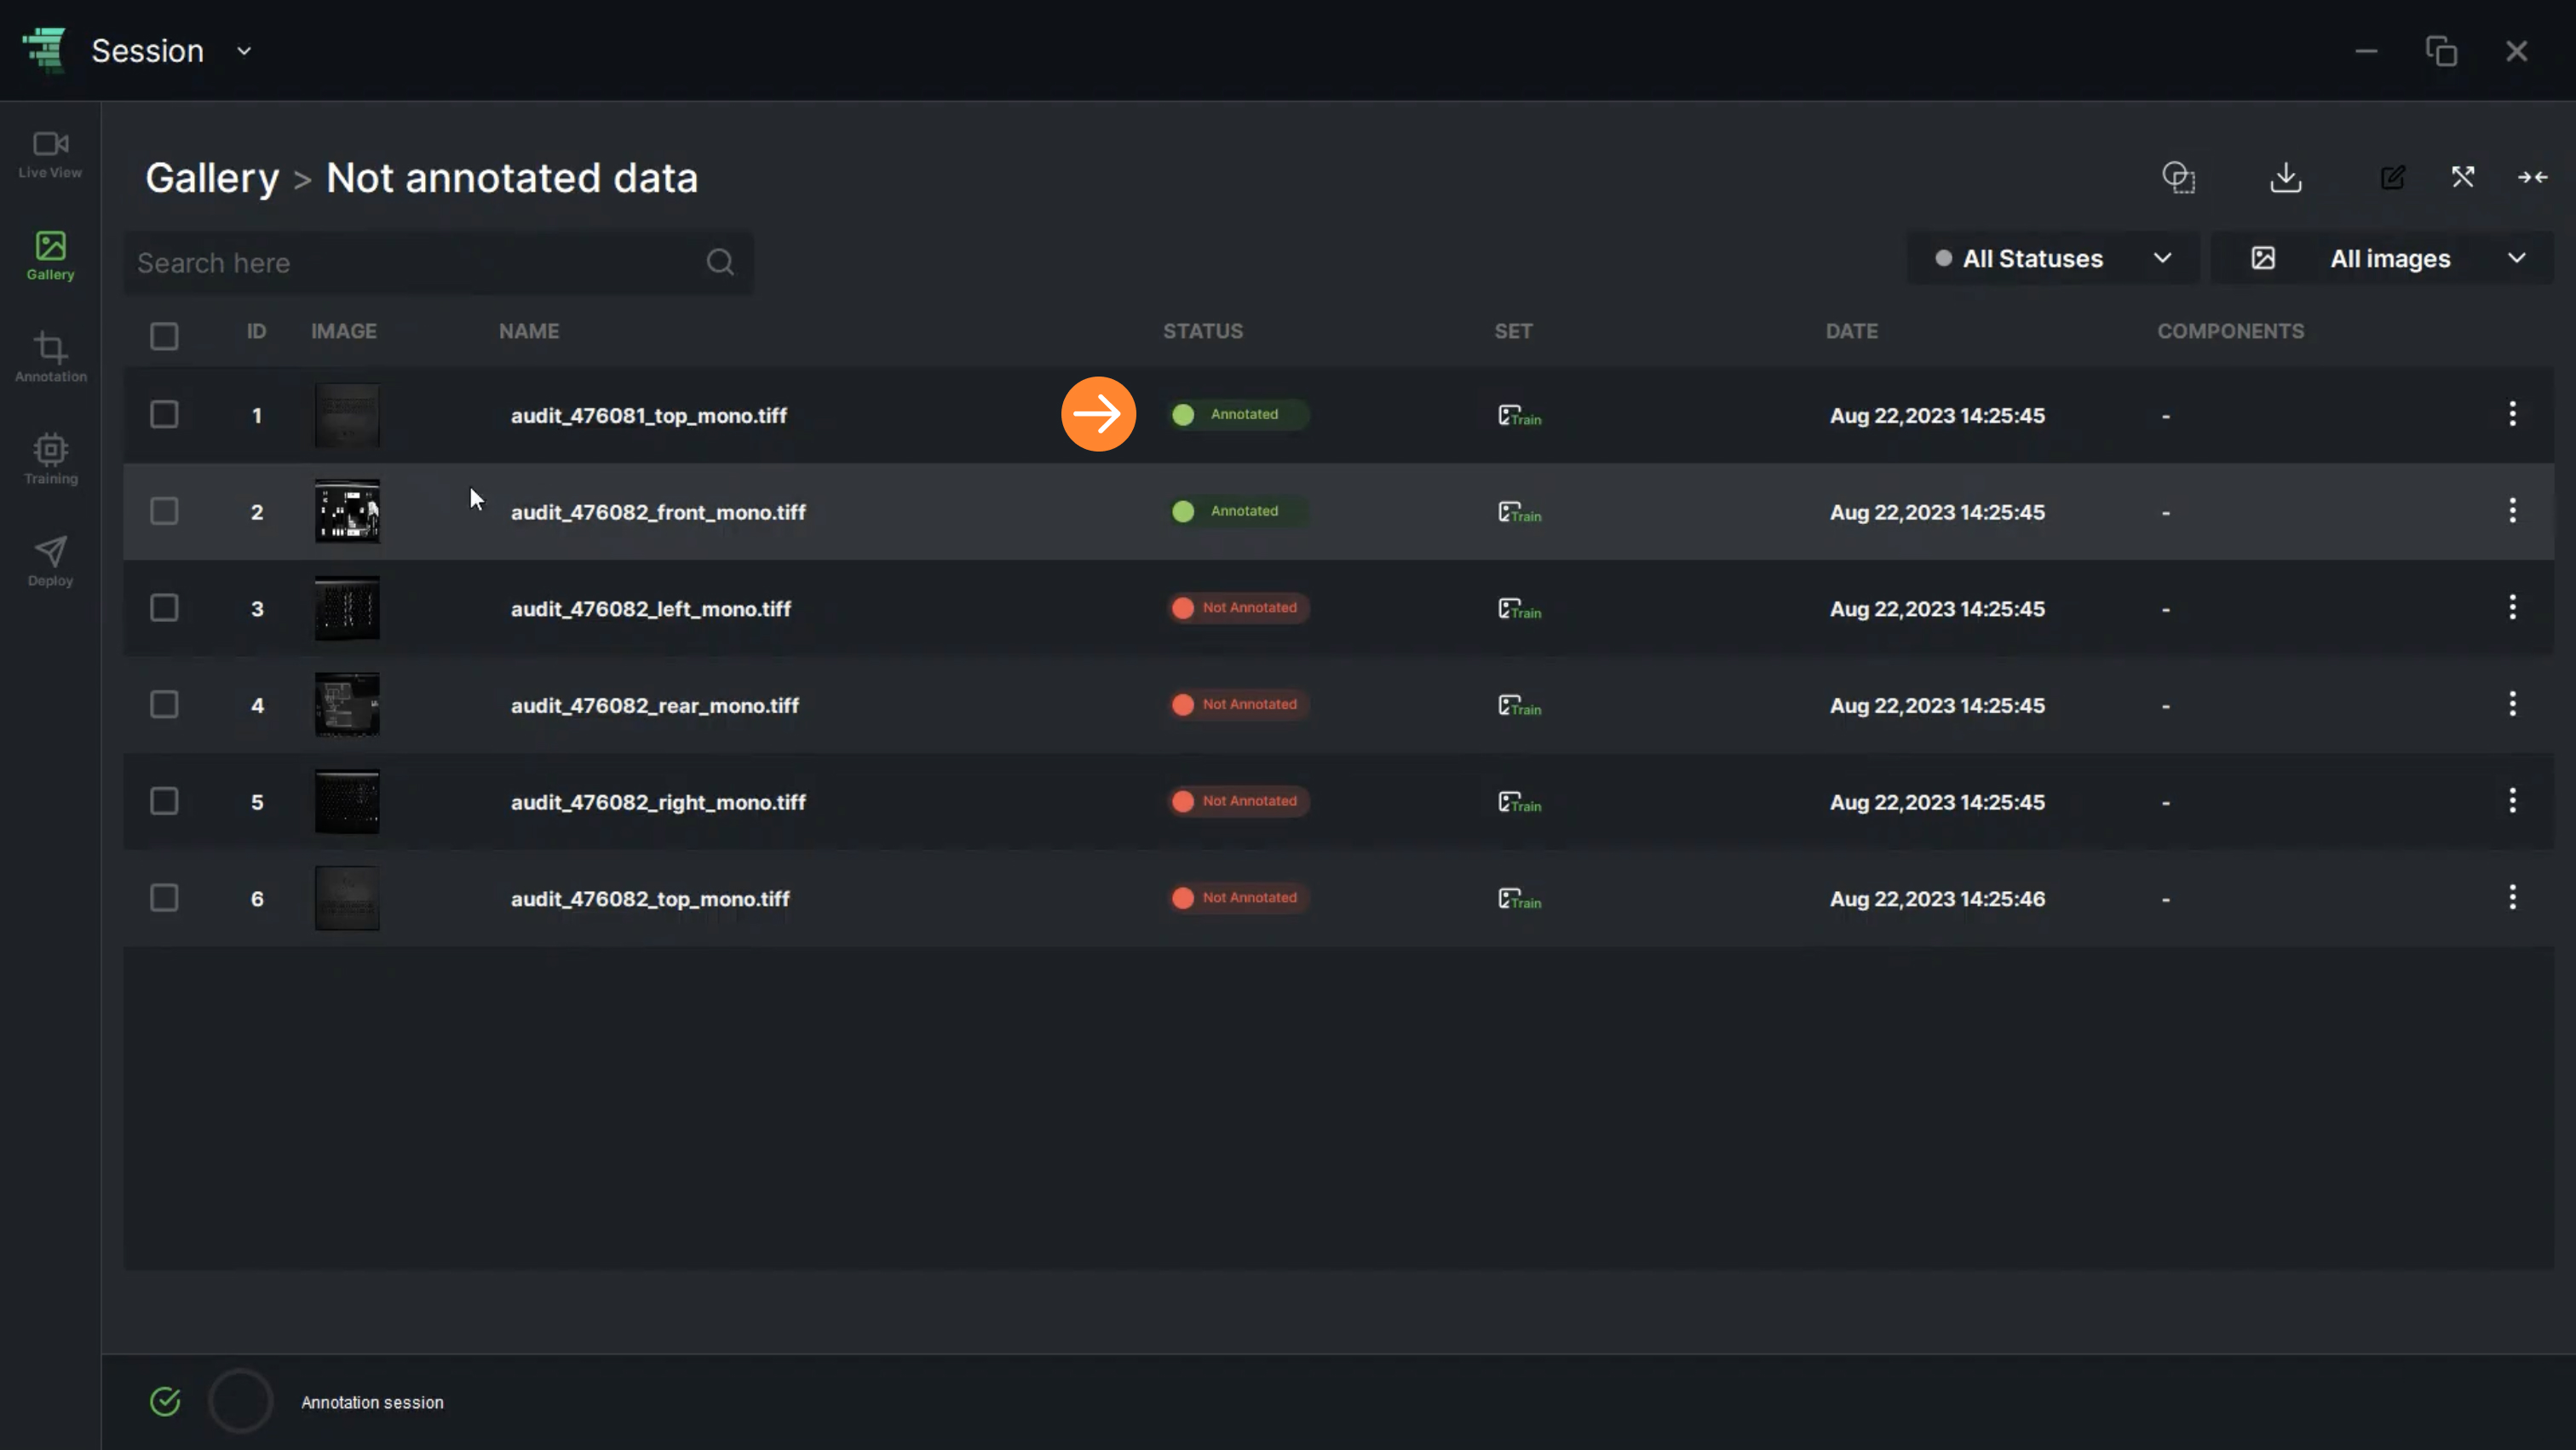
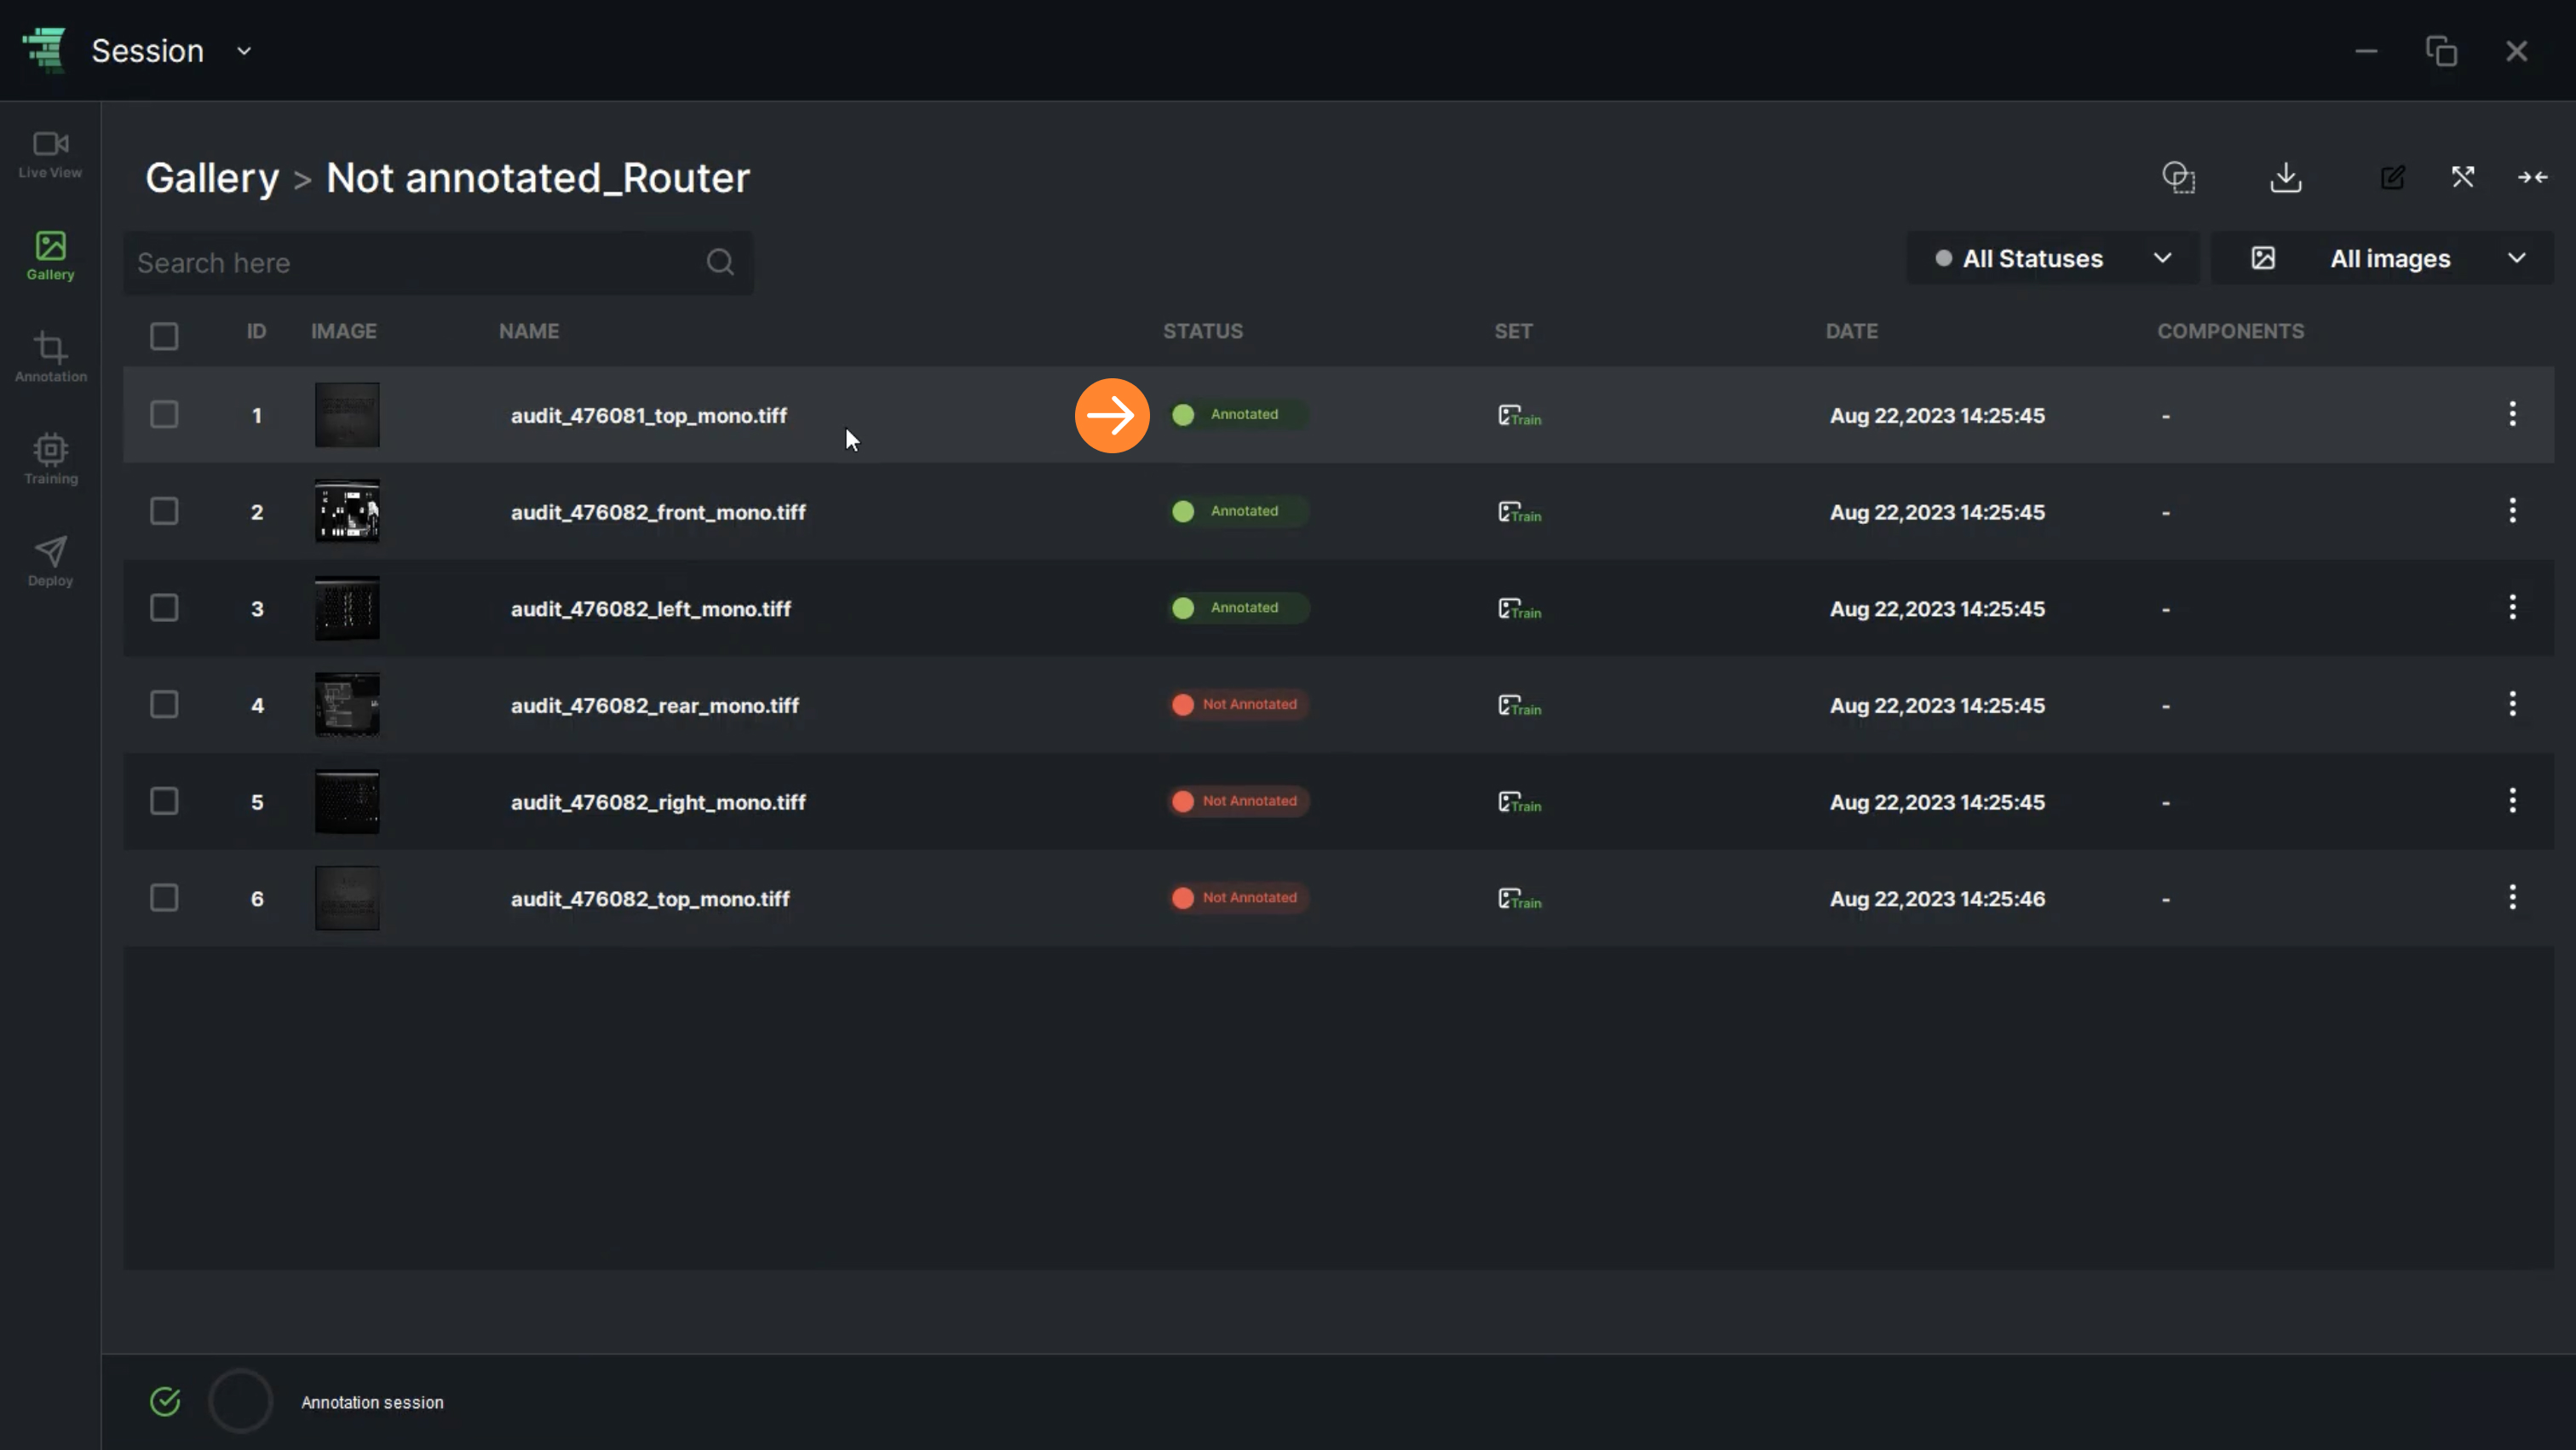
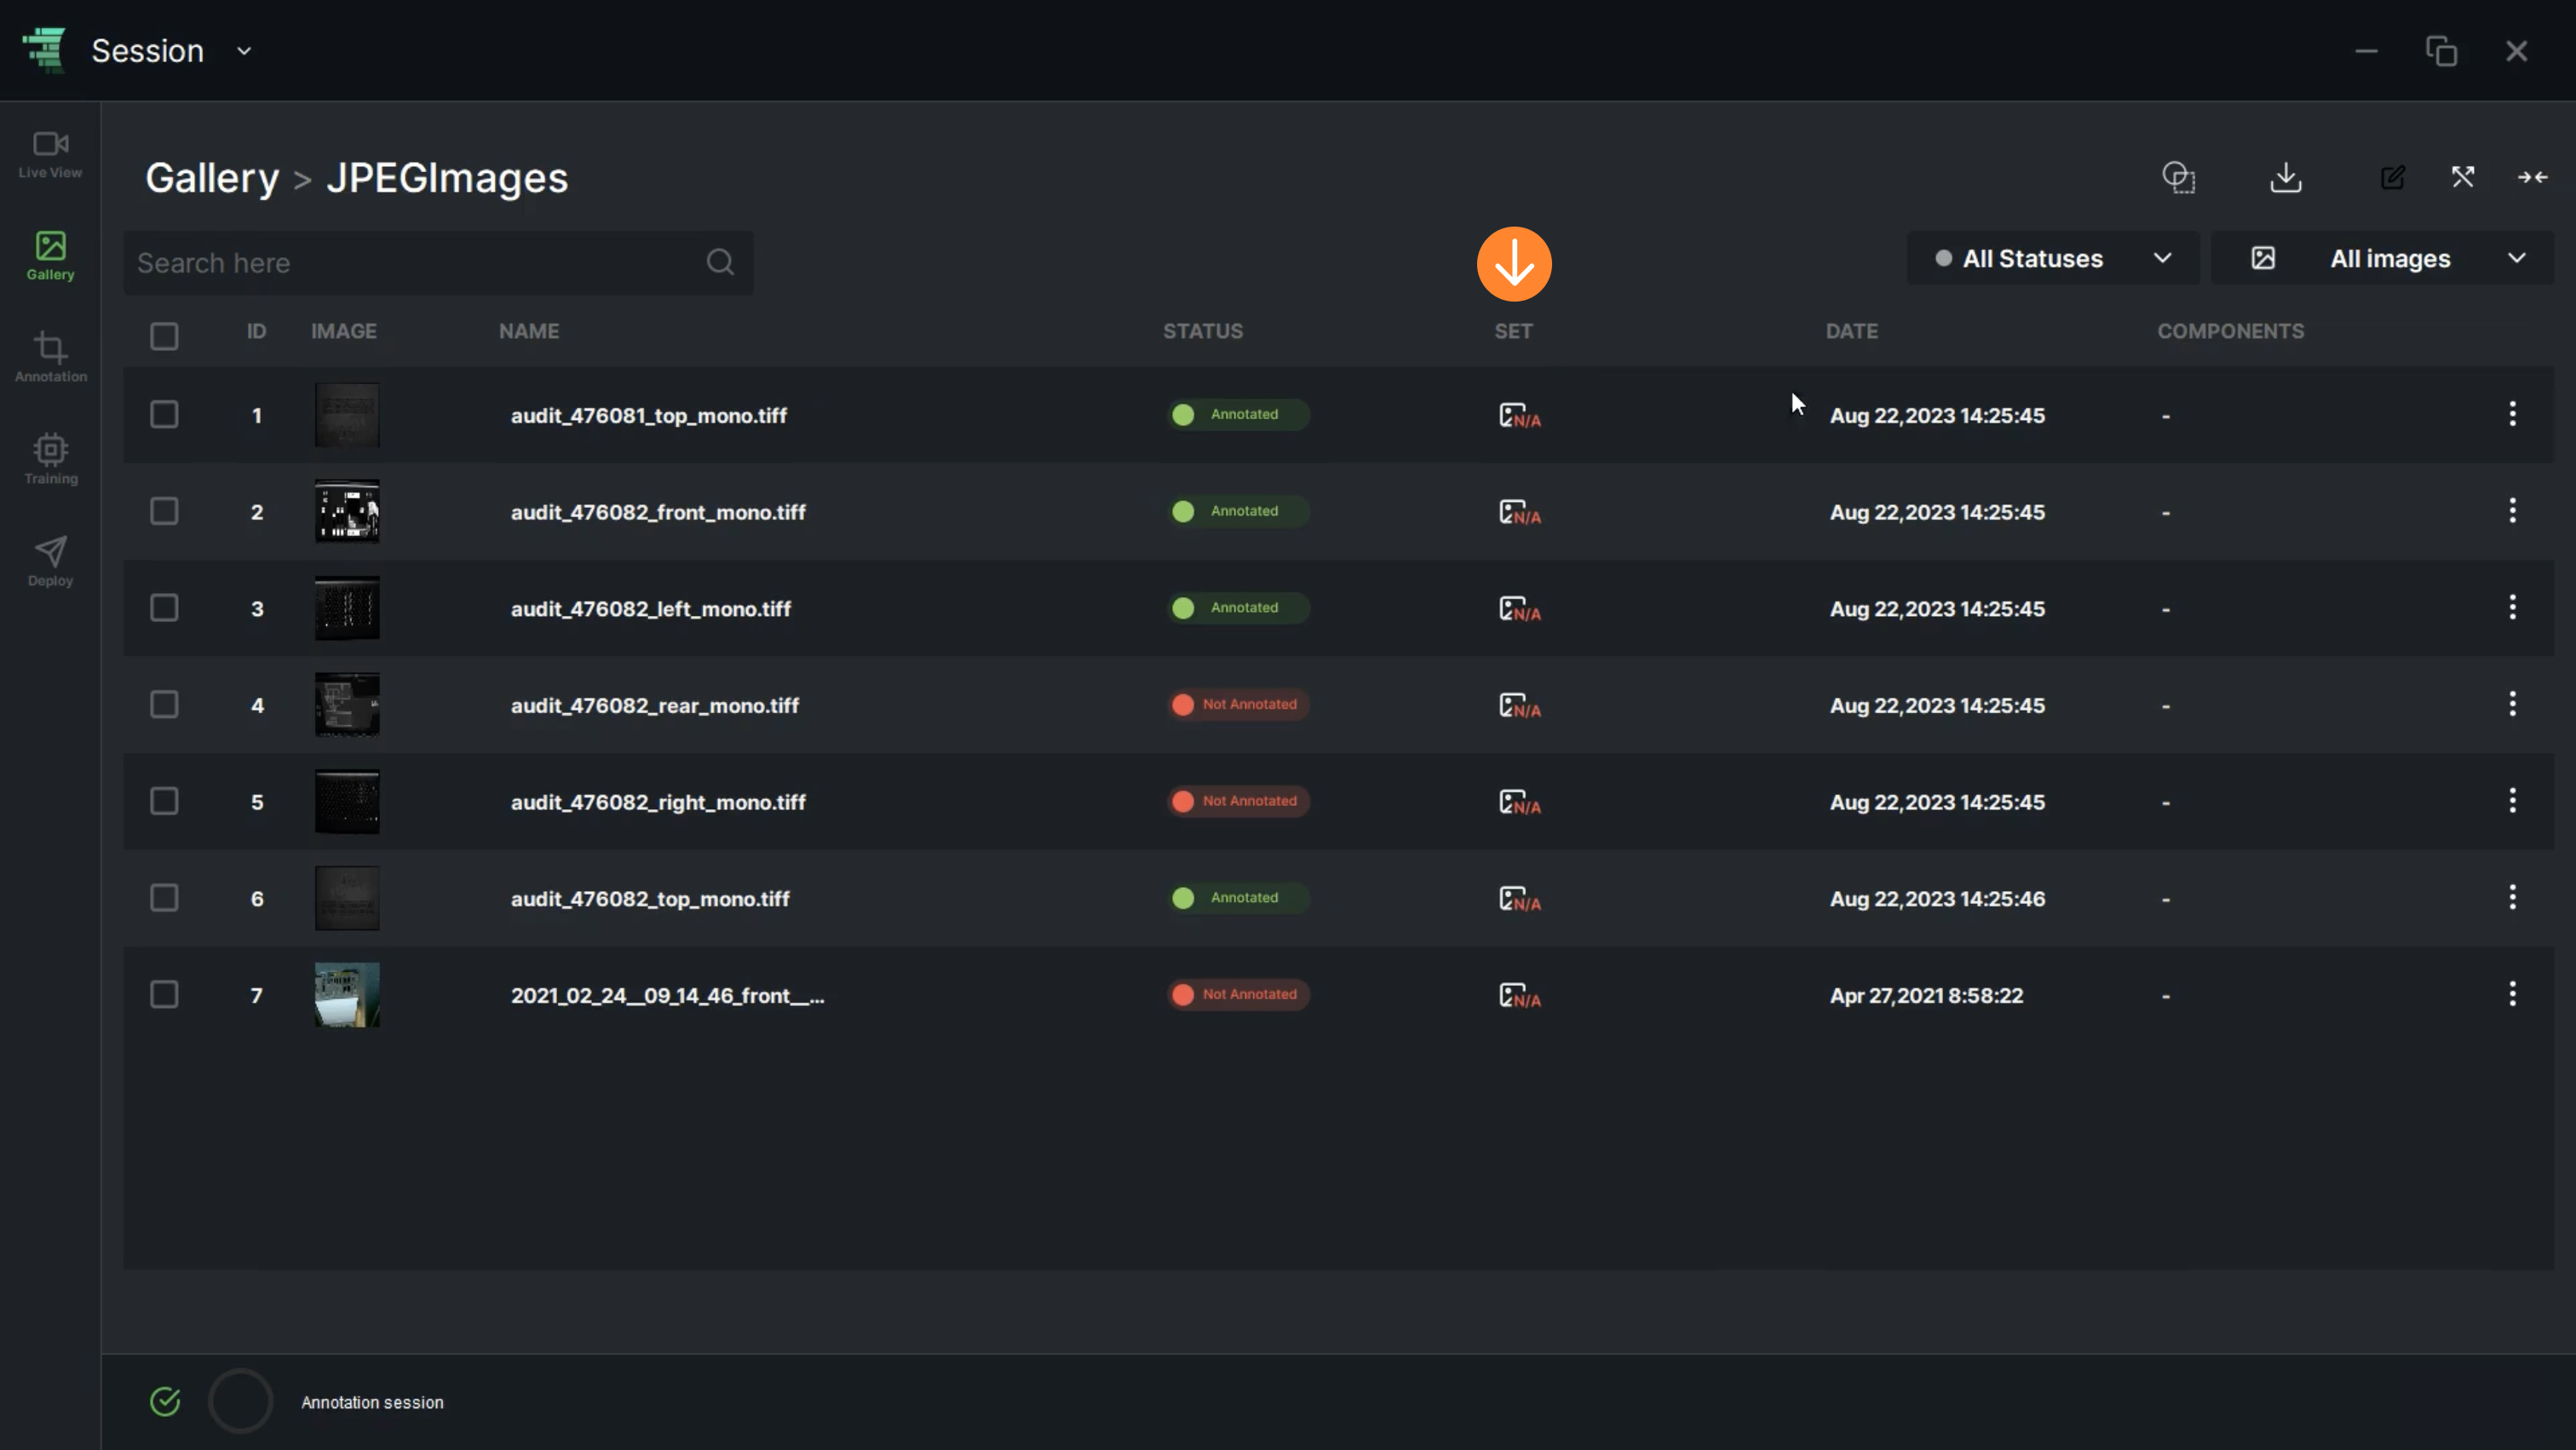
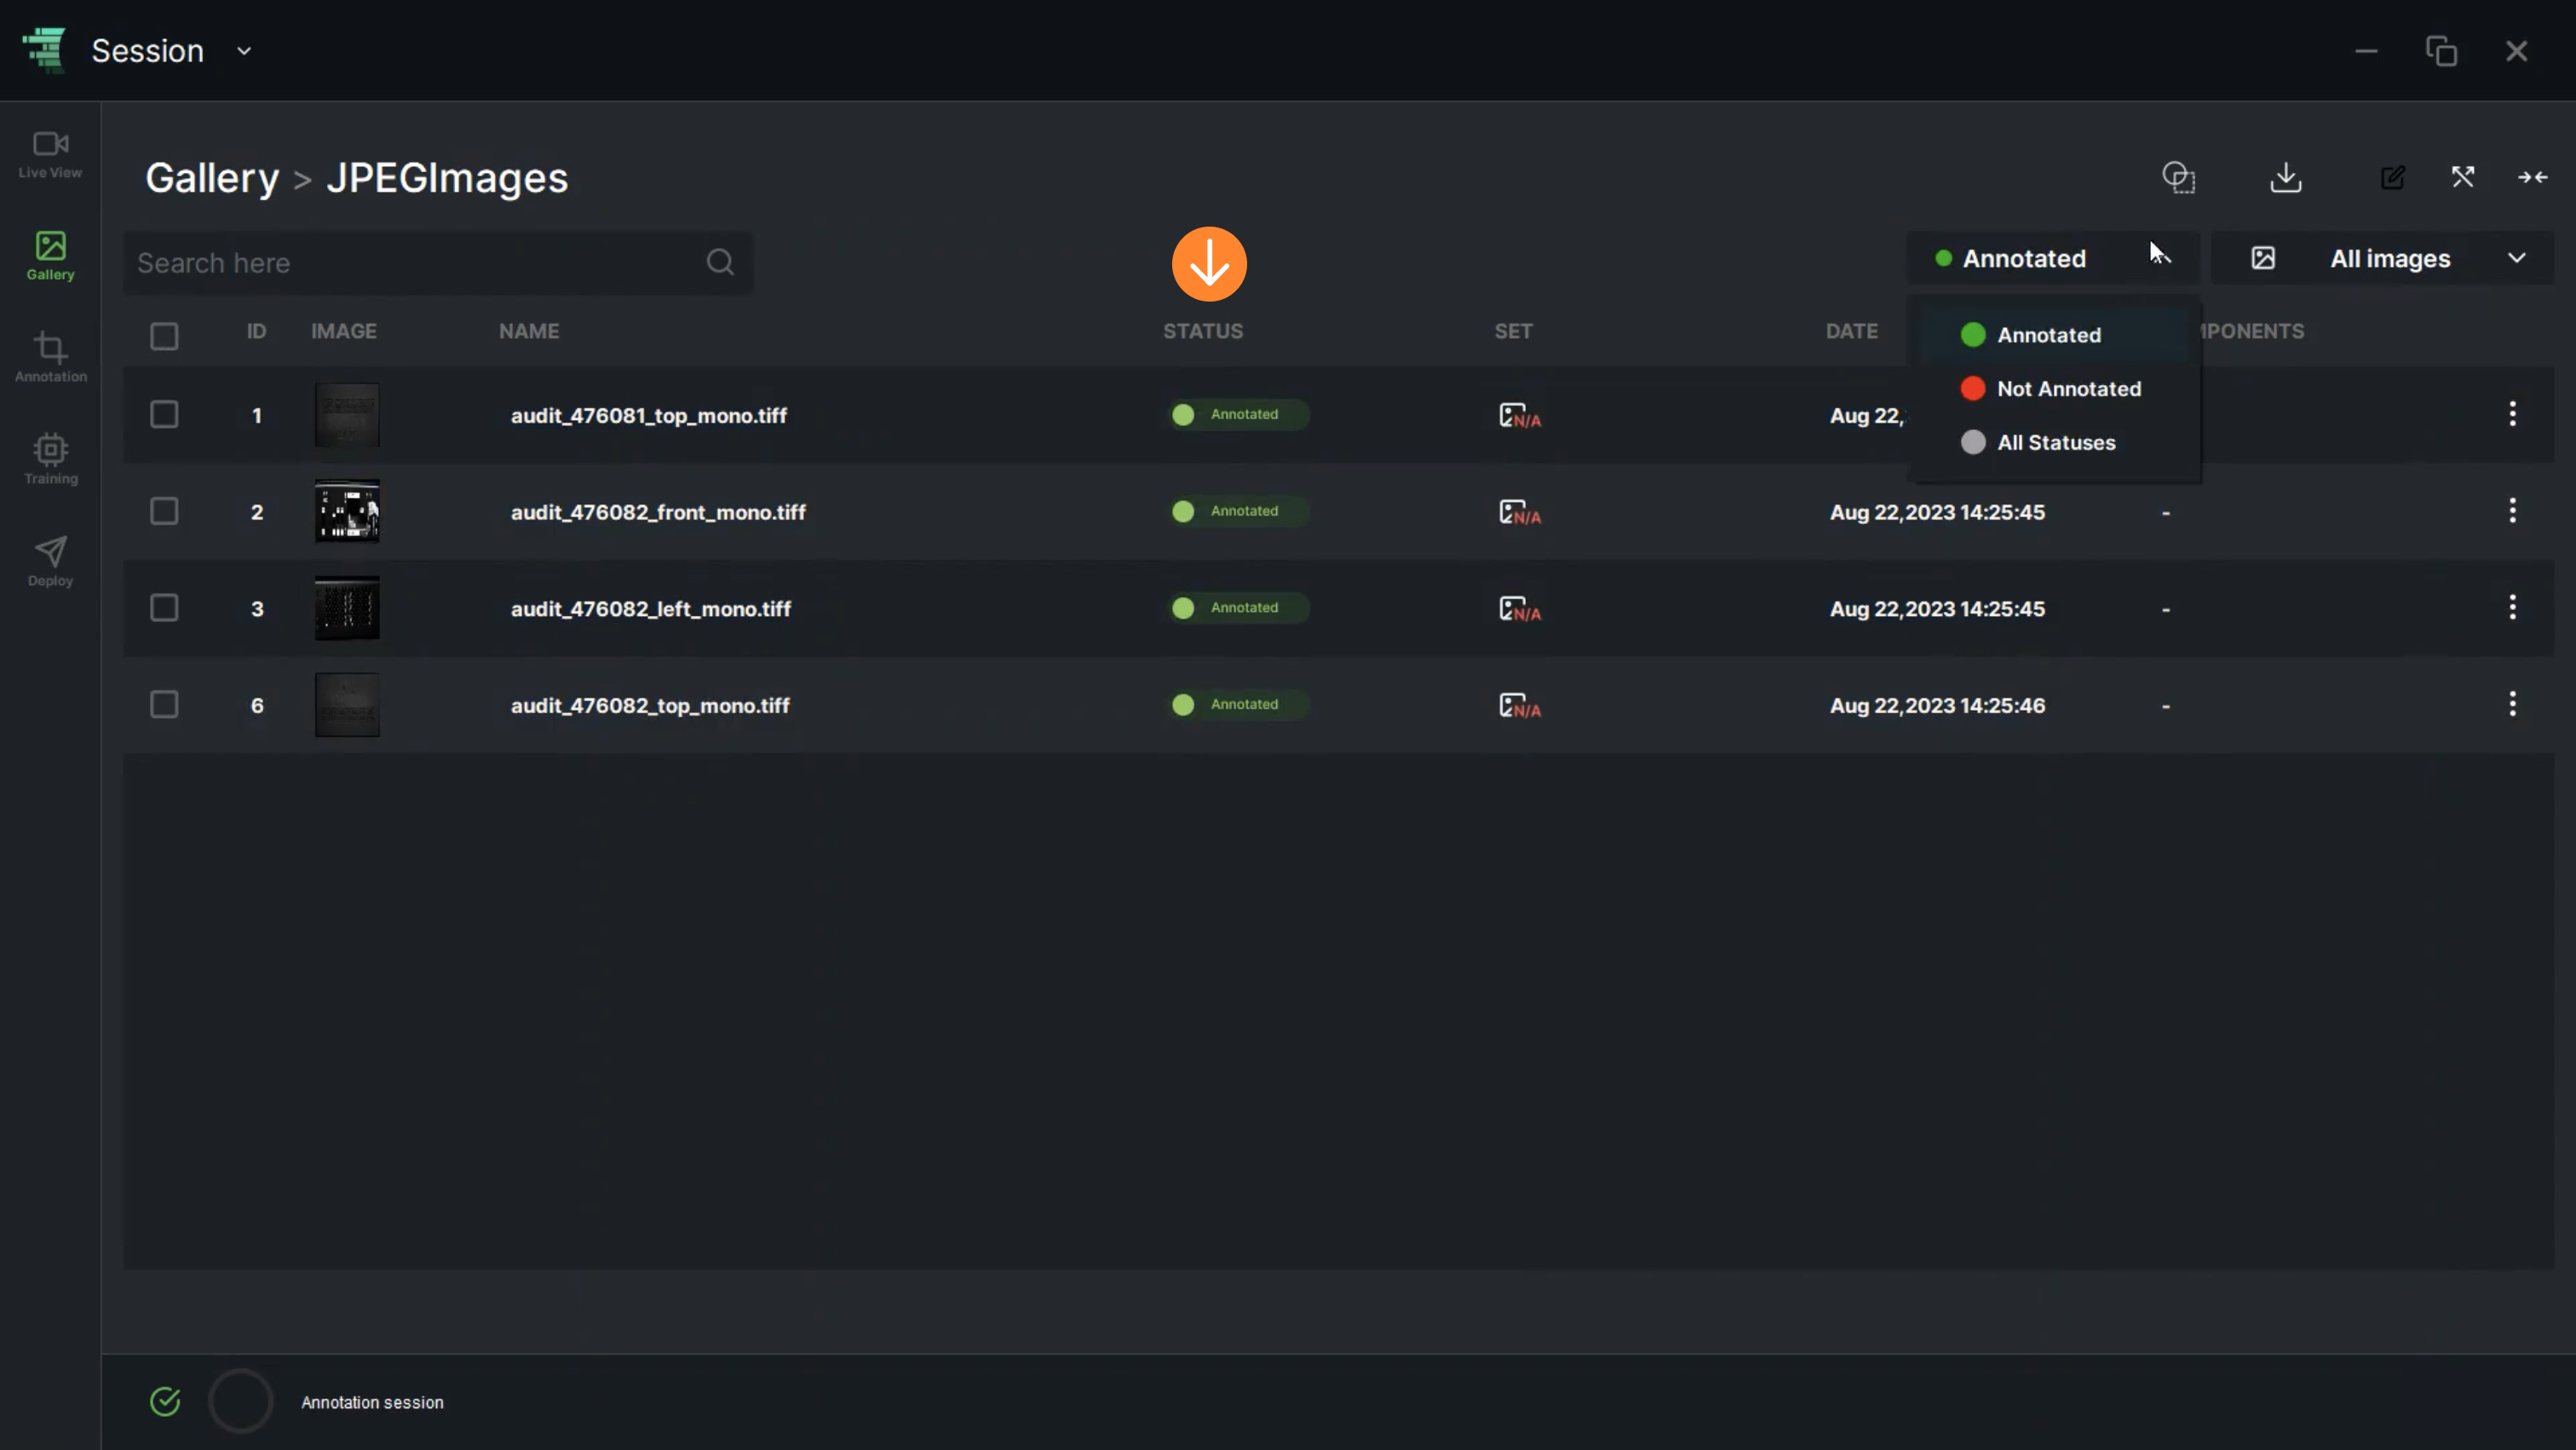
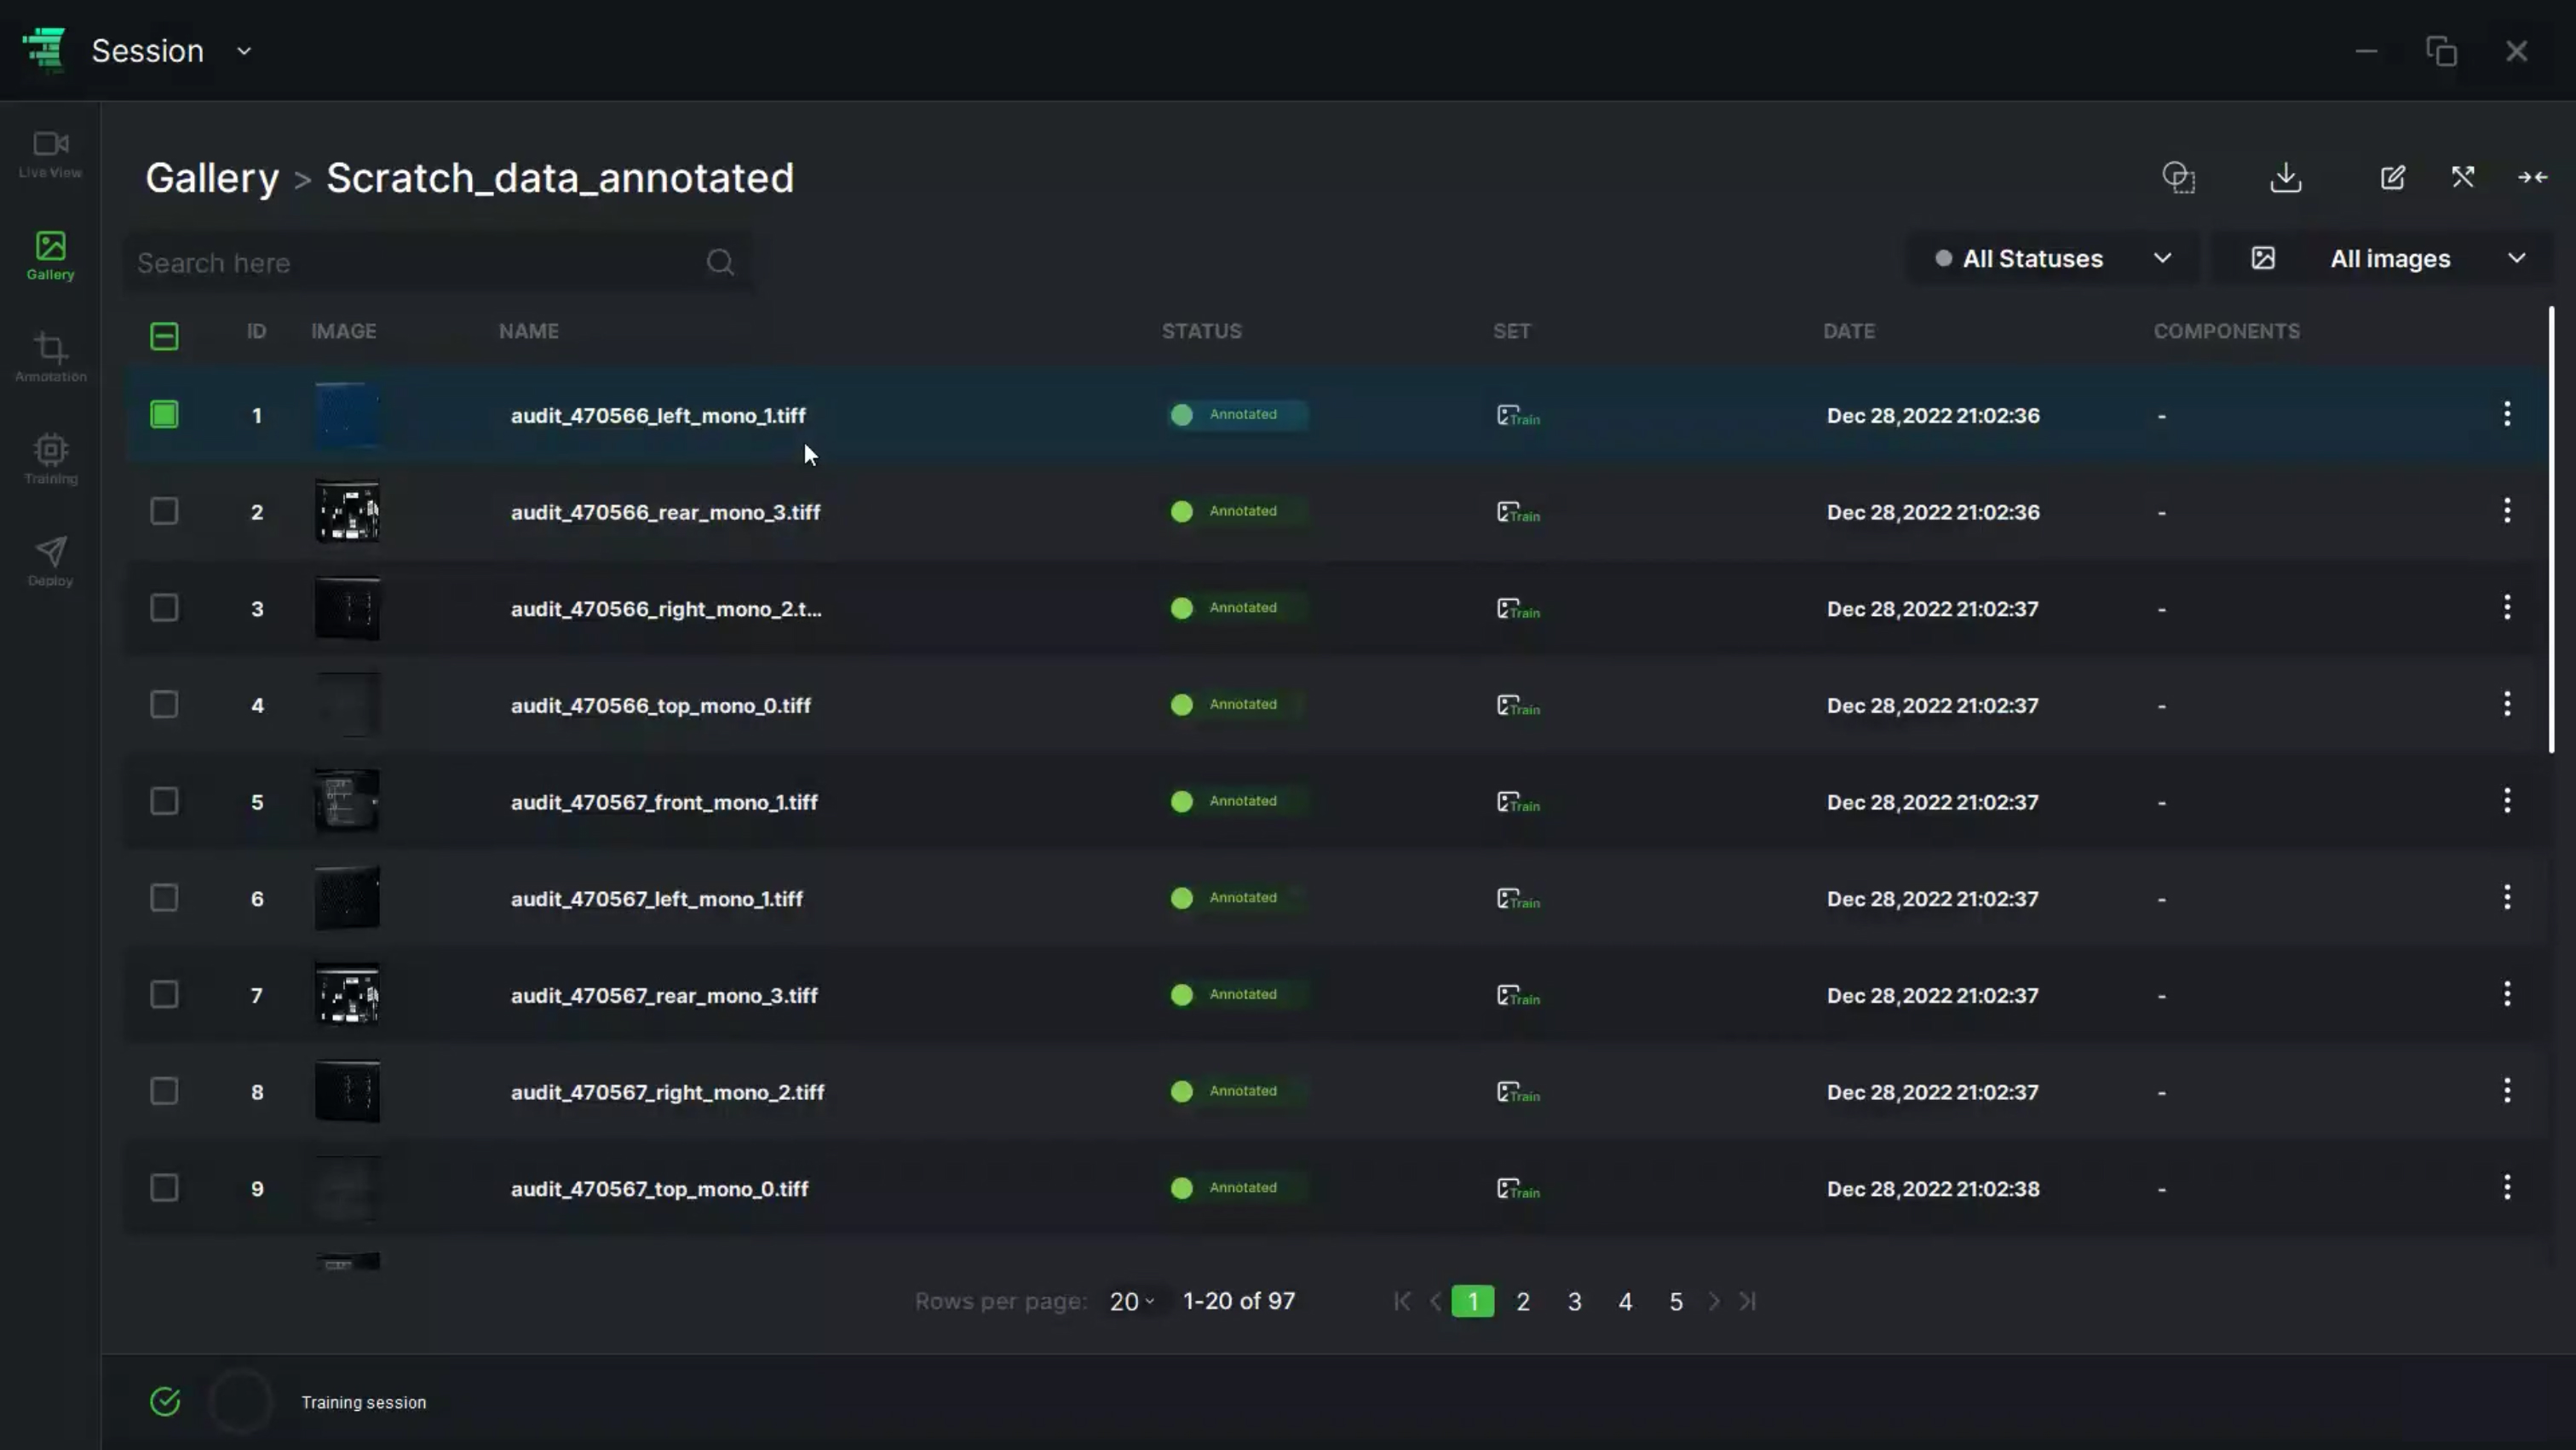
11. “All Statuses” option enables the user to filter images based on “Annotated” or “Not Annotated” statuses. Upon selecting either of these options, the list view will be automatically updated to reflect the chosen filter

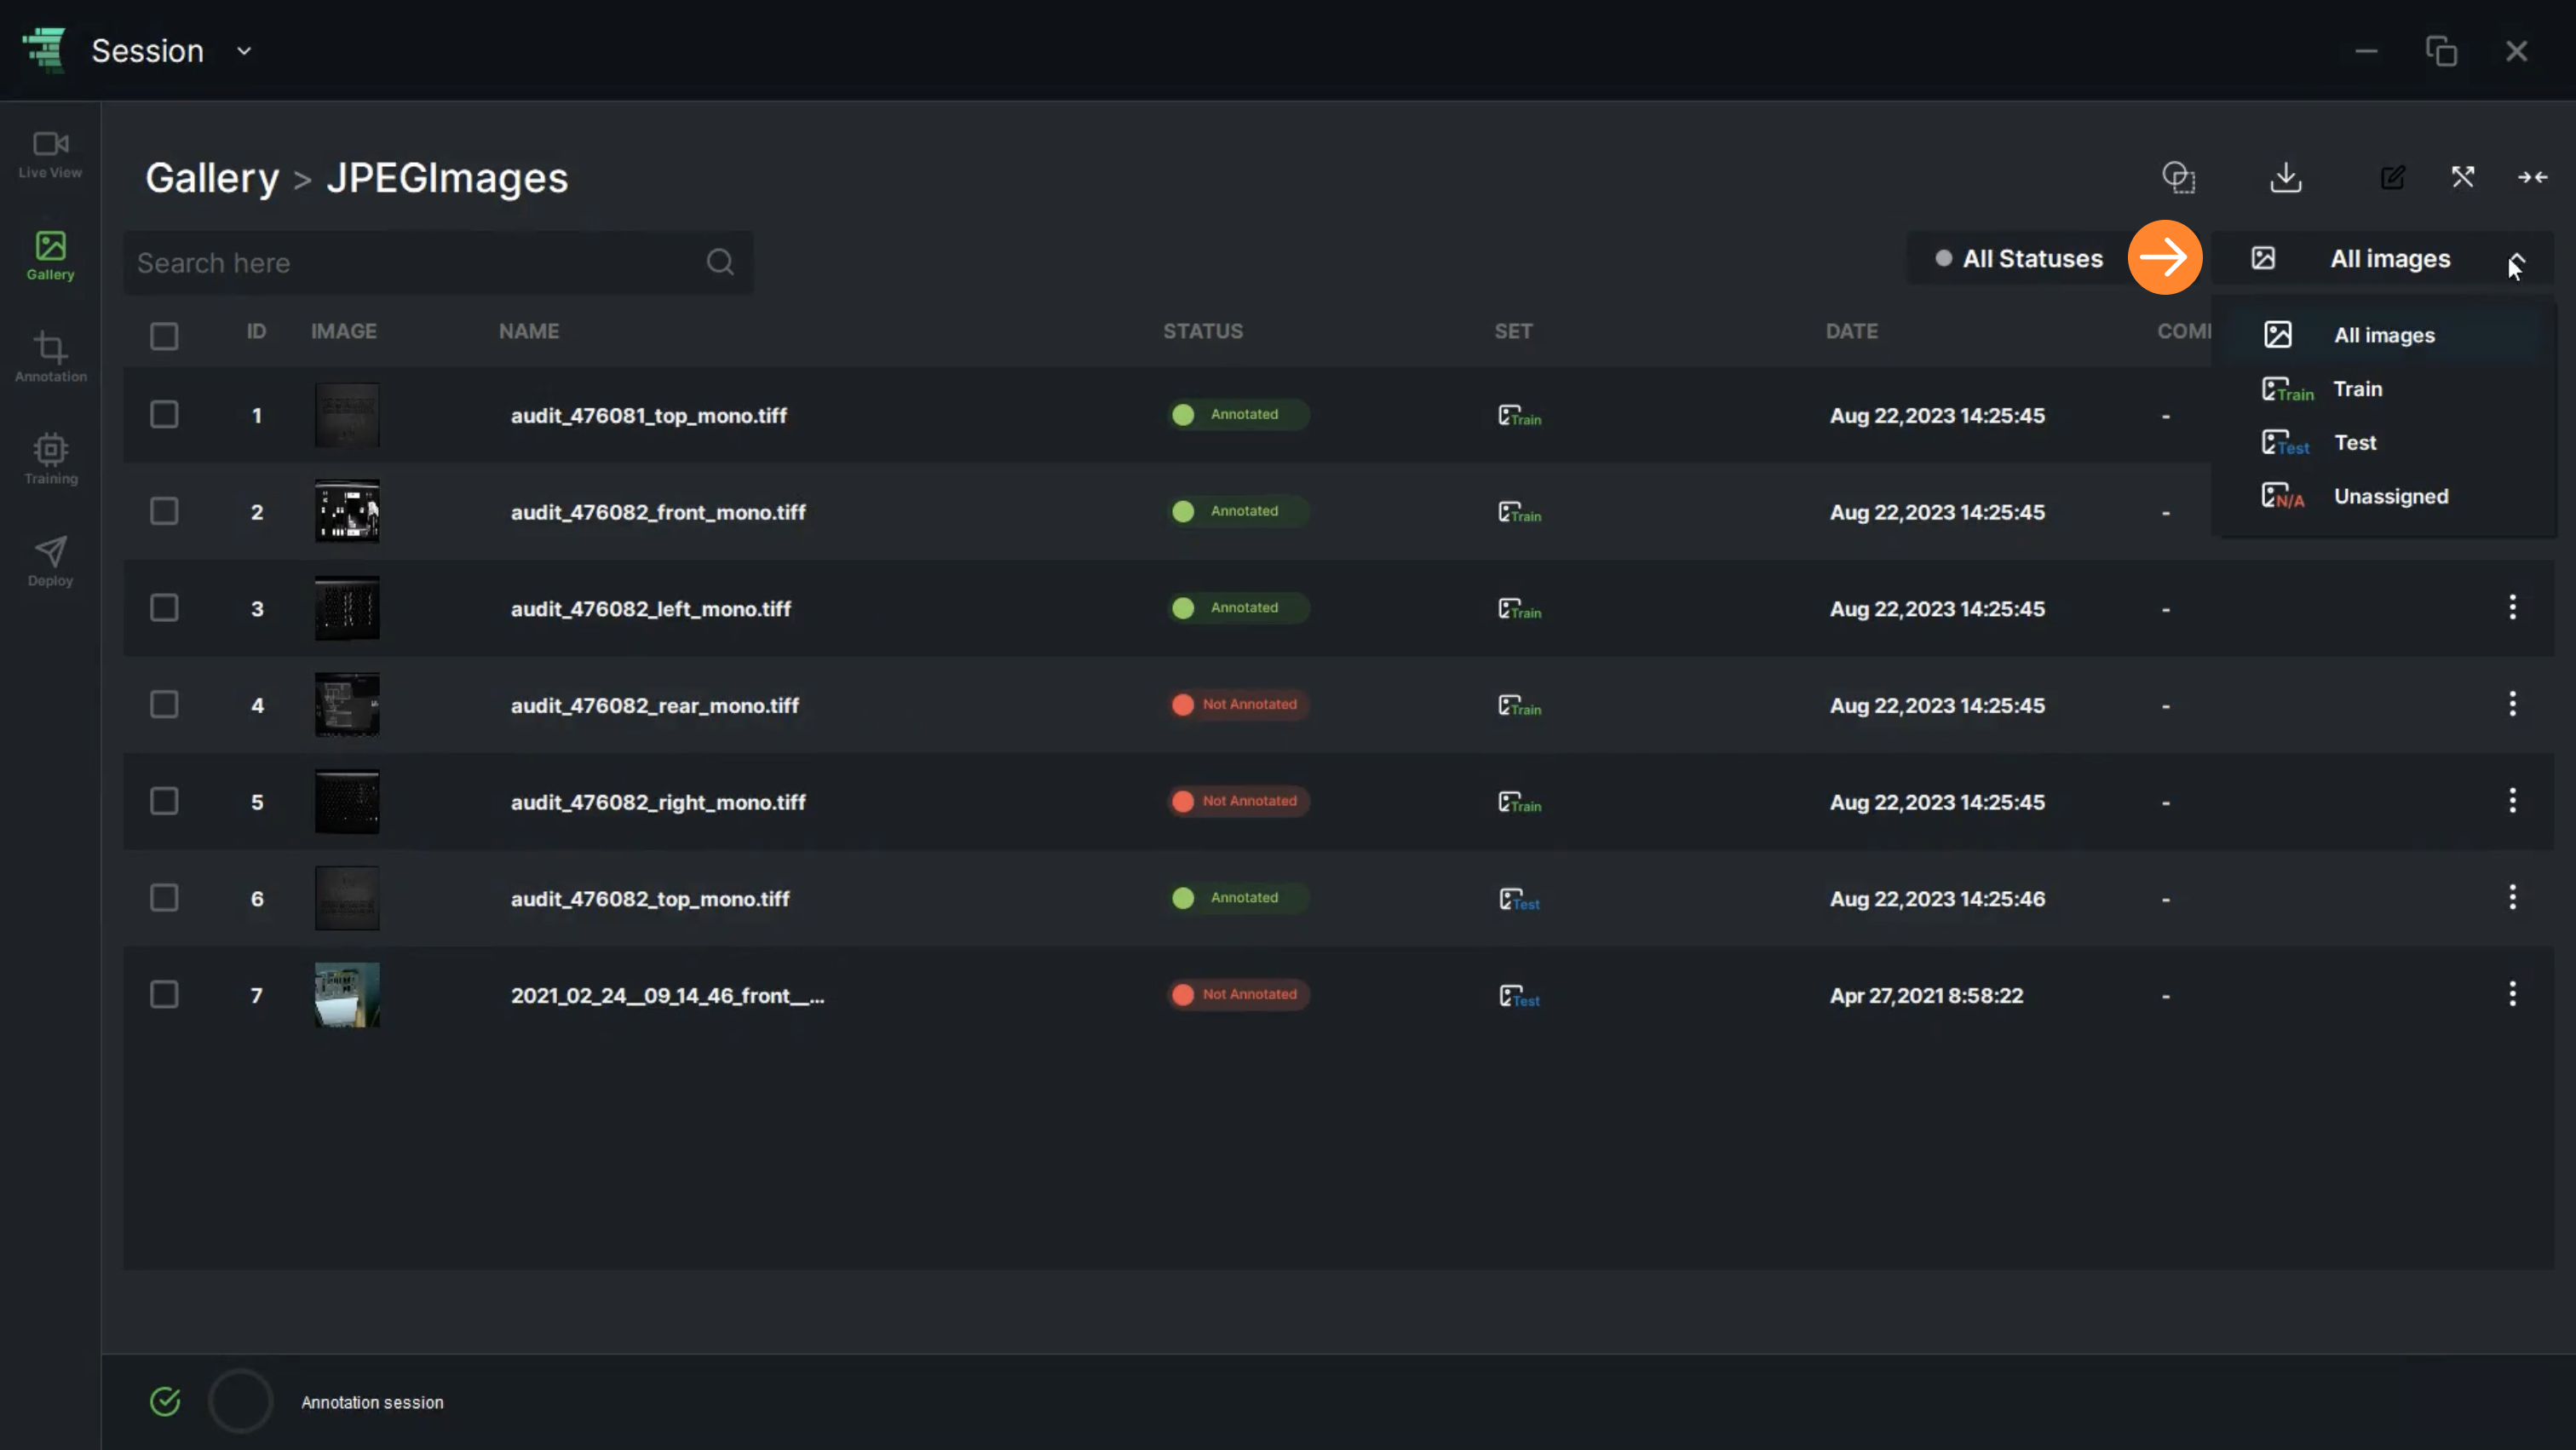
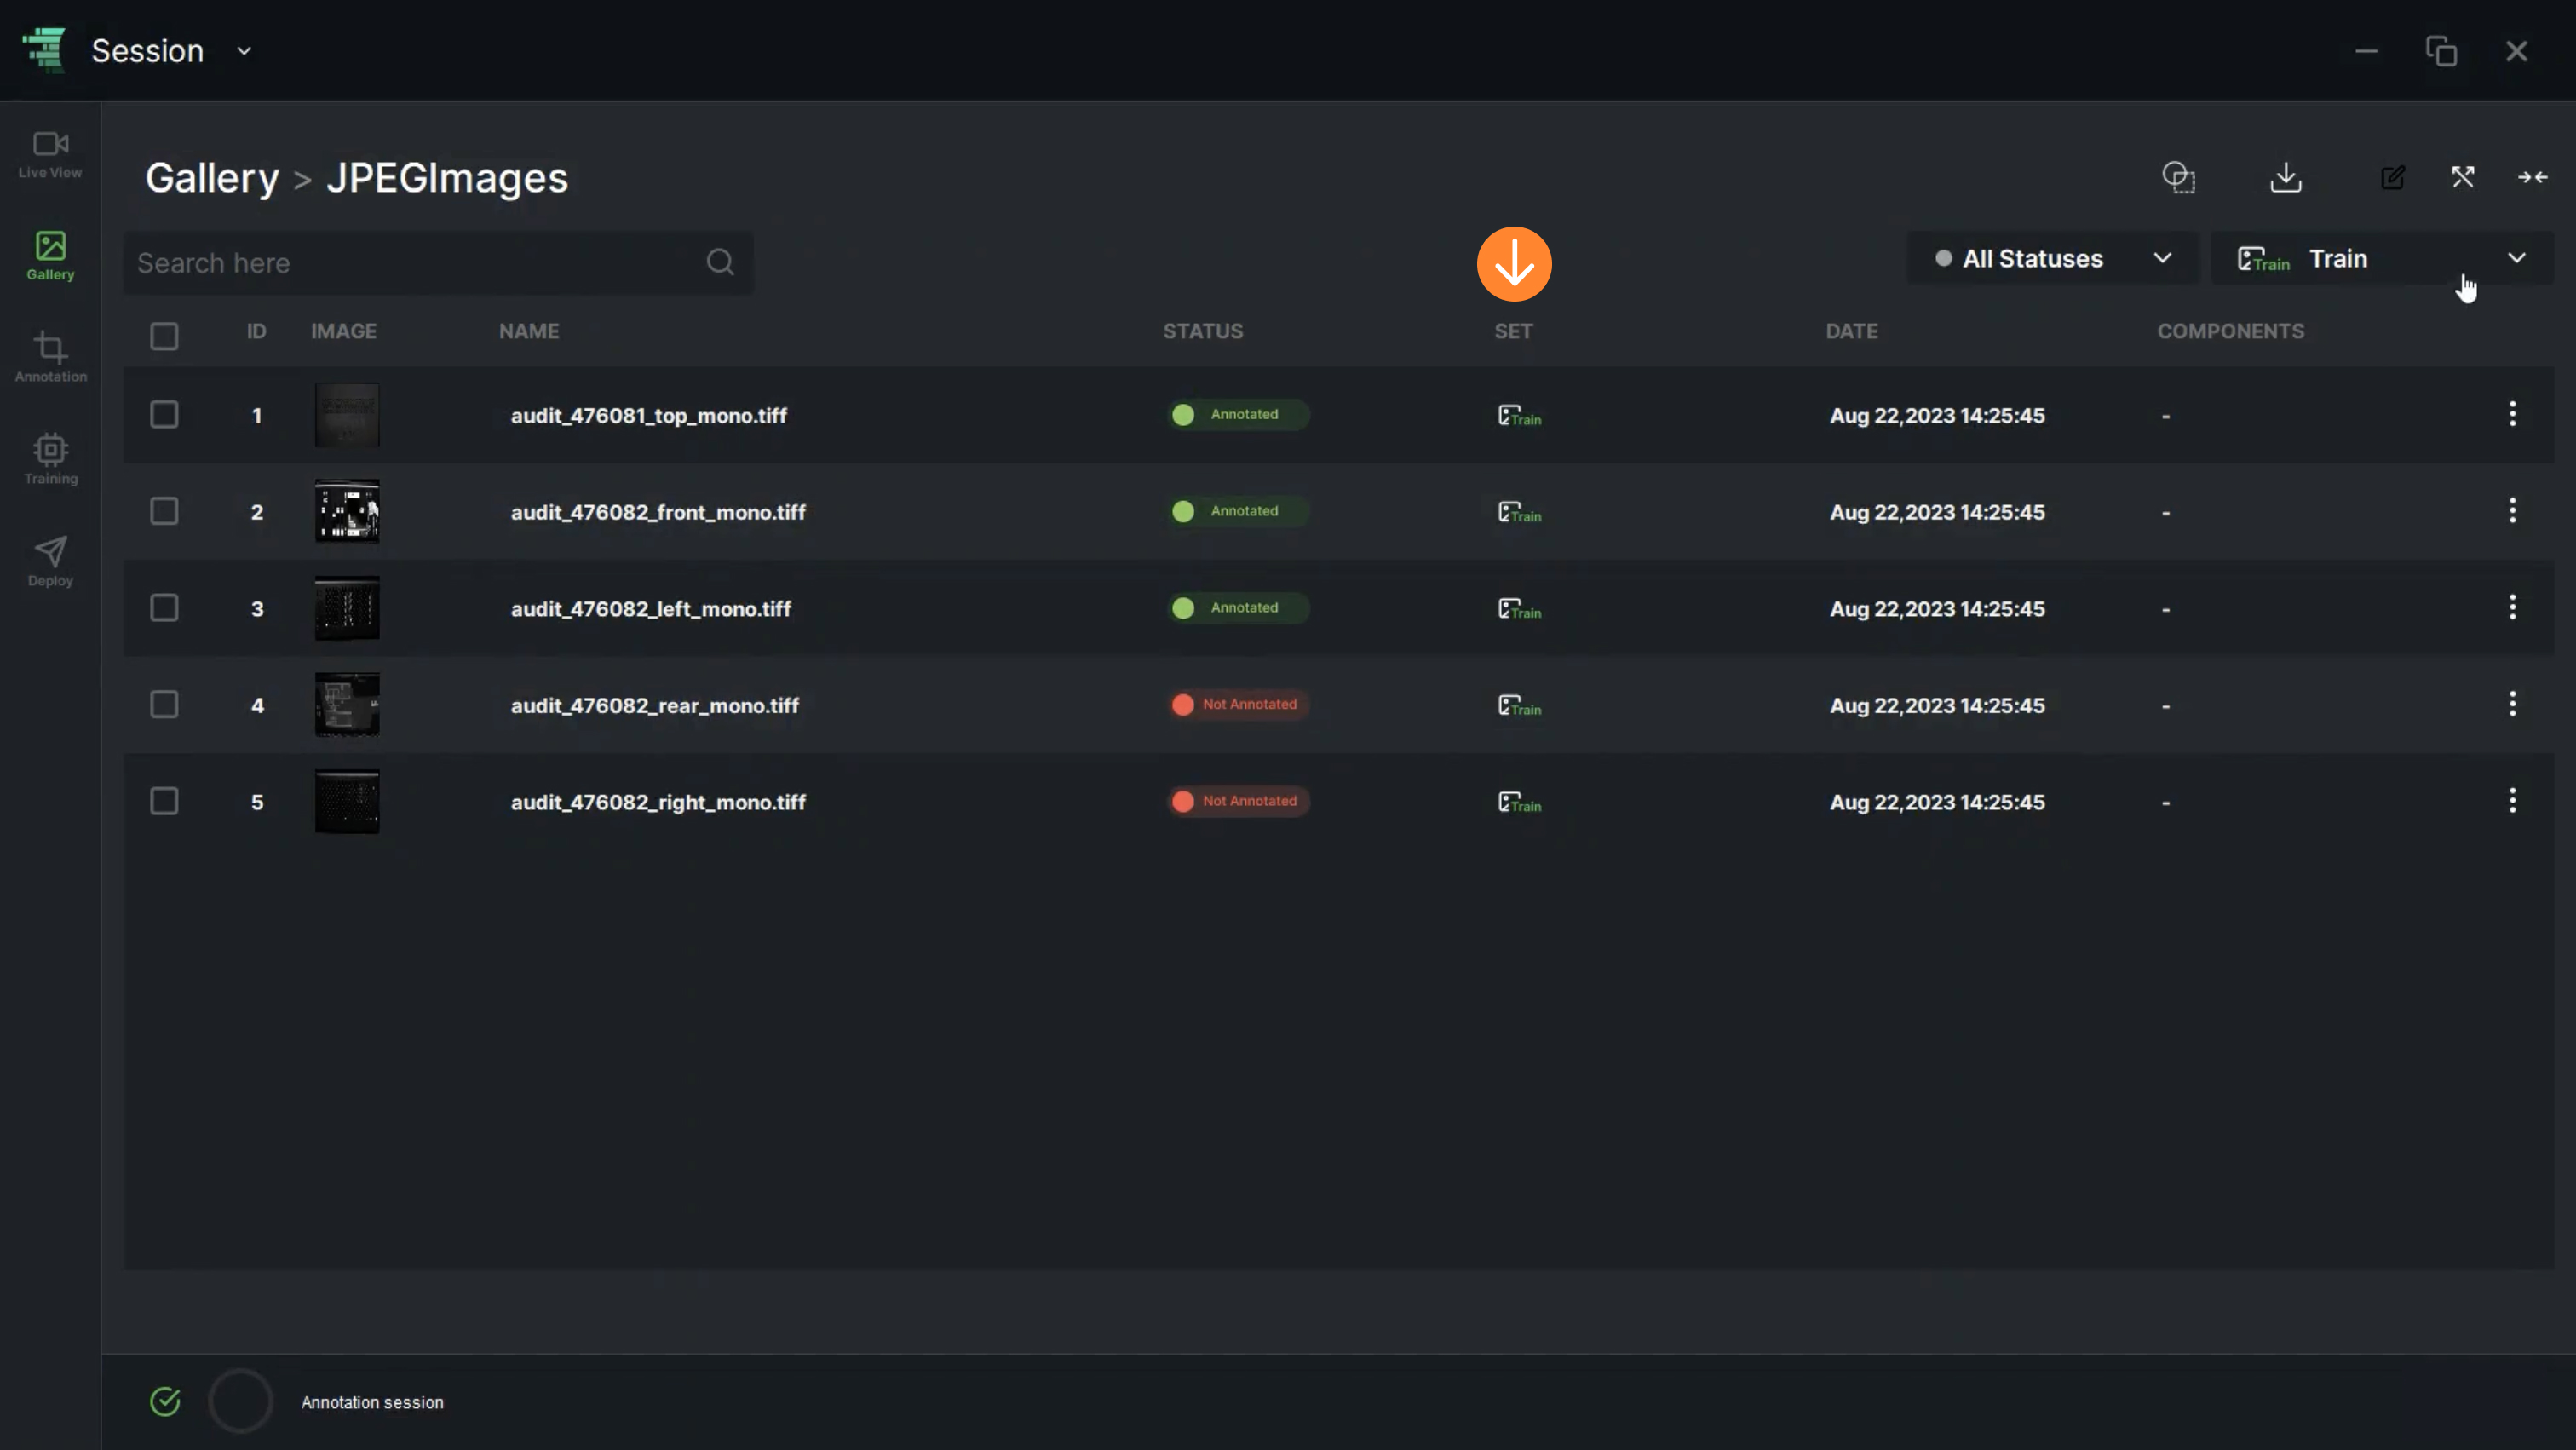
12. “All Images” allows the user to filter the images by selecting Train/Test/Unassigned statuses. Upon selecting either of these options, the list view will be automatically updated to reflect the chosen filter

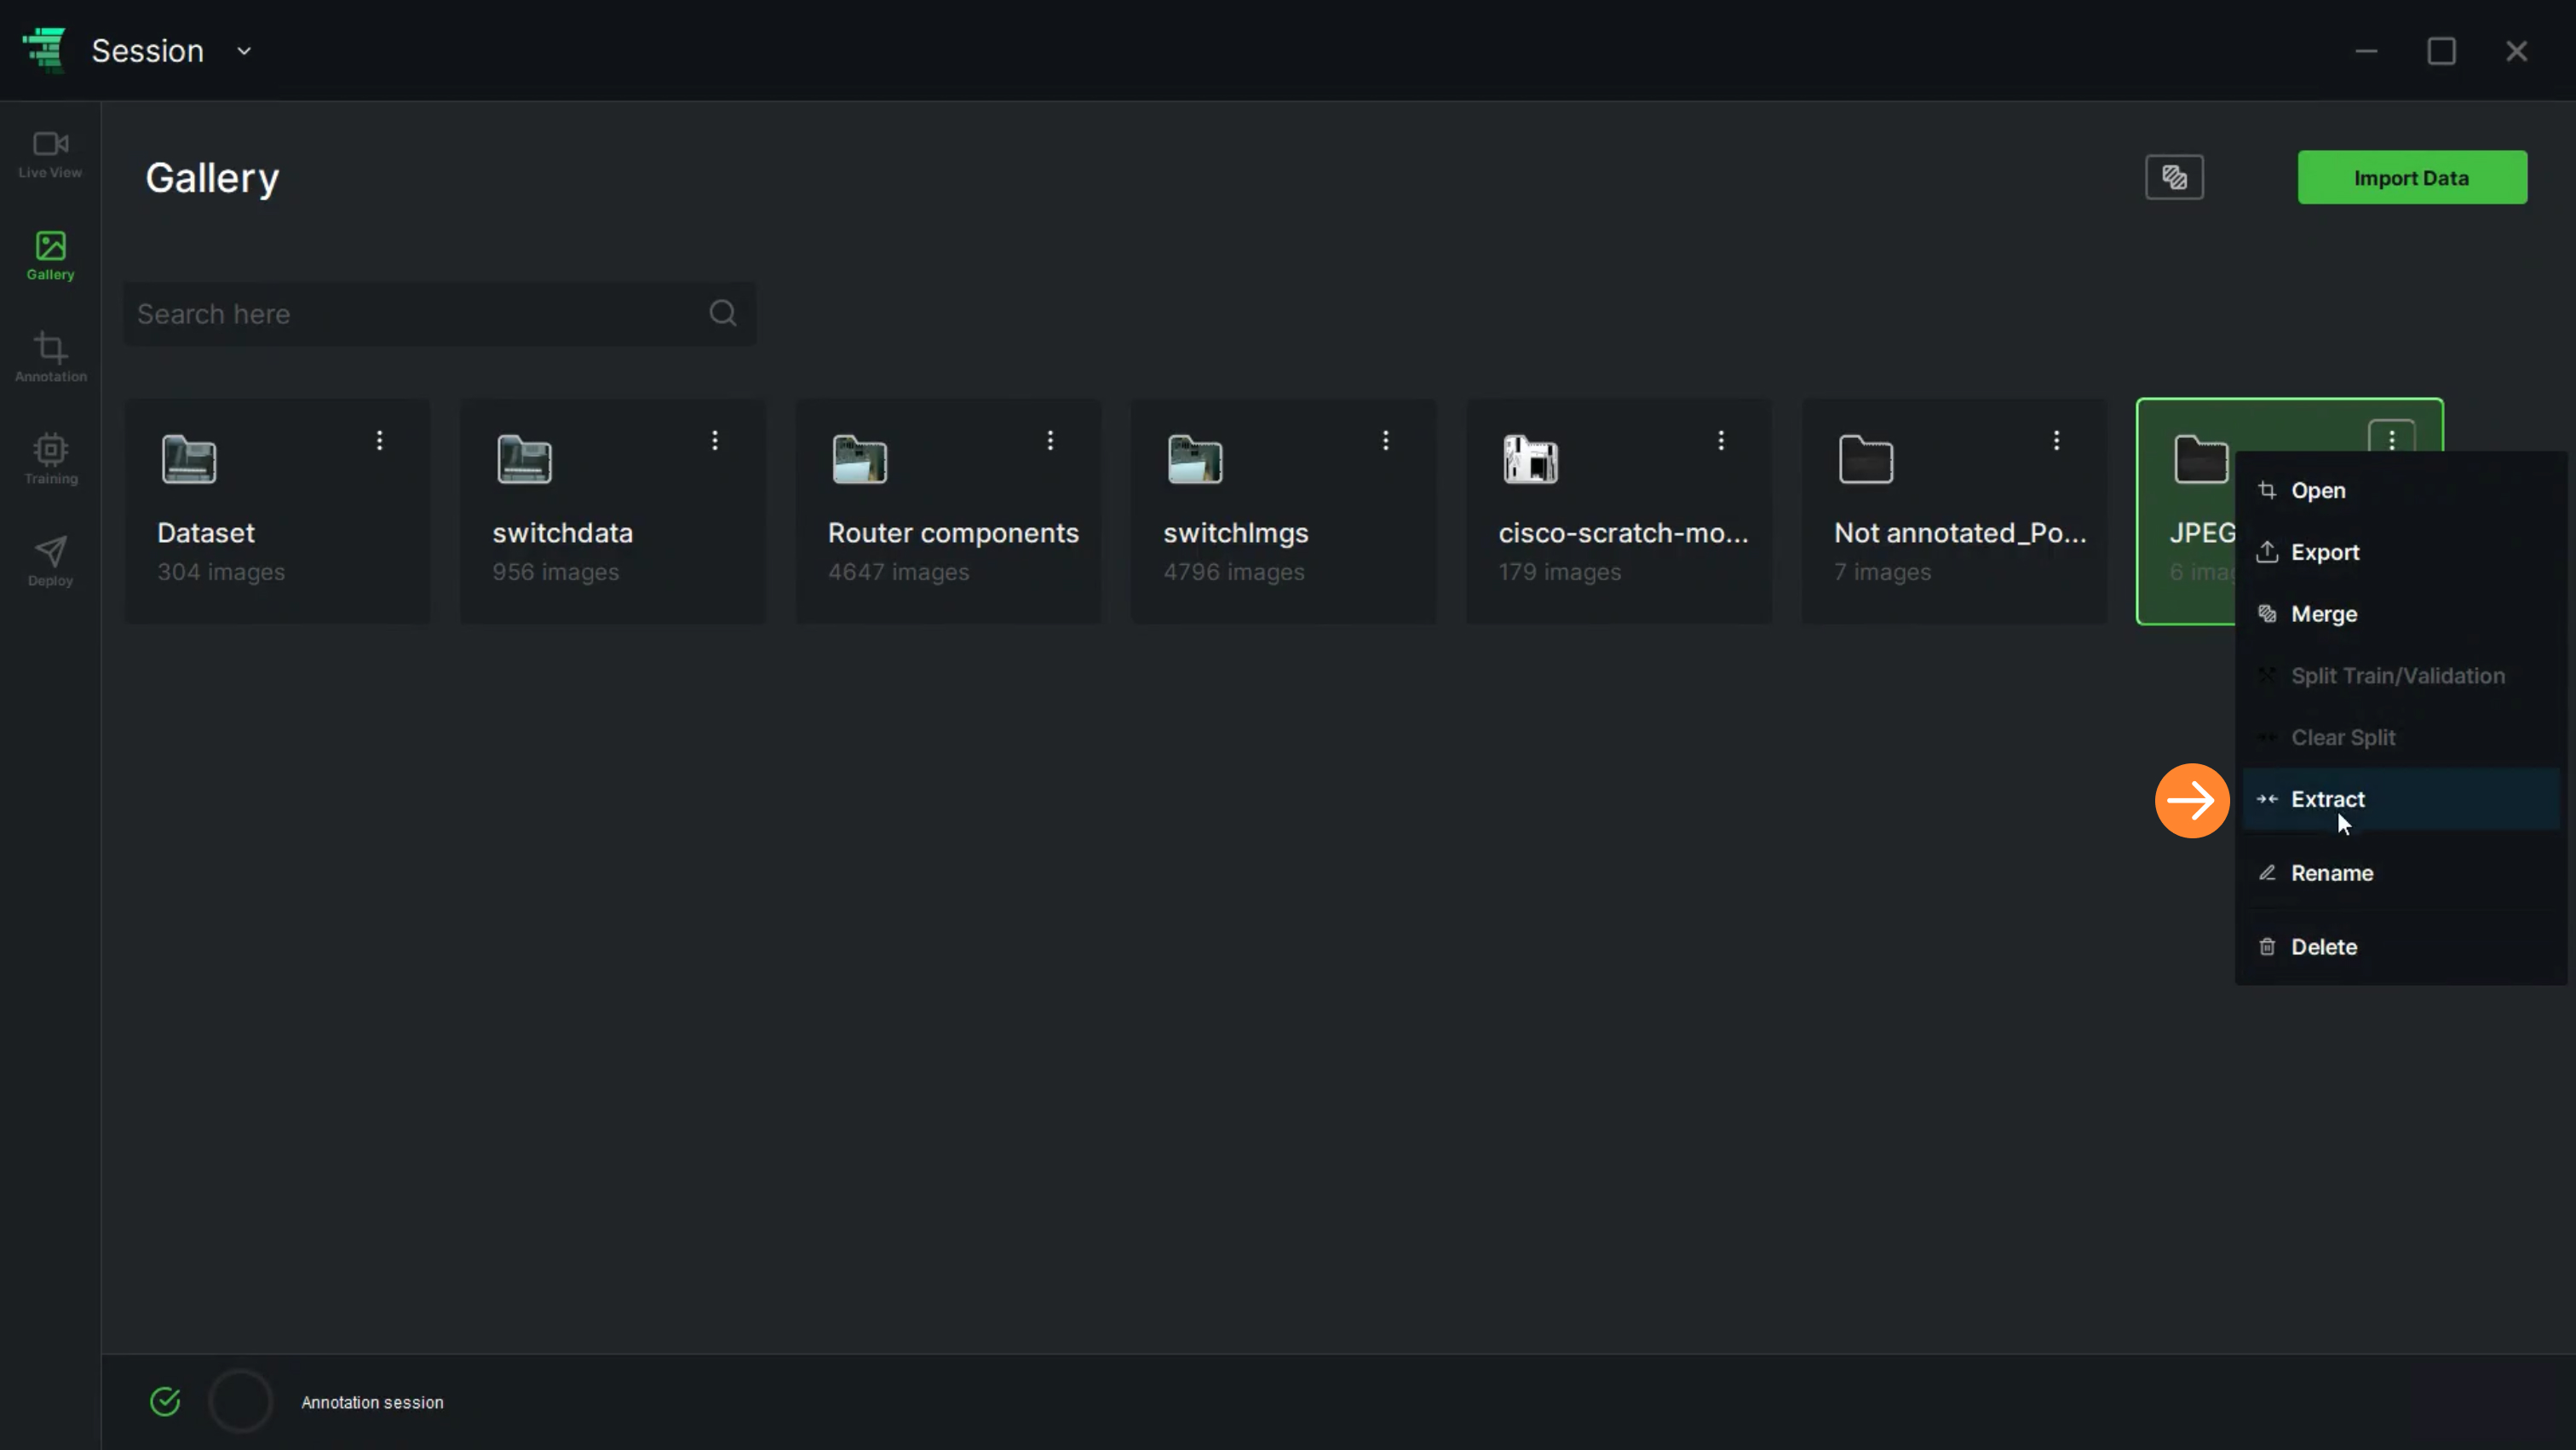
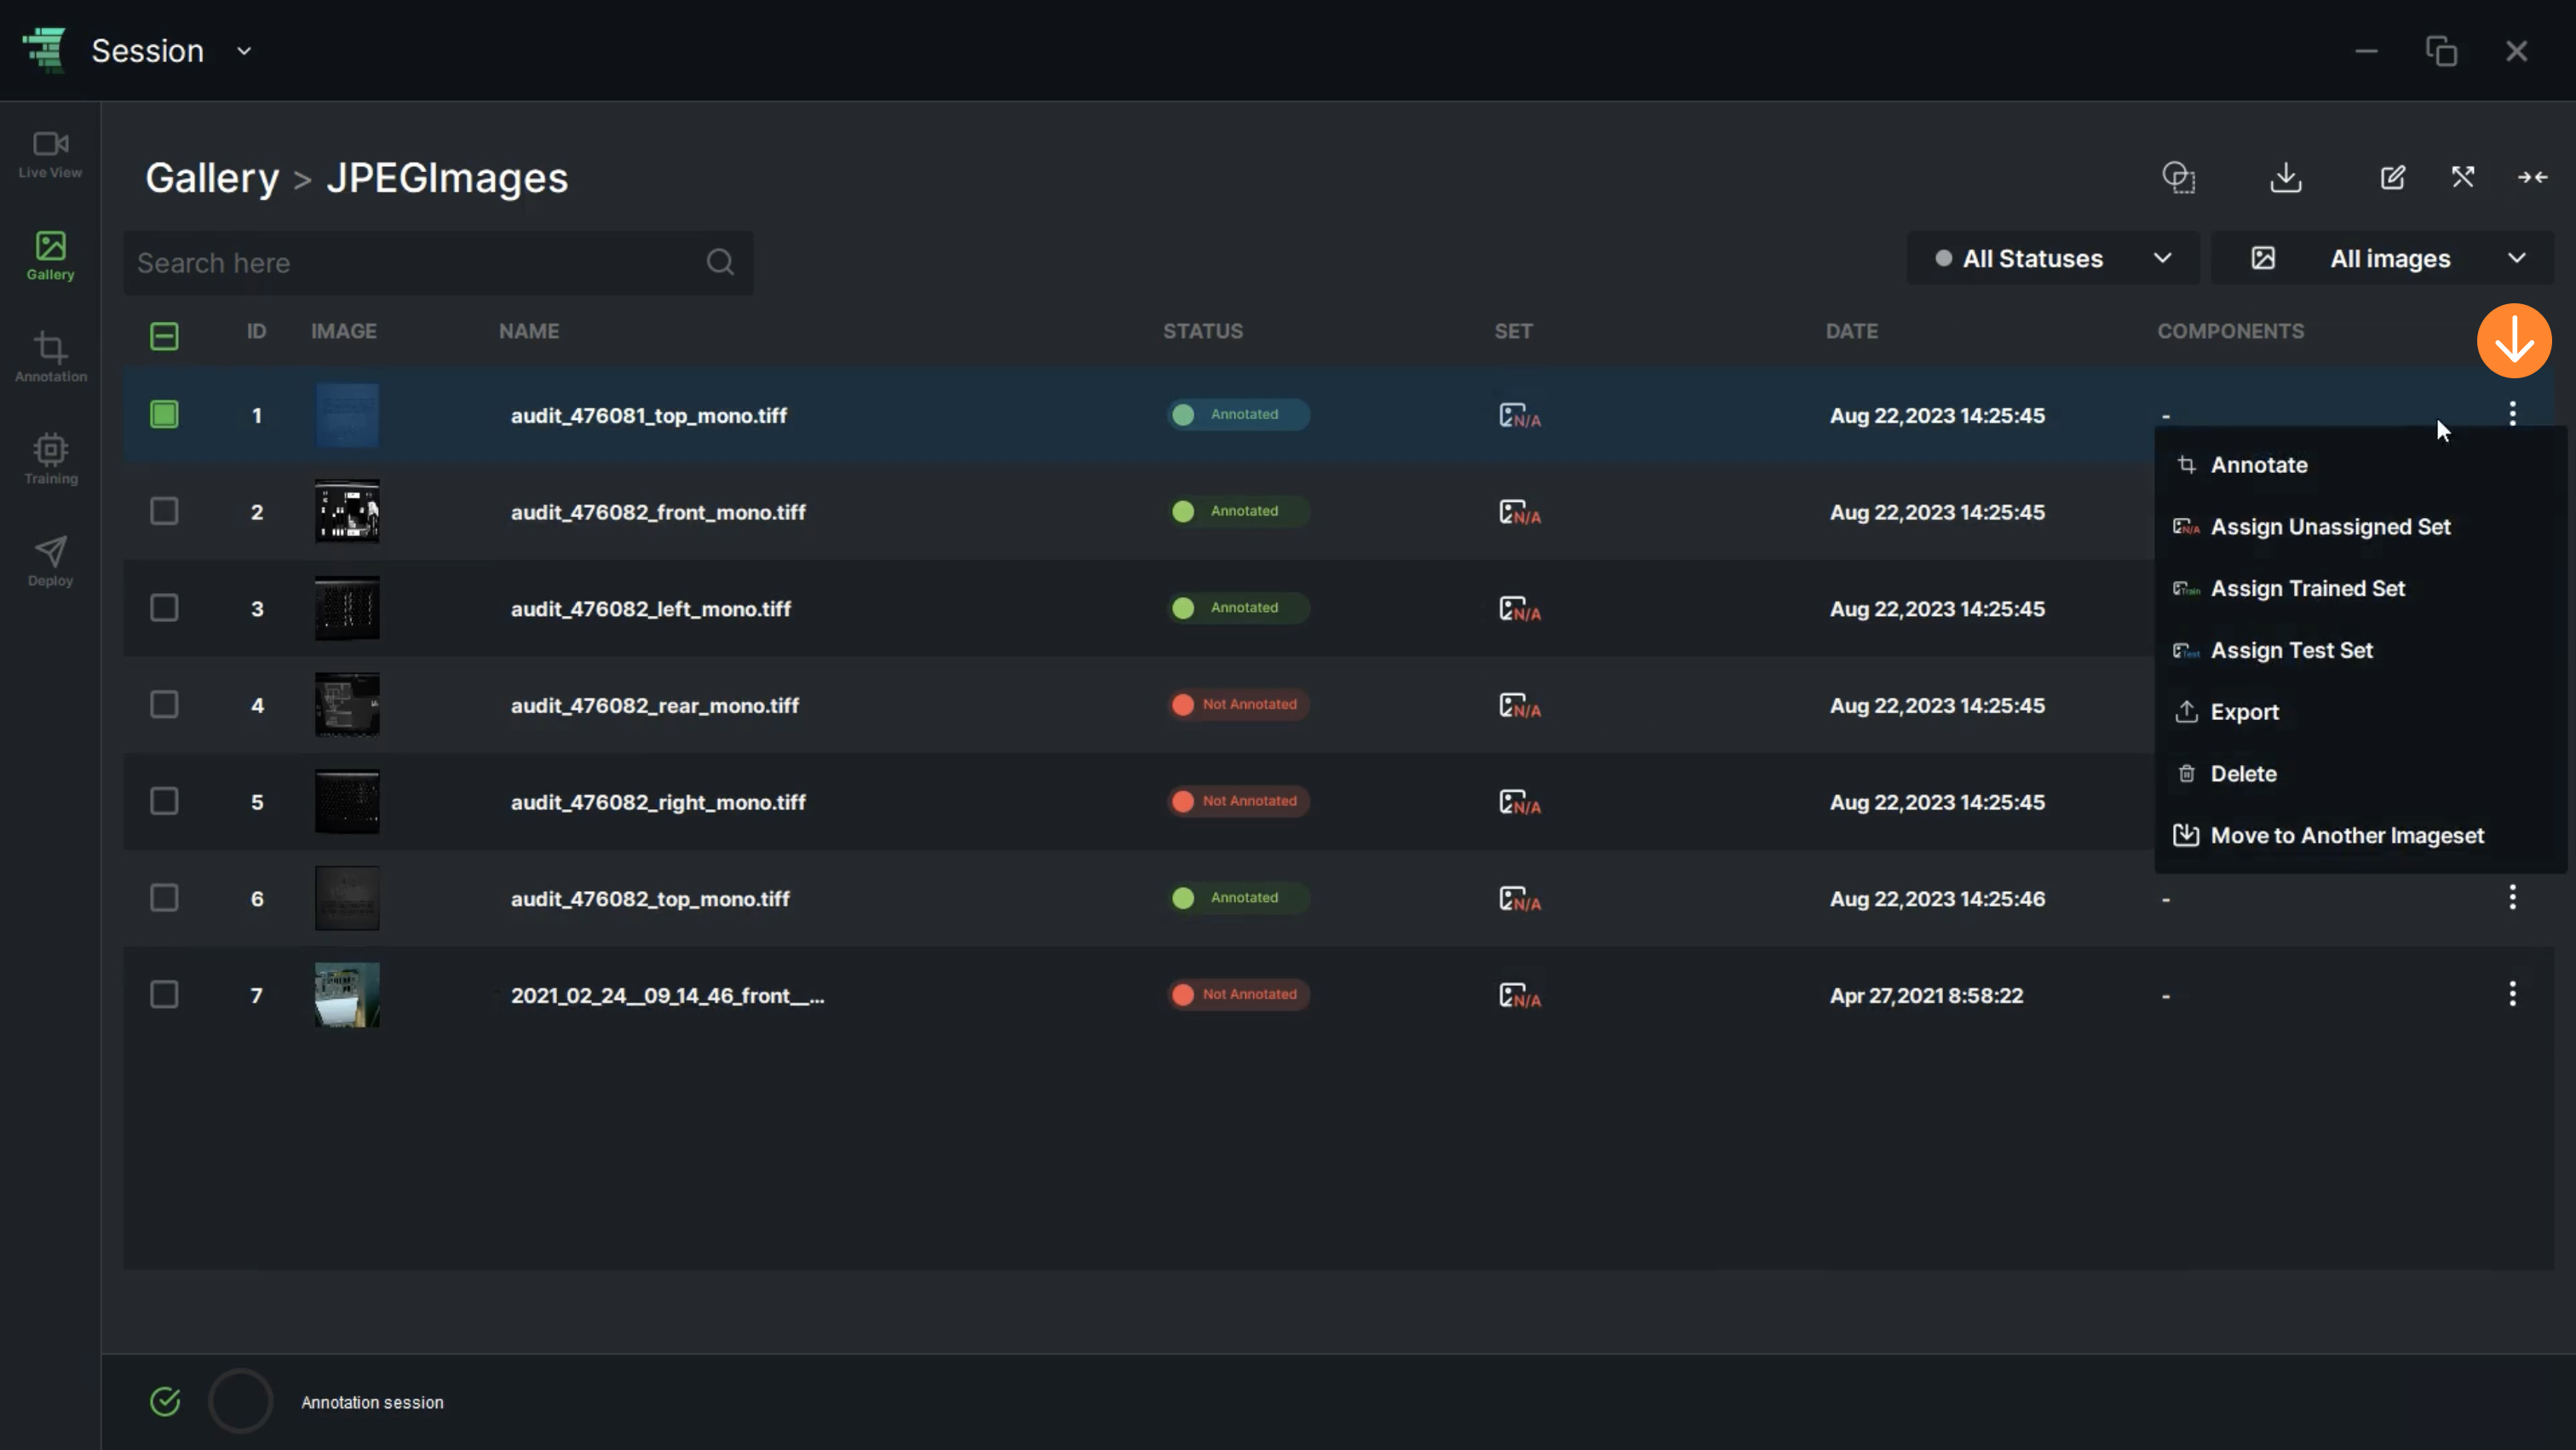
13. If the user clicks on the “More” icon () on the right, a dialog box will be displayed containing functions similar to “Apply Operation”

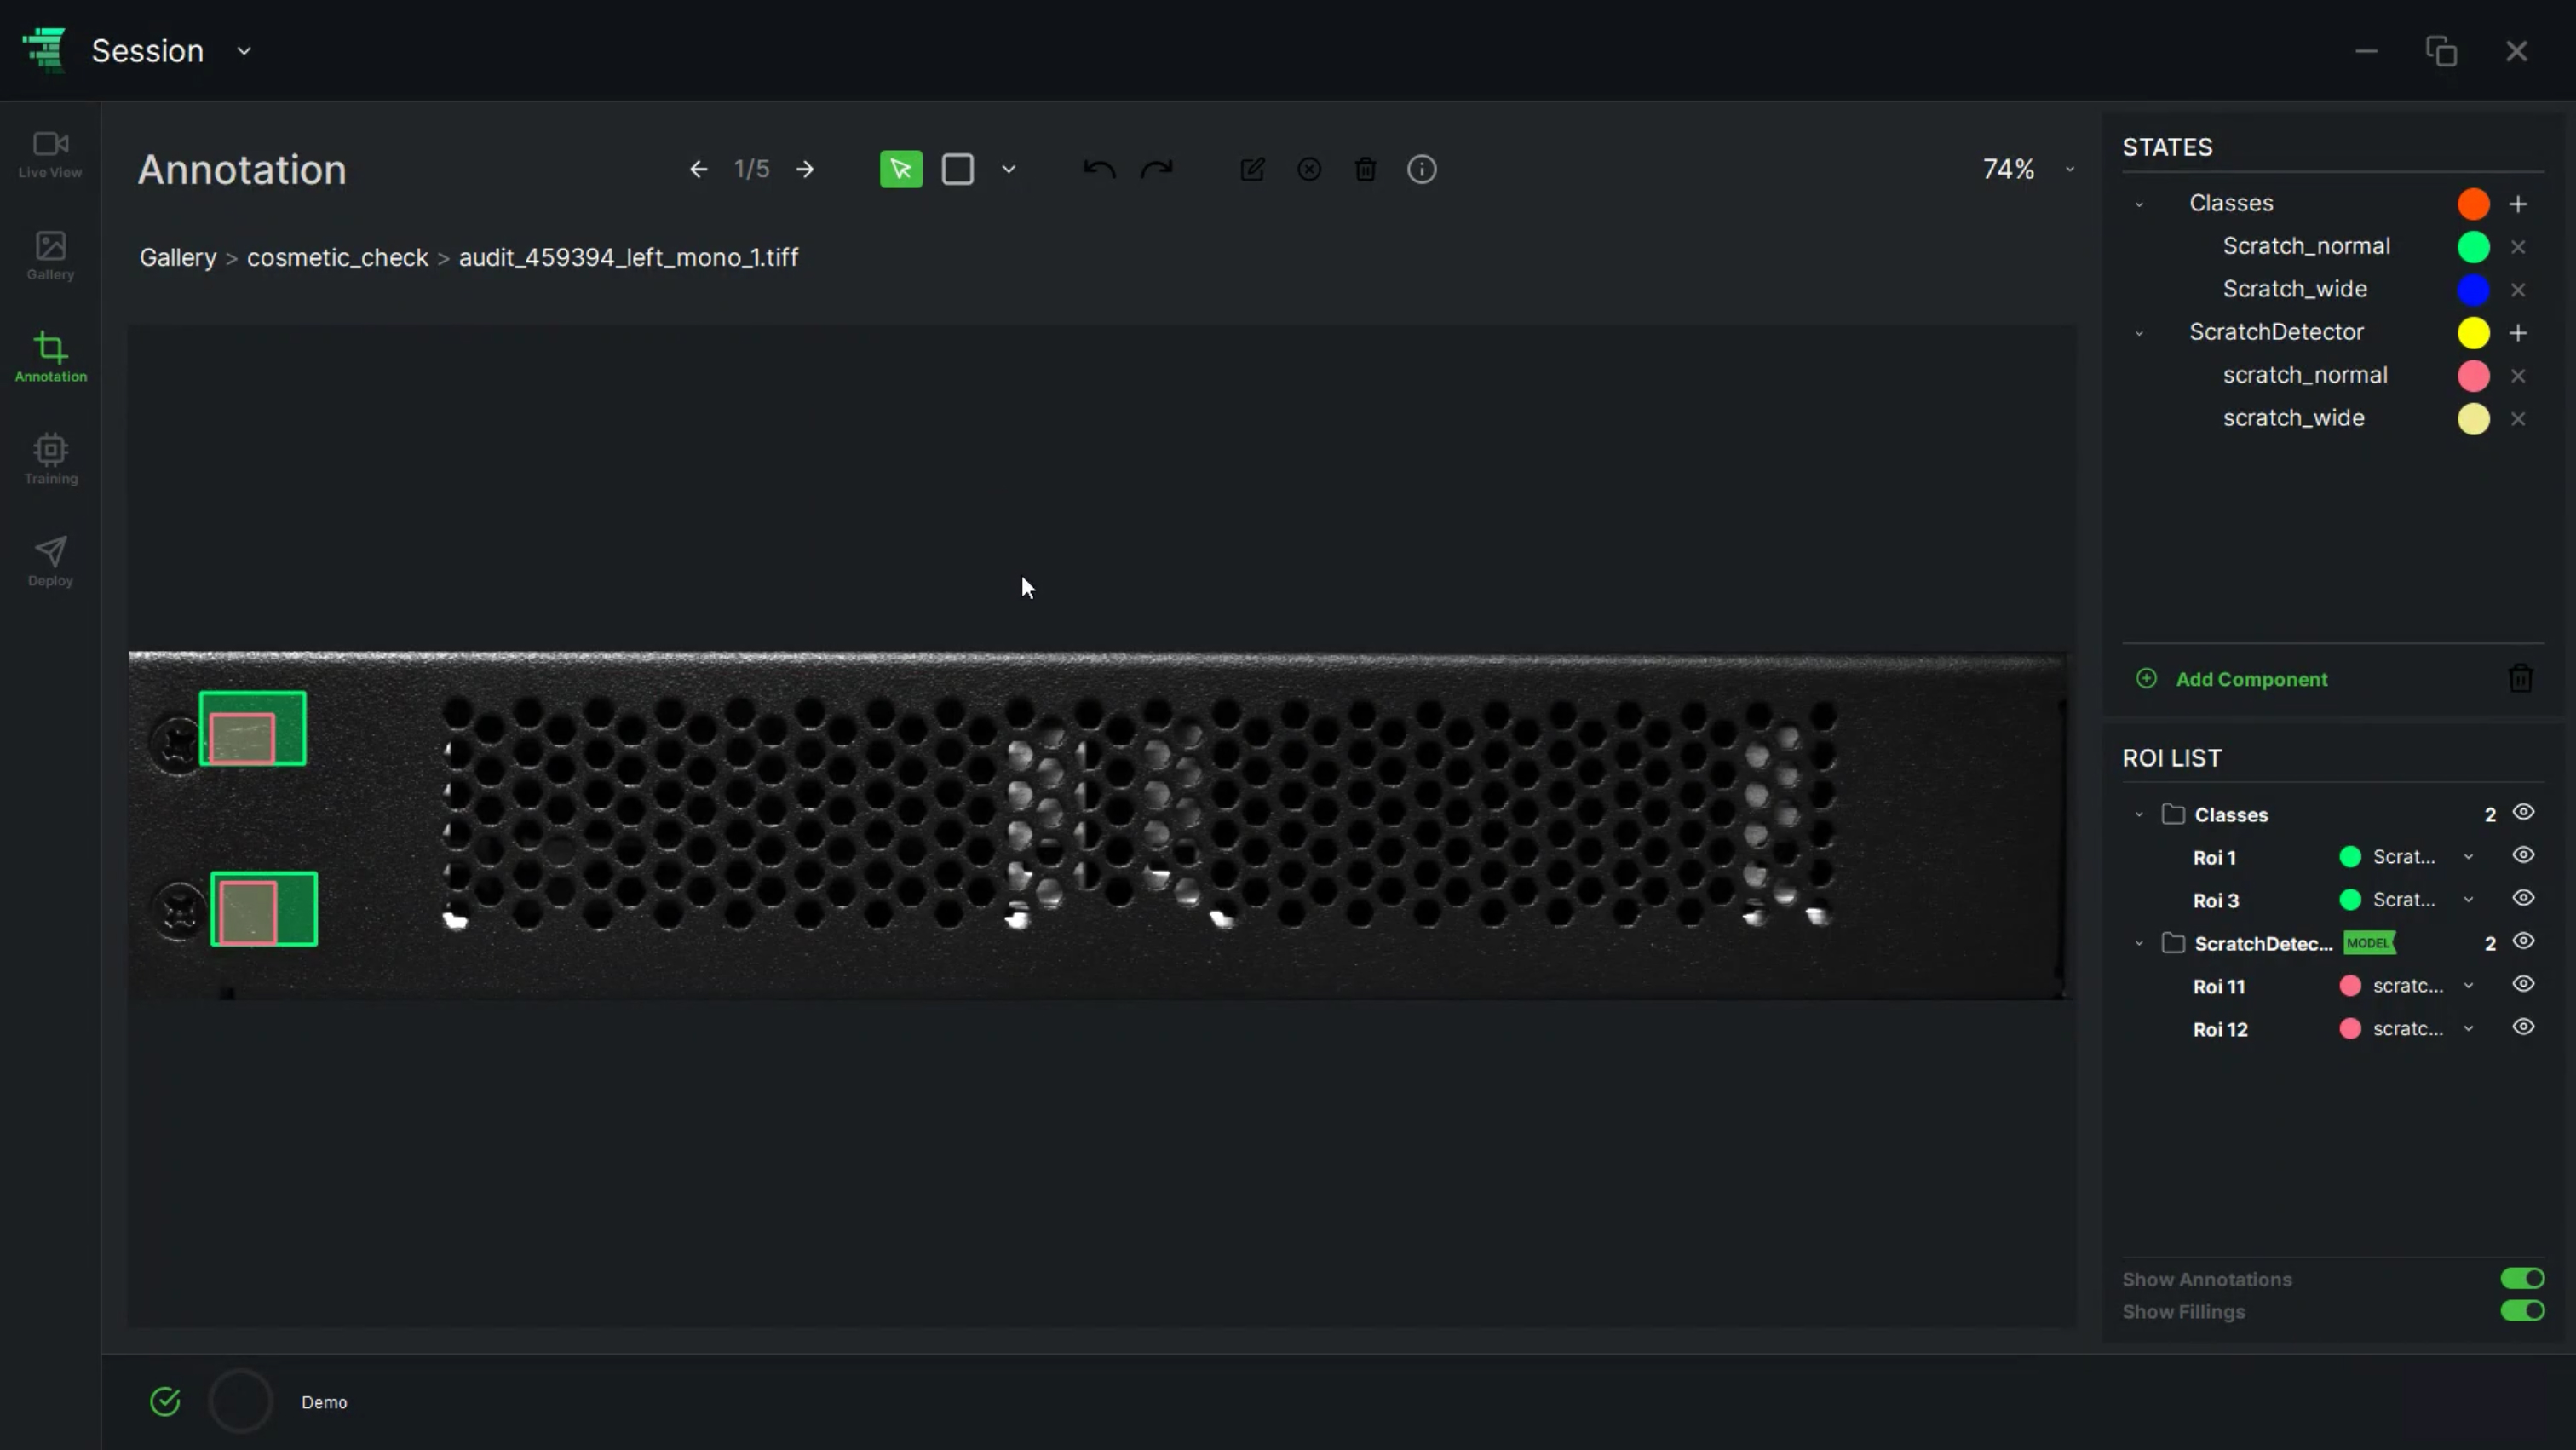
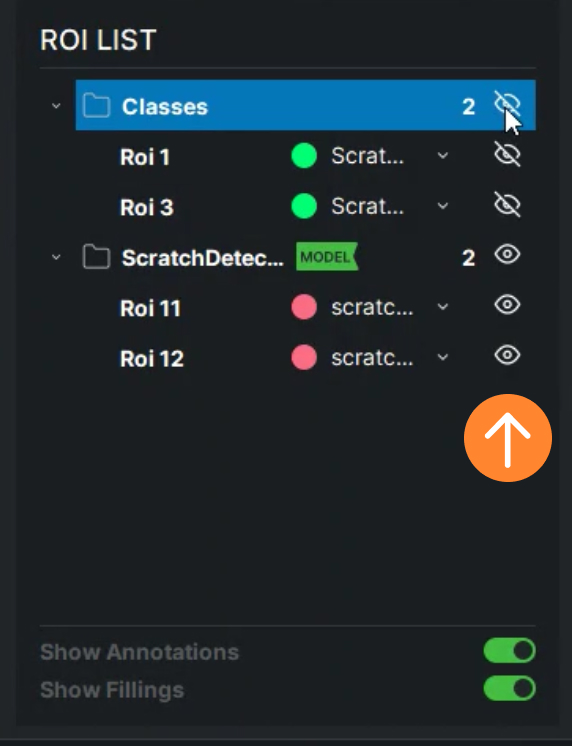
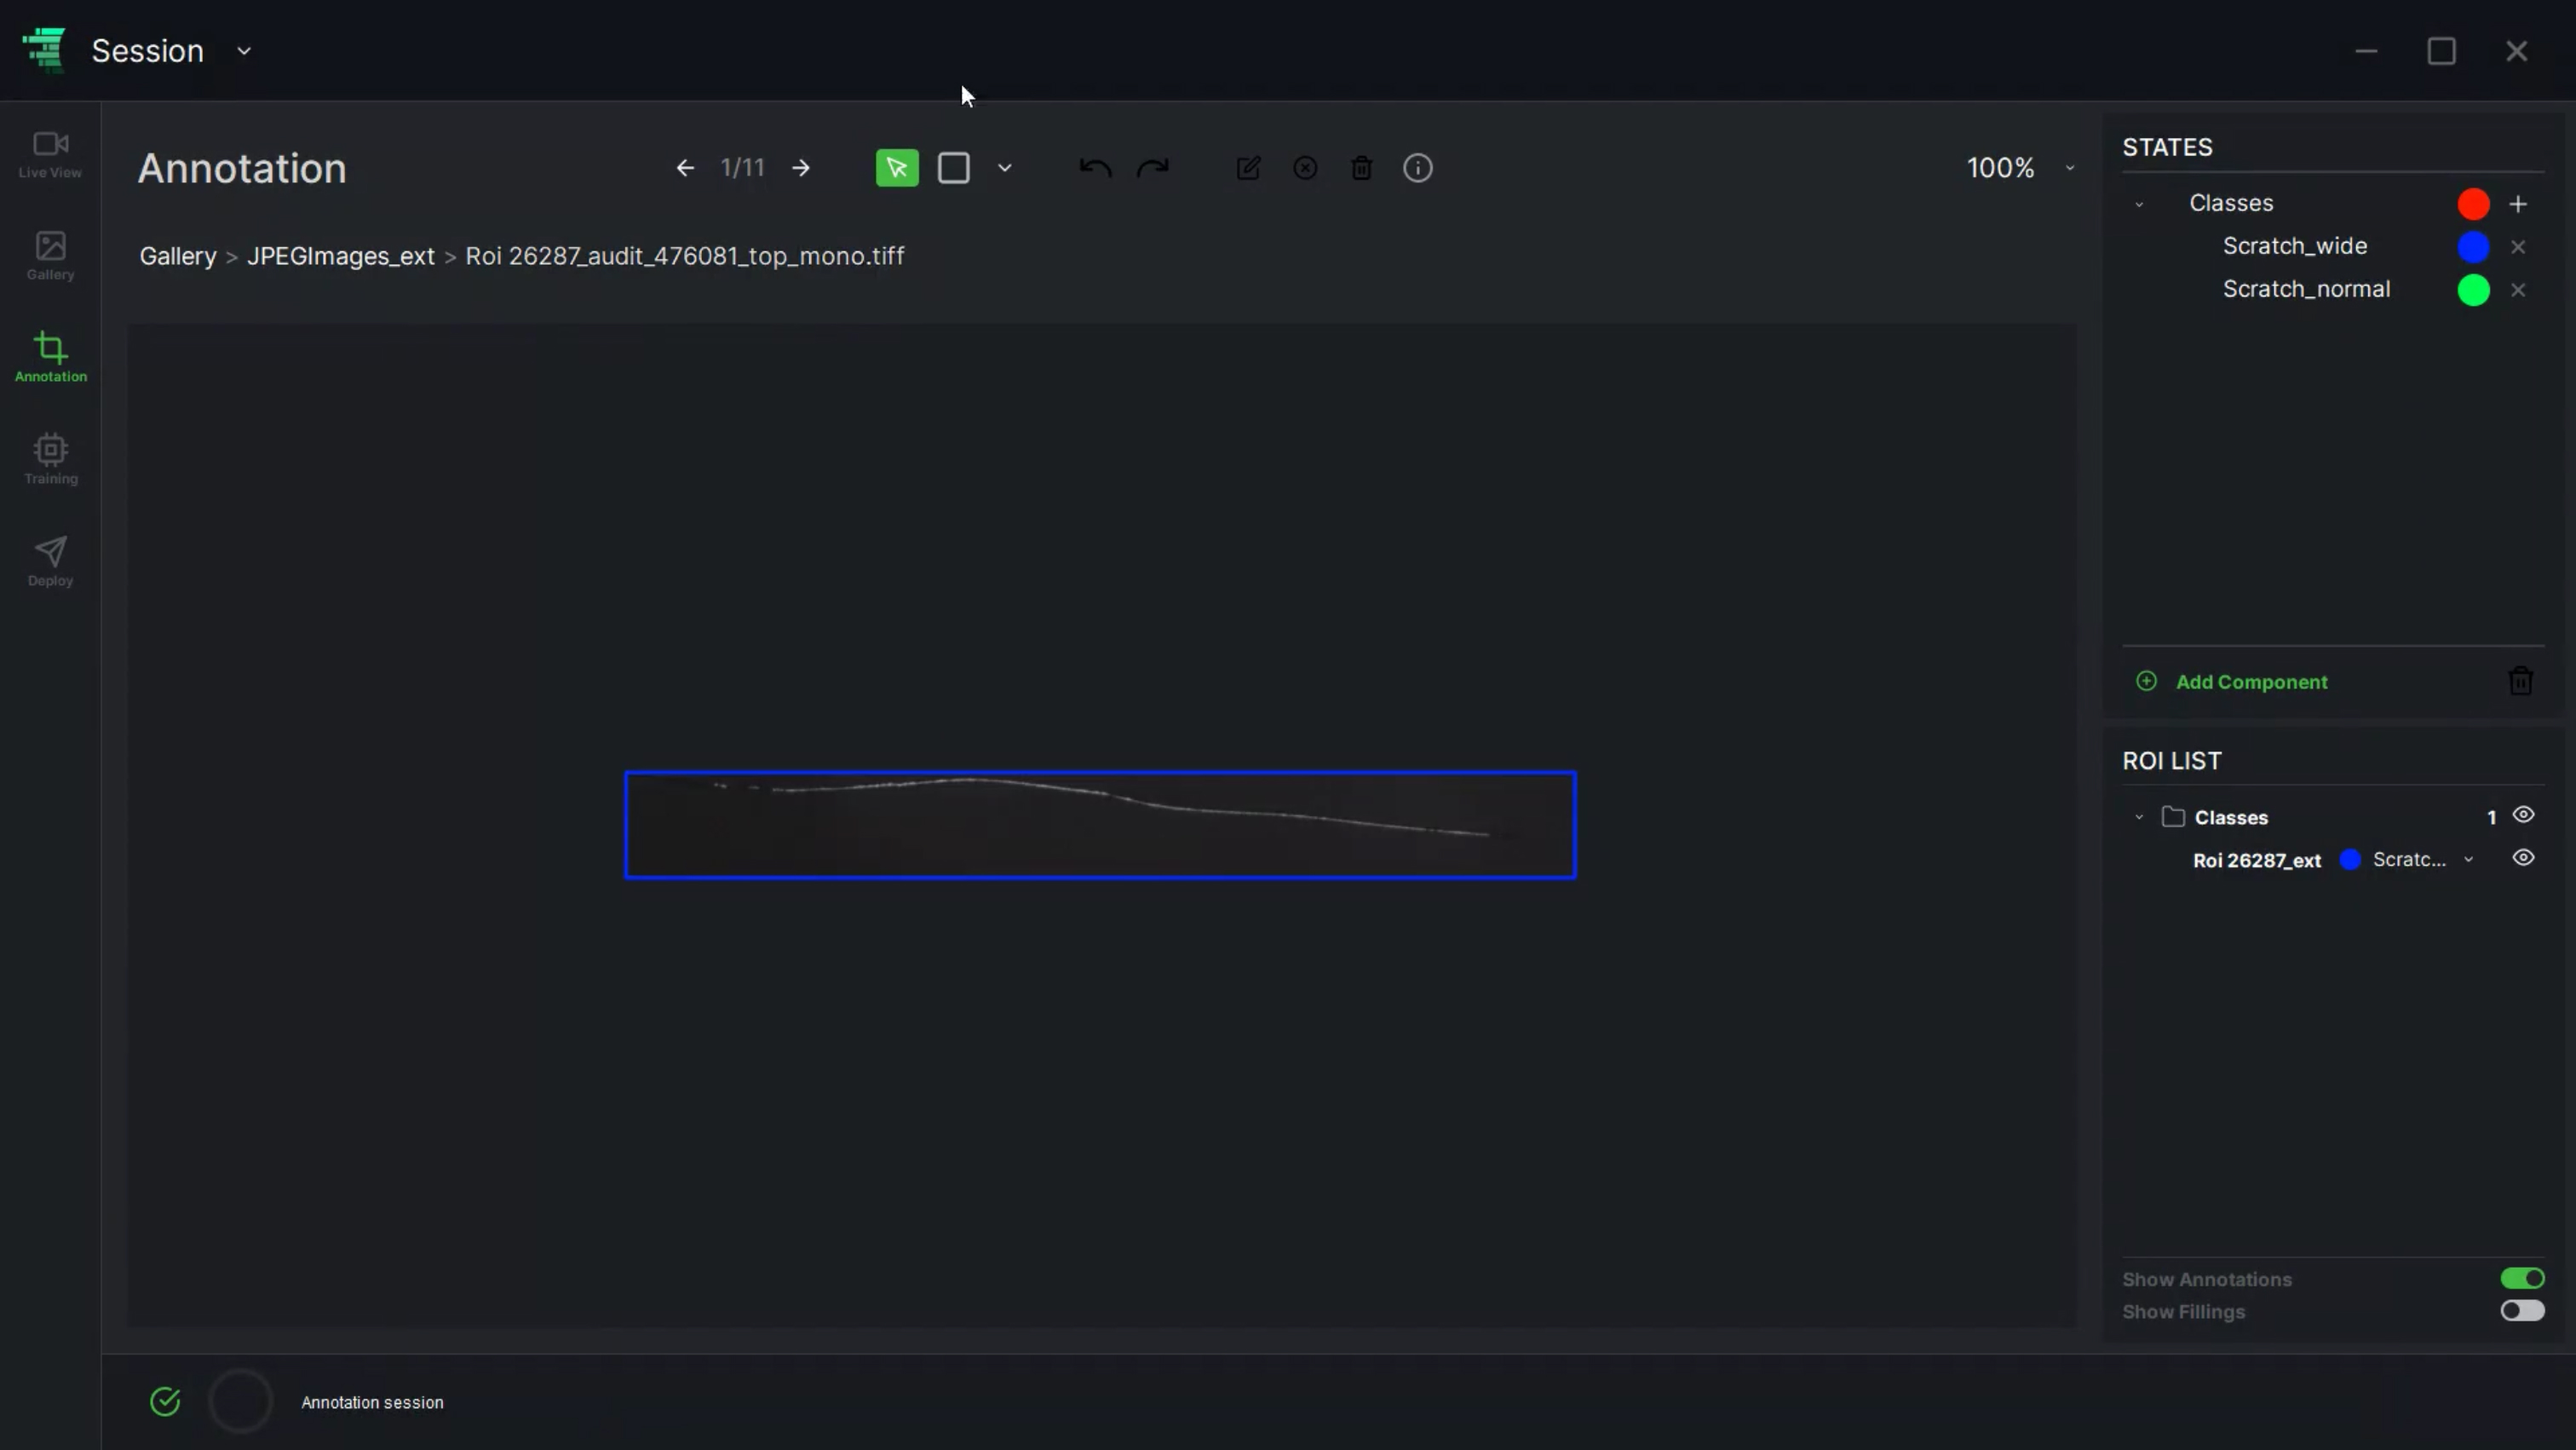
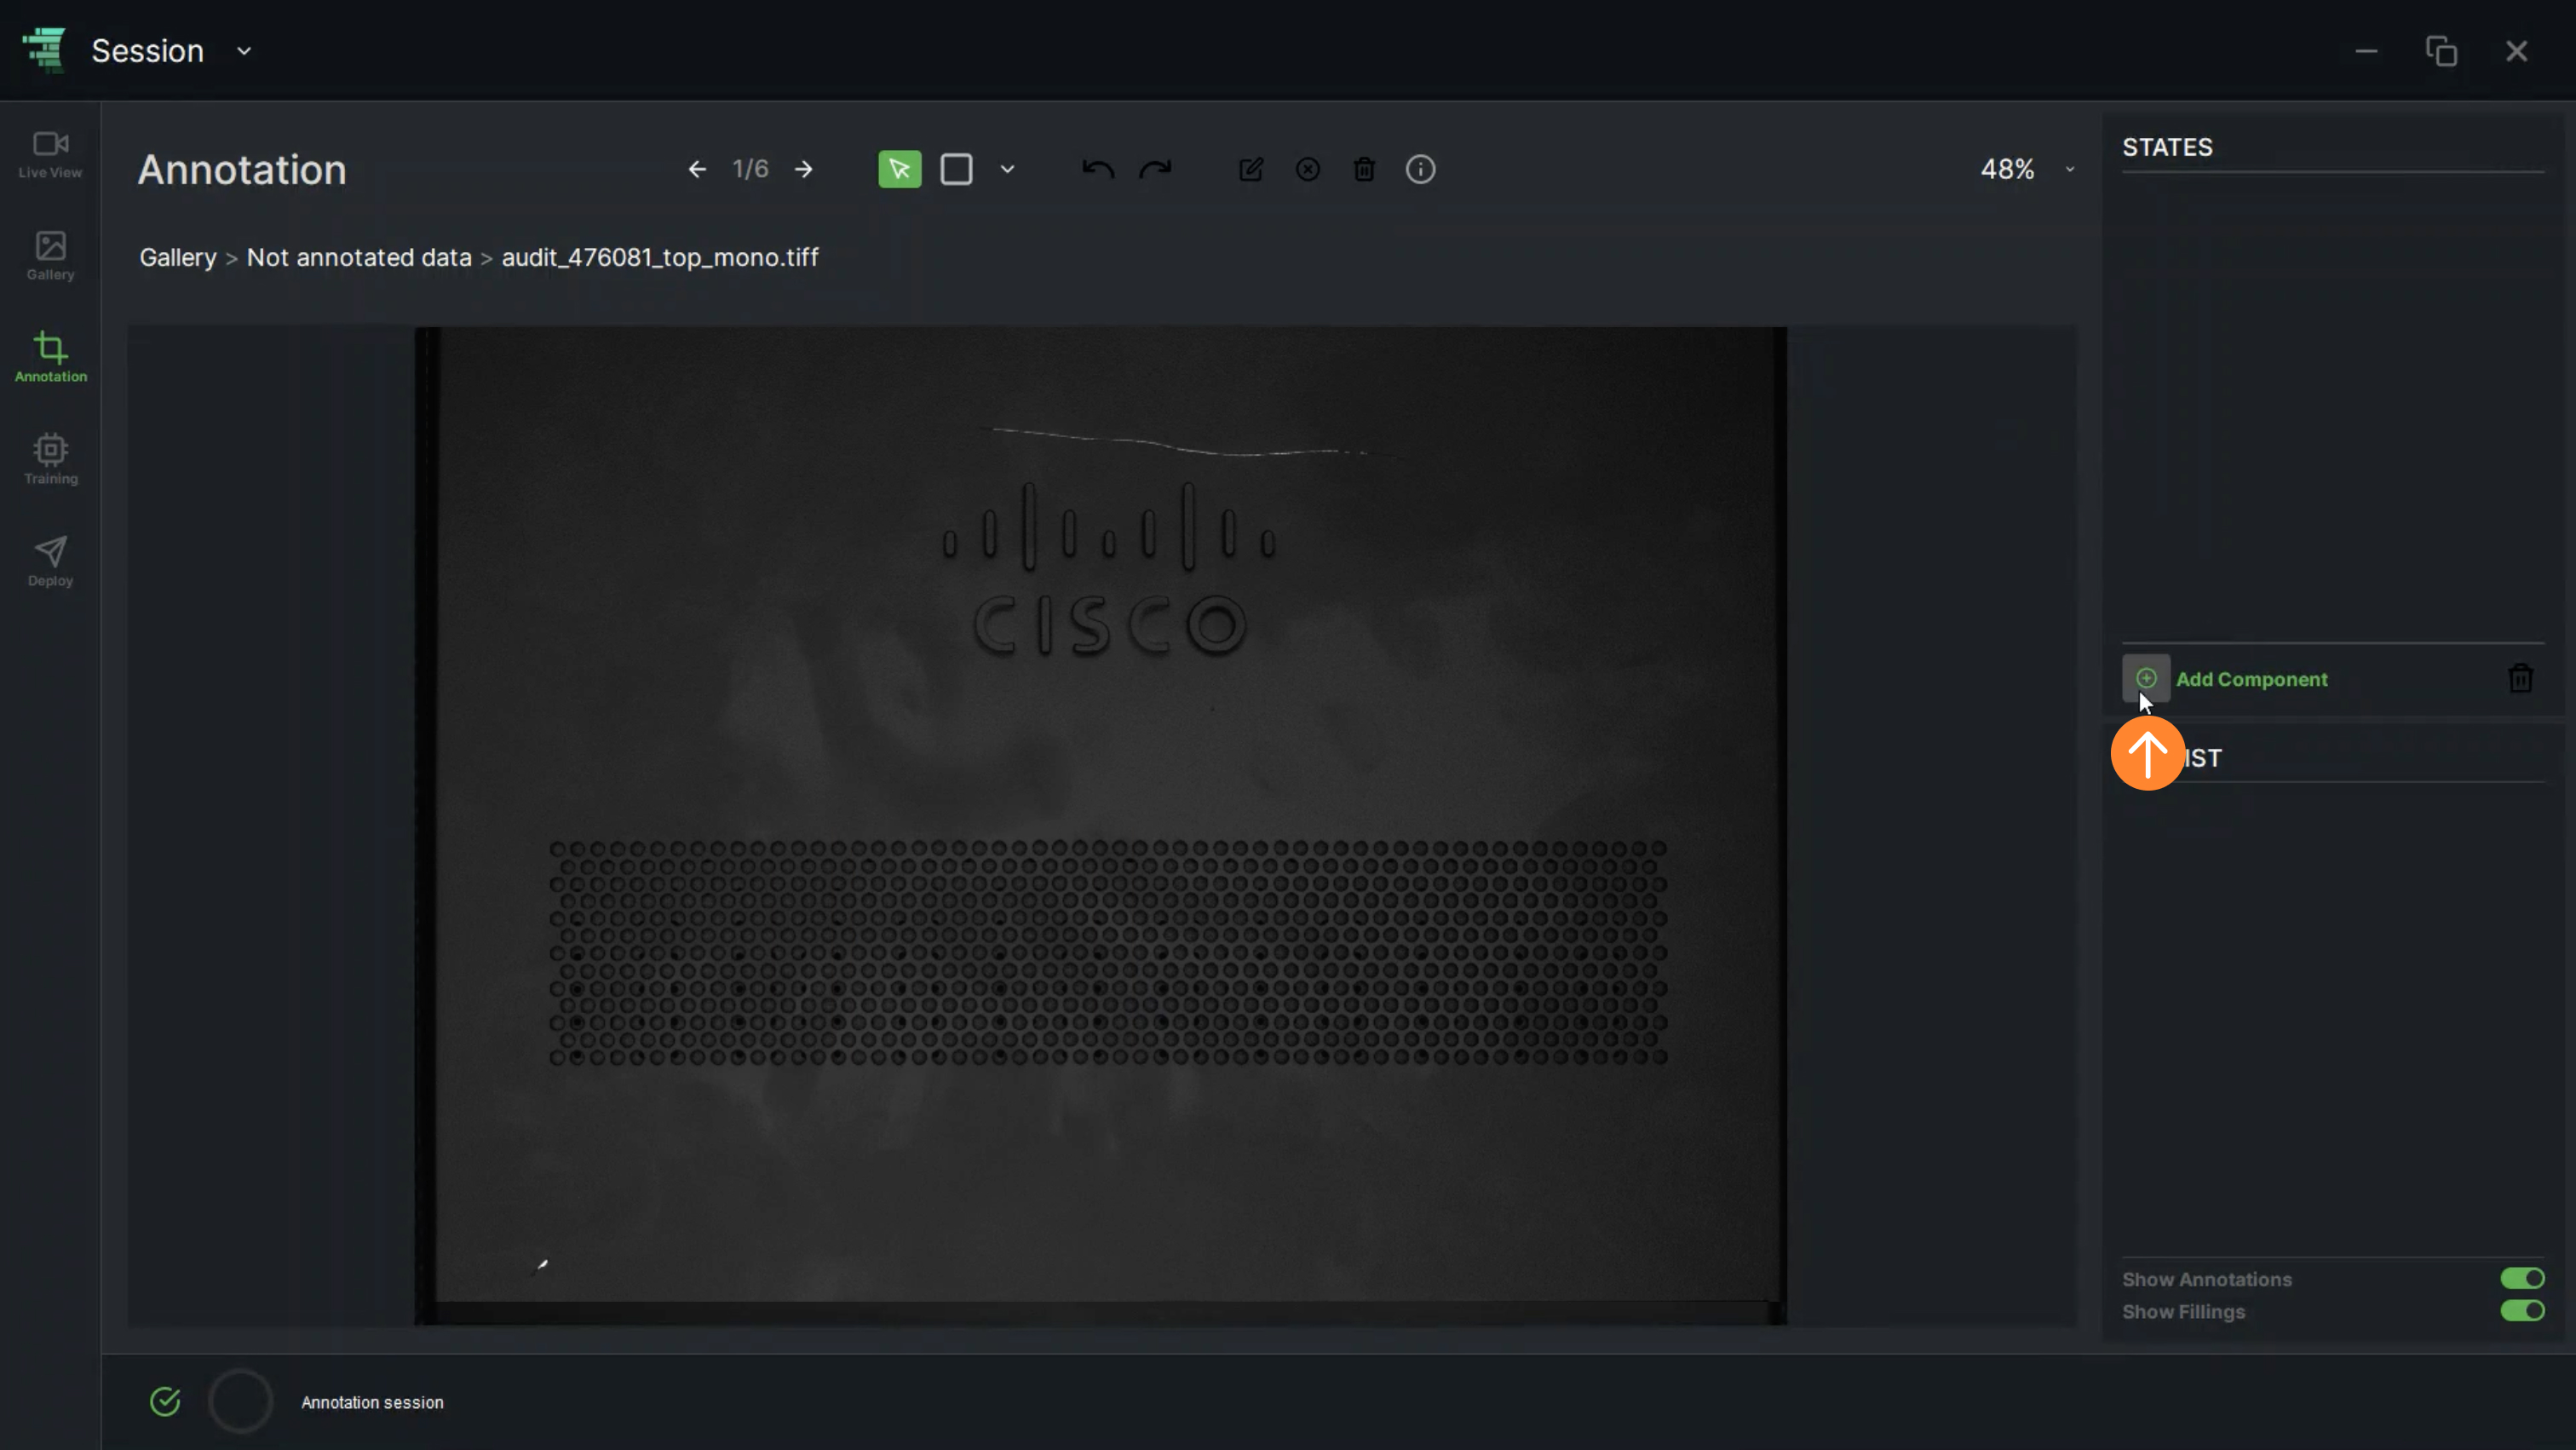
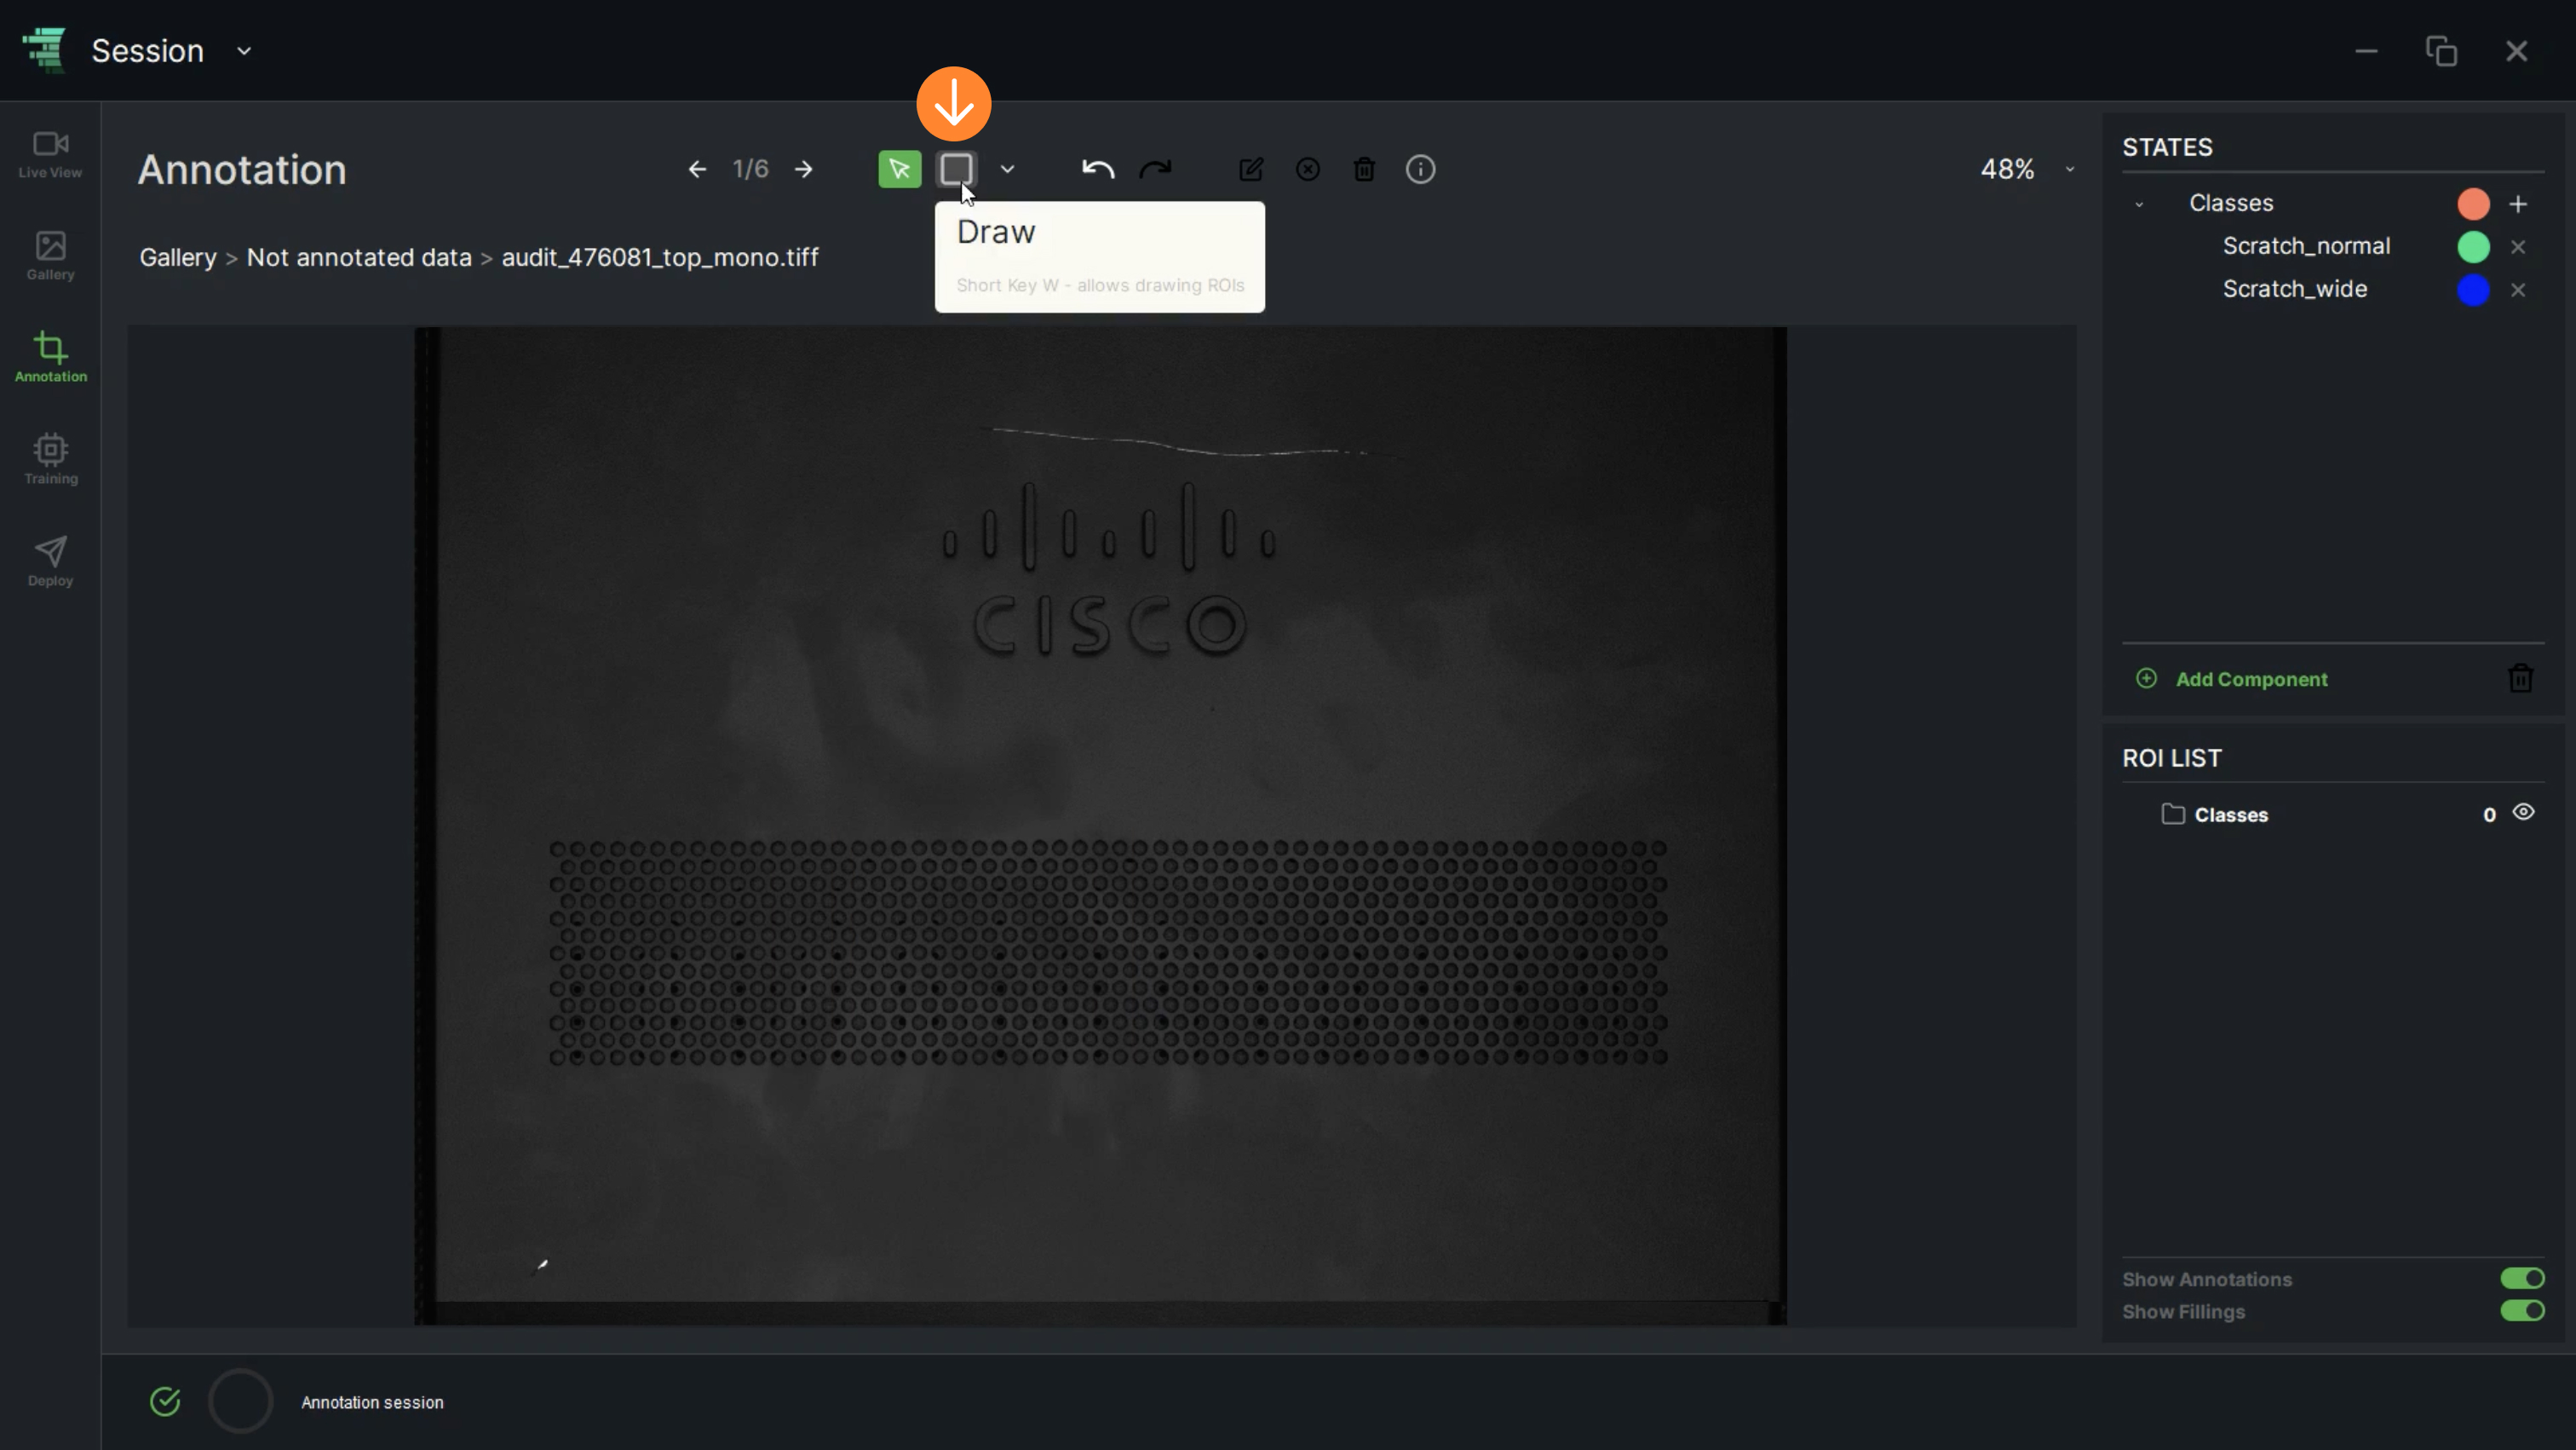
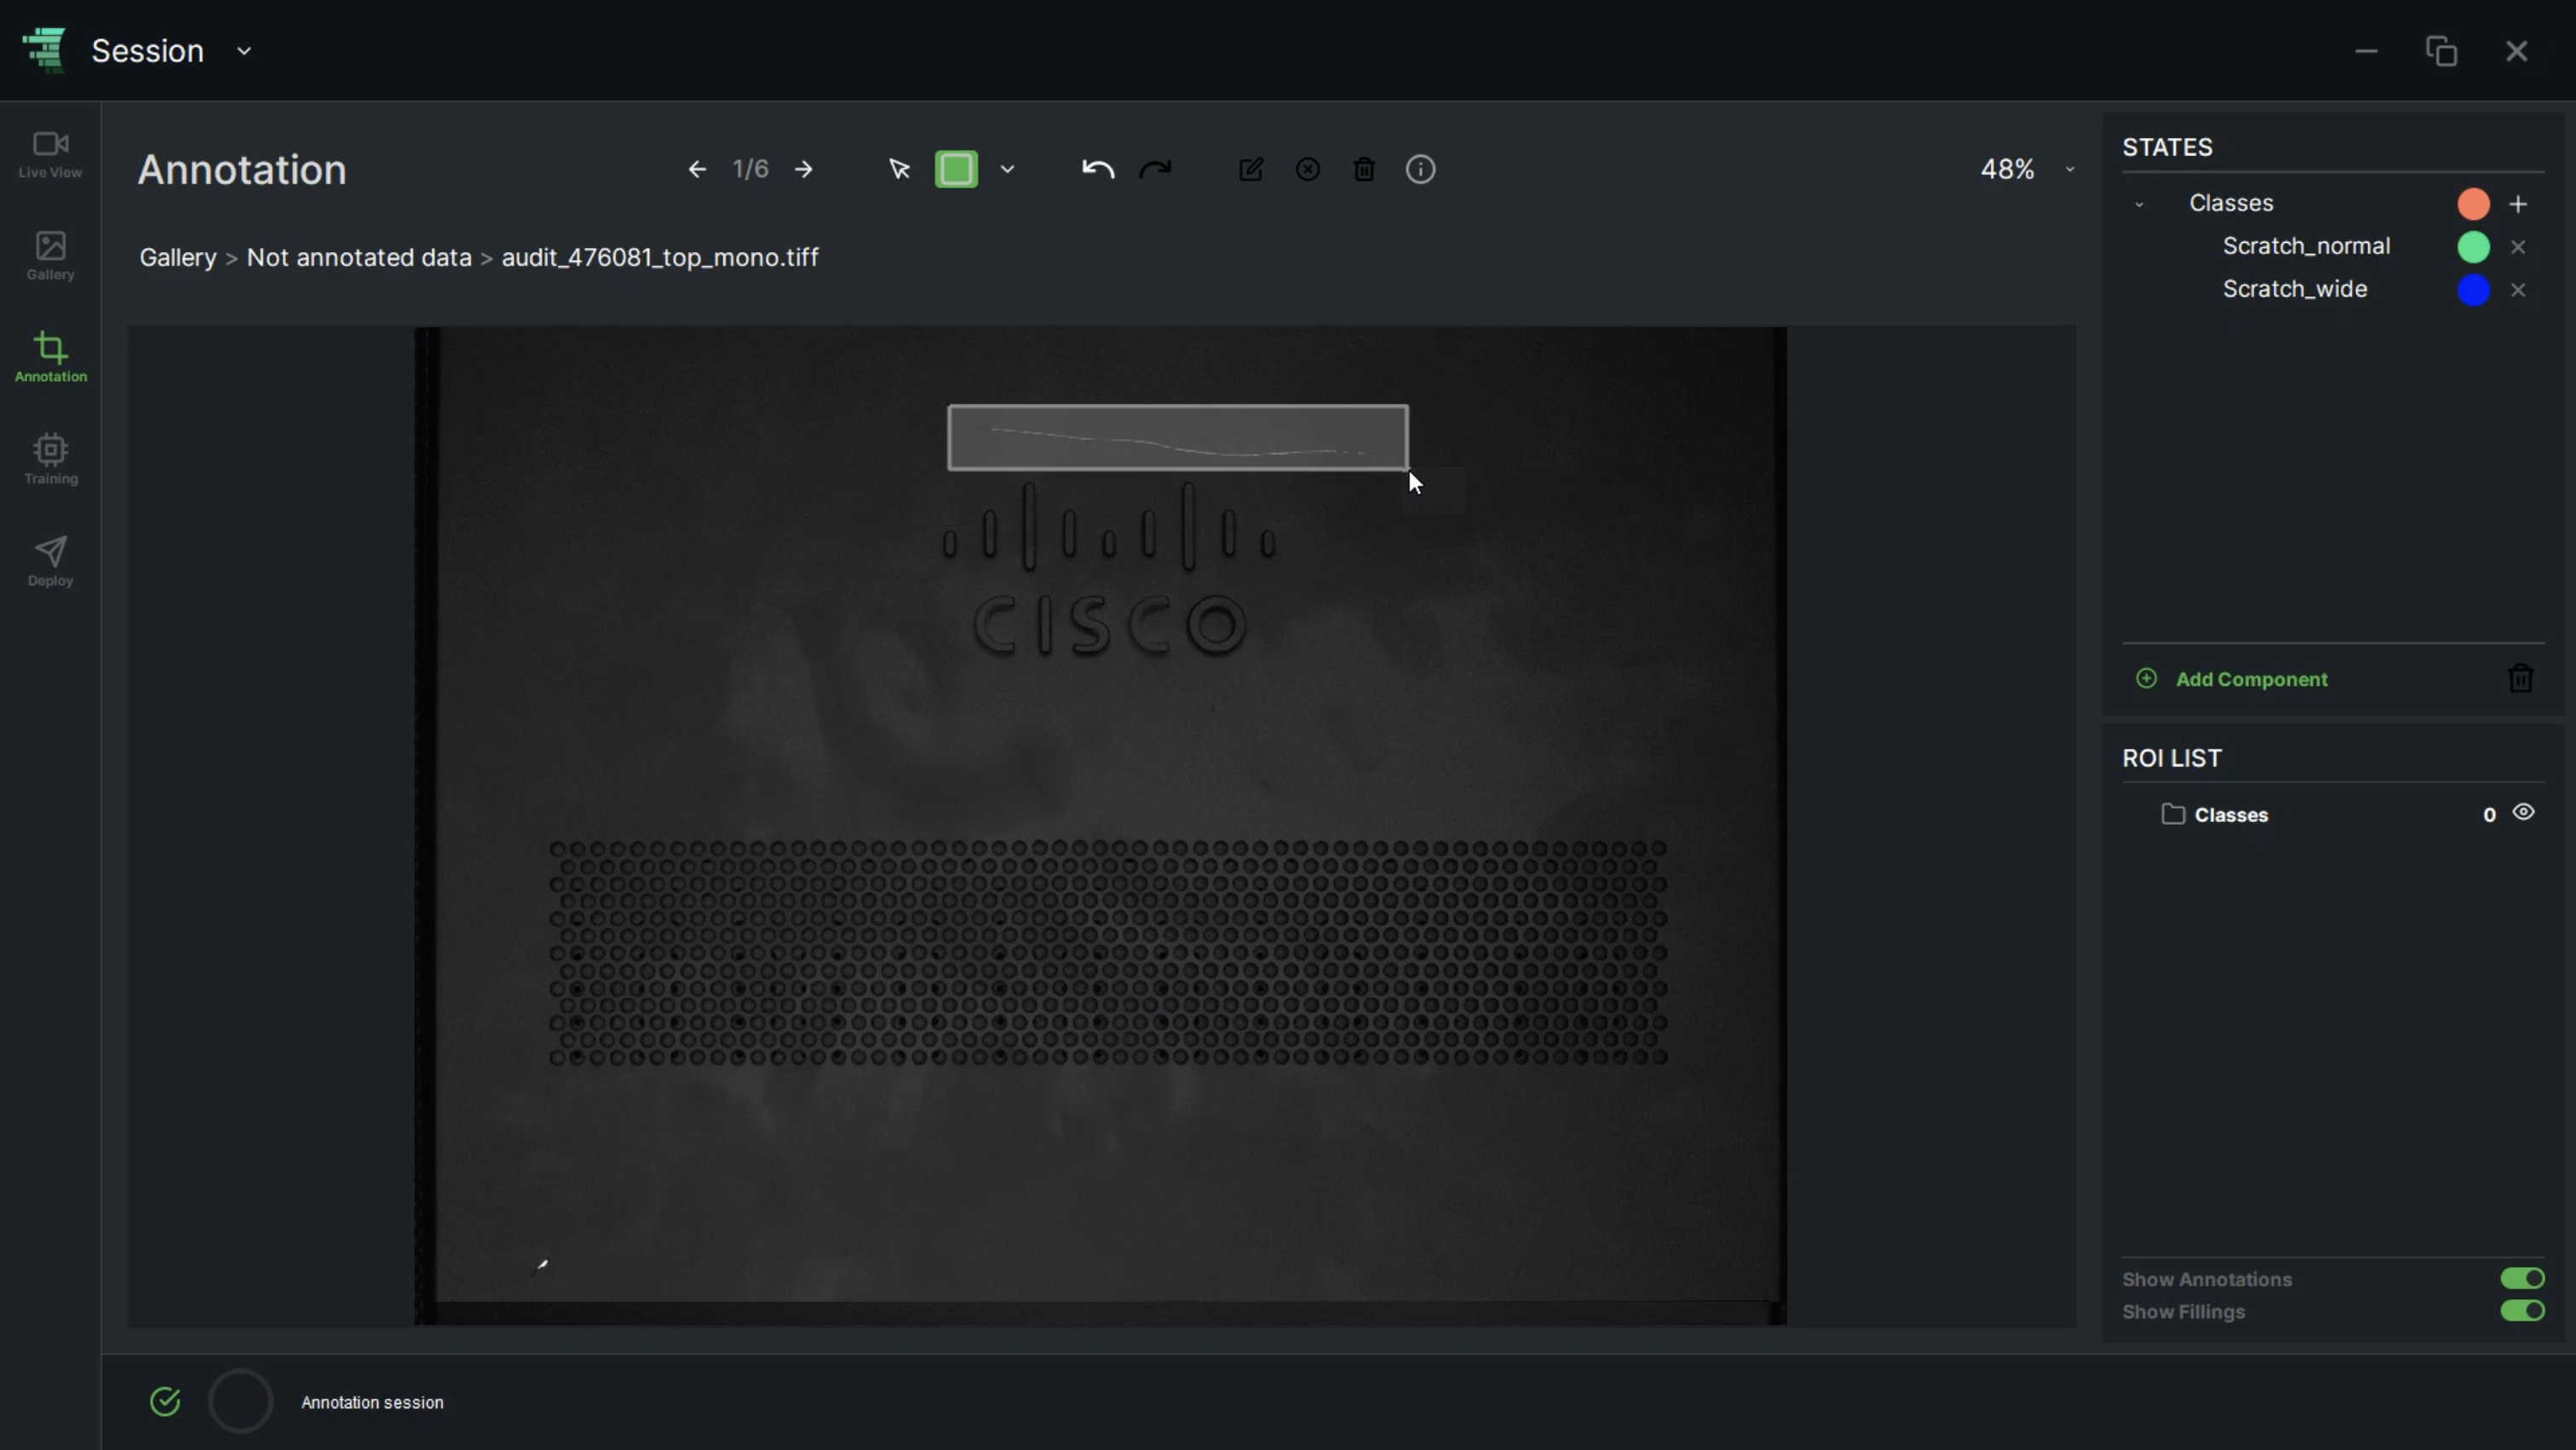
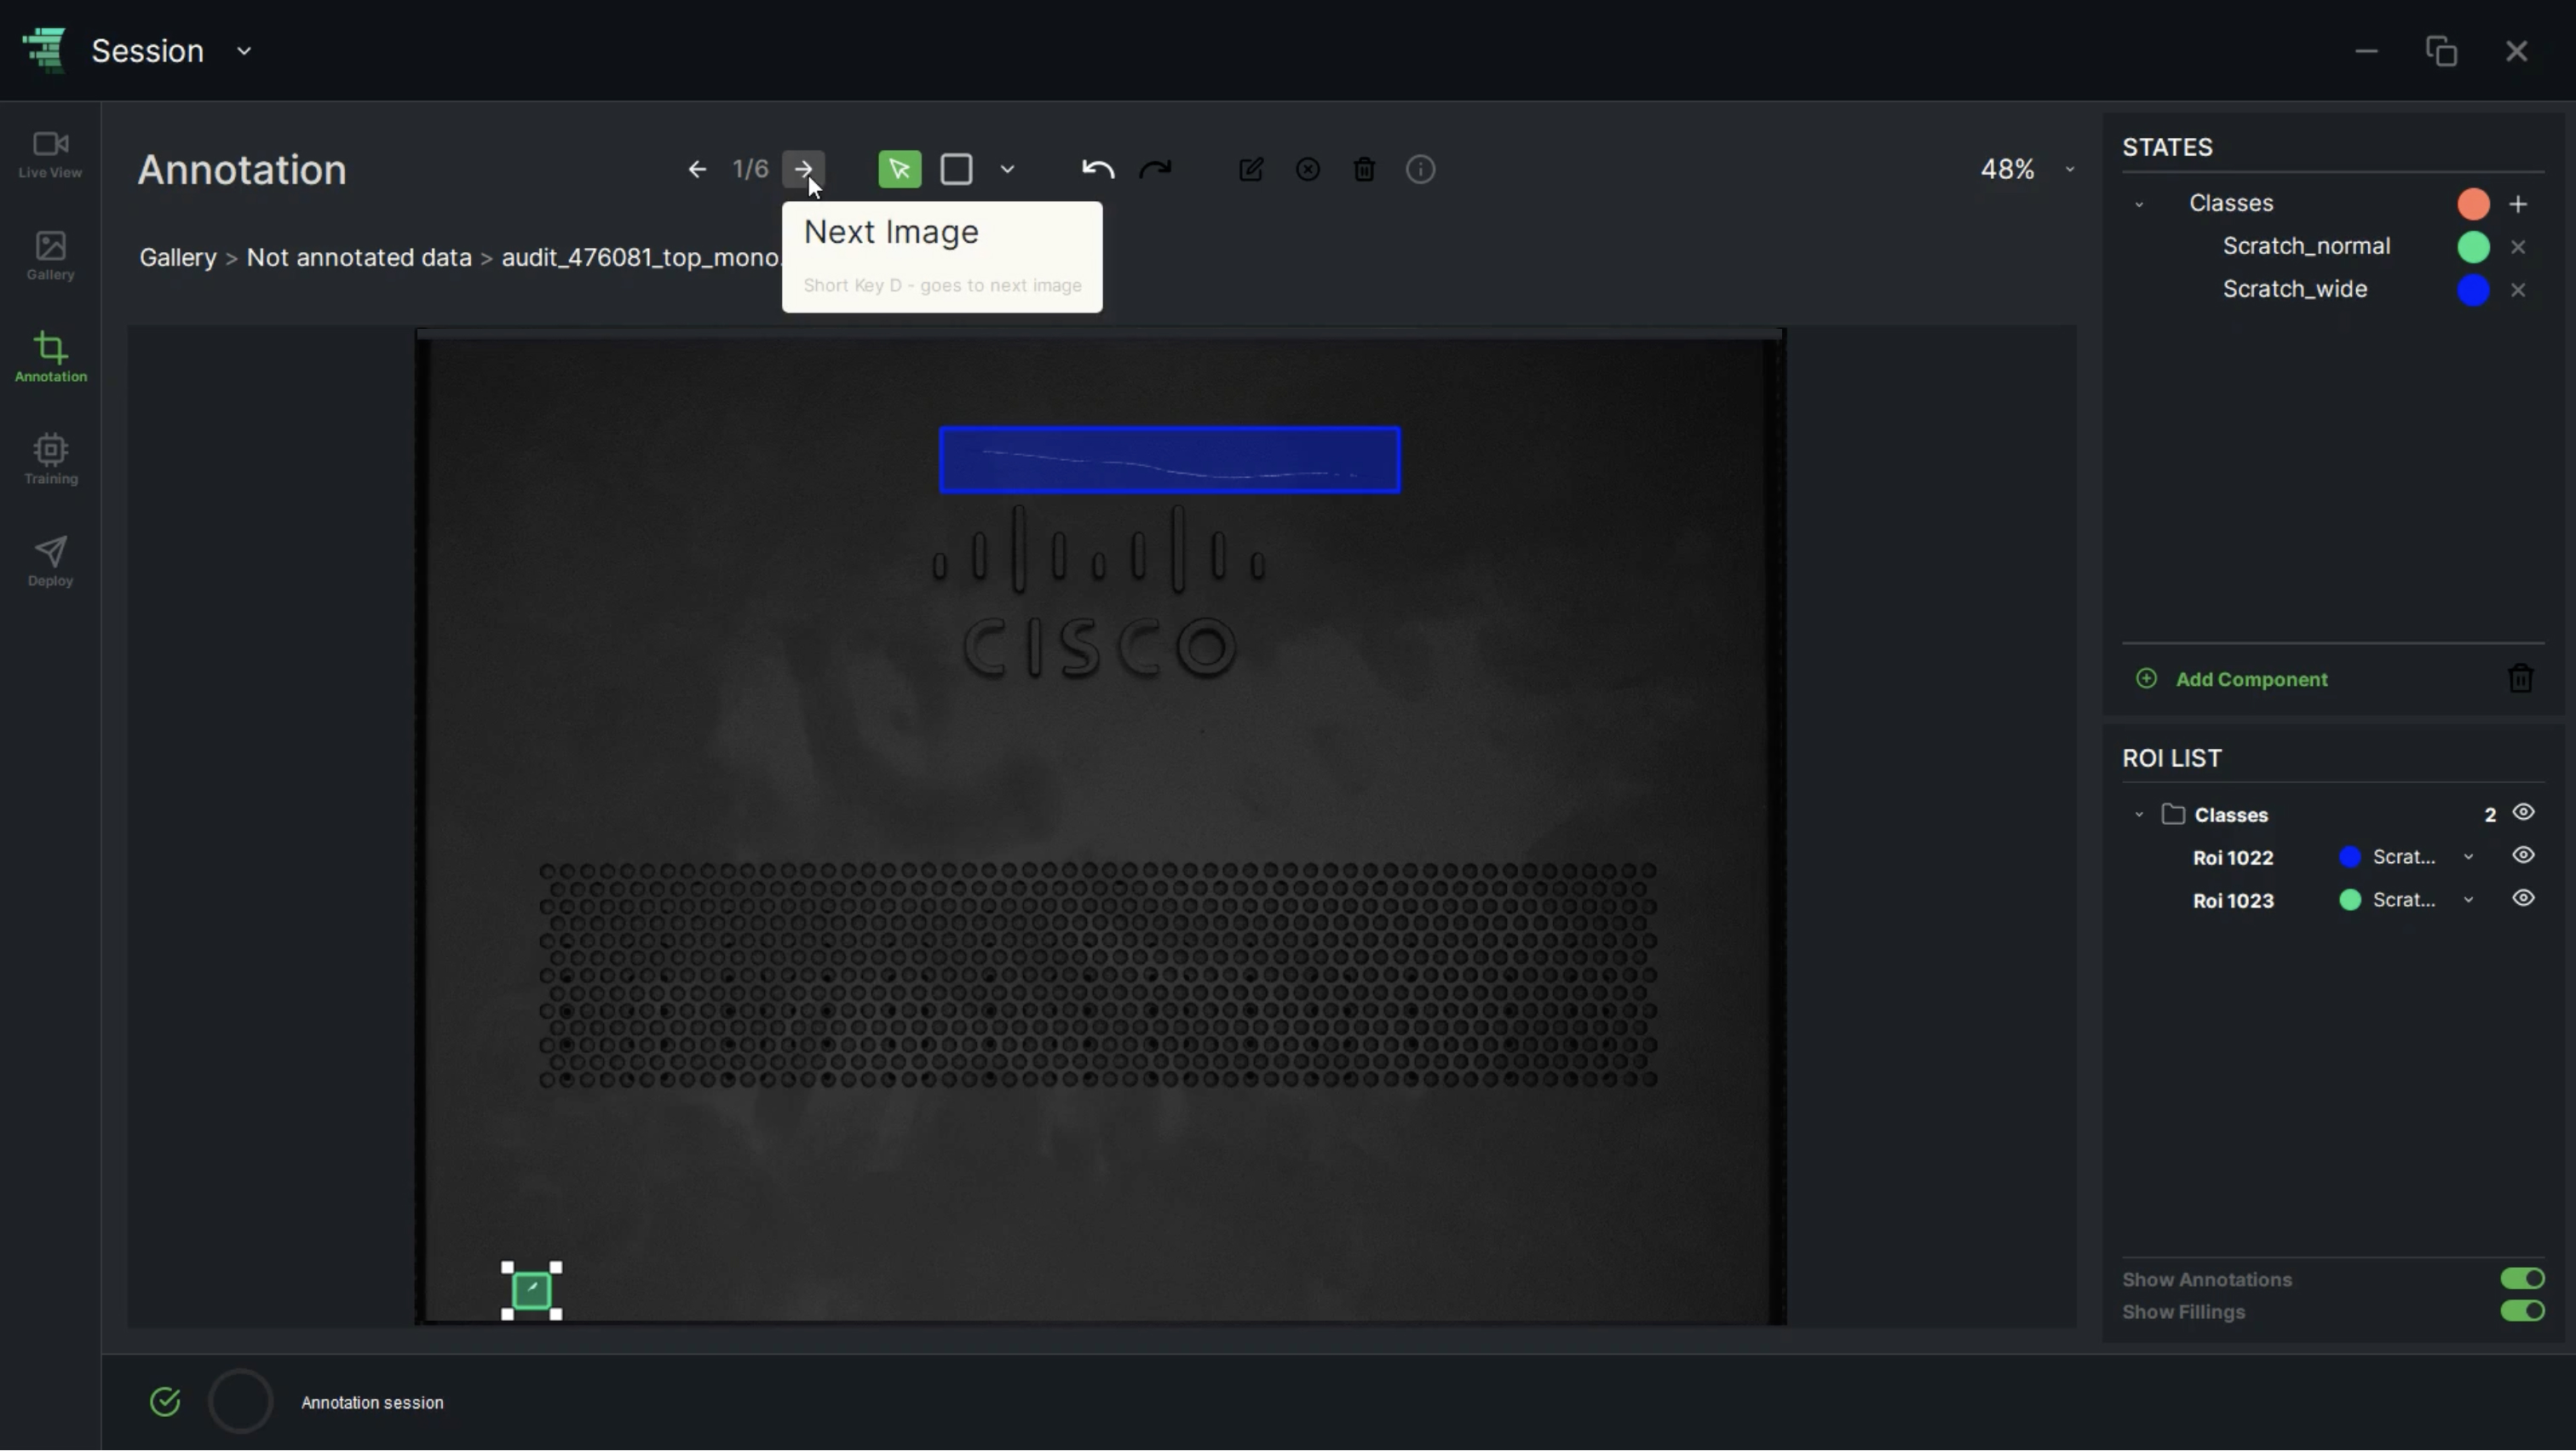
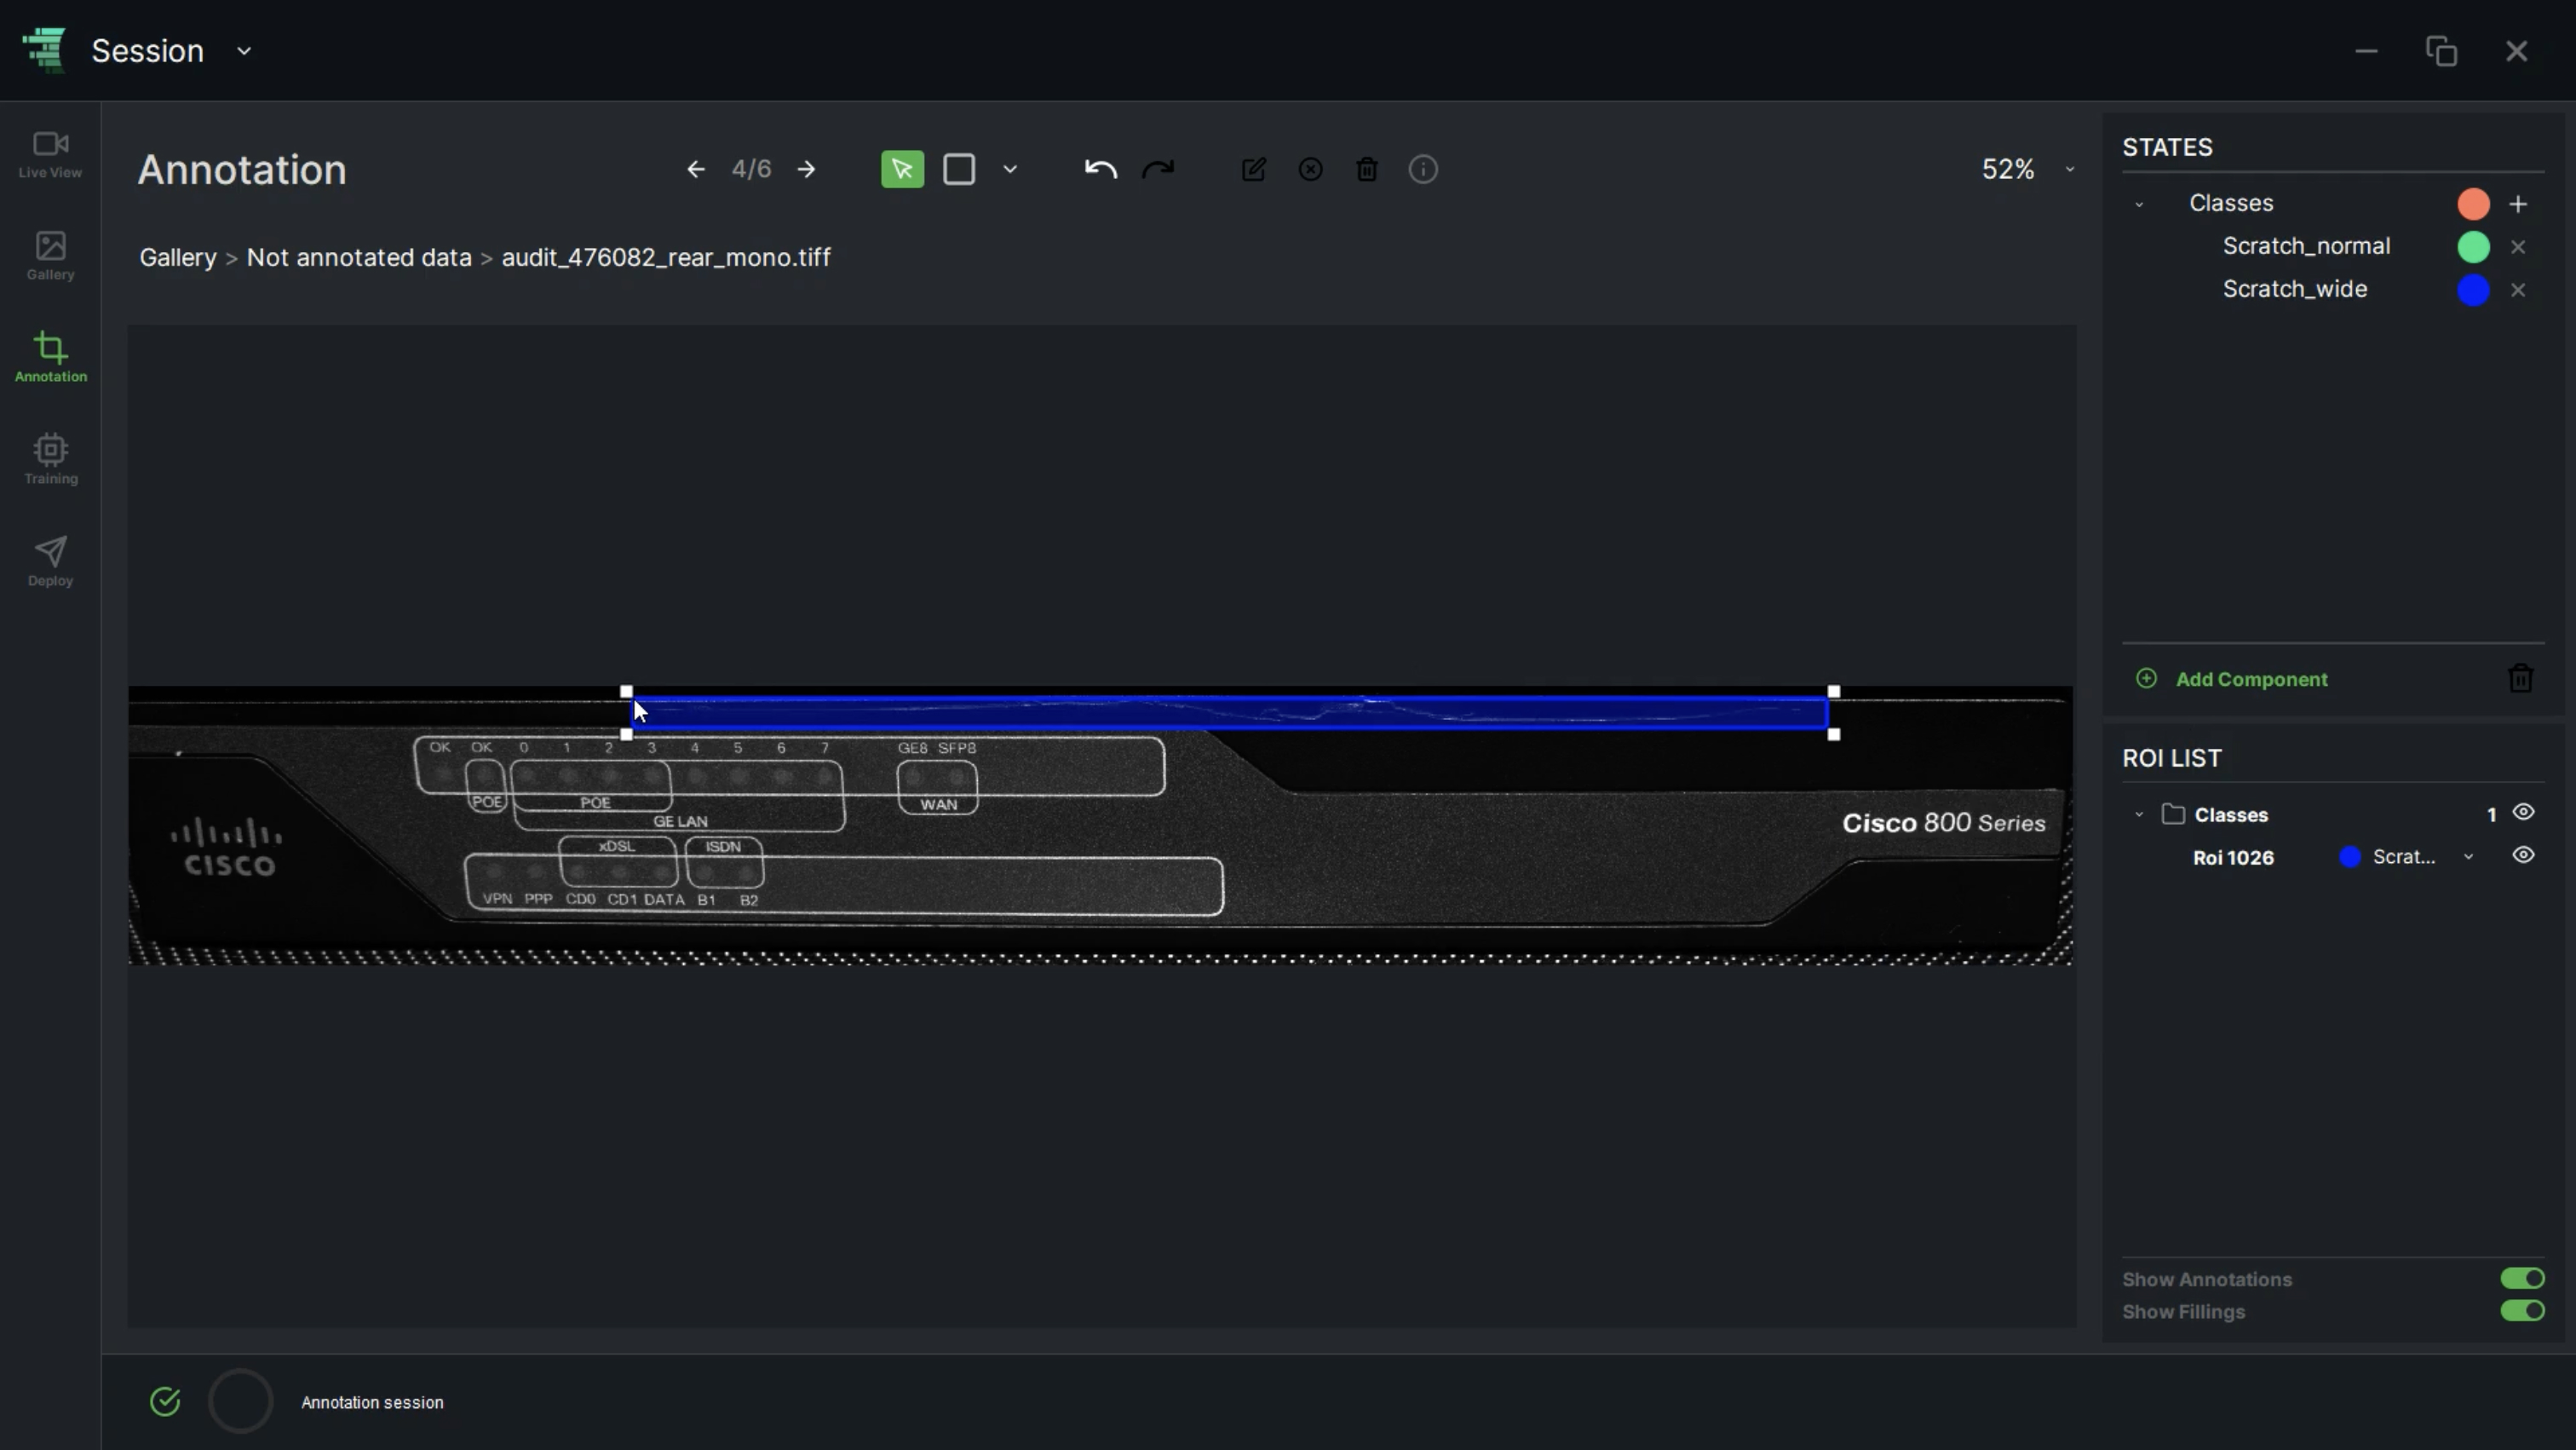
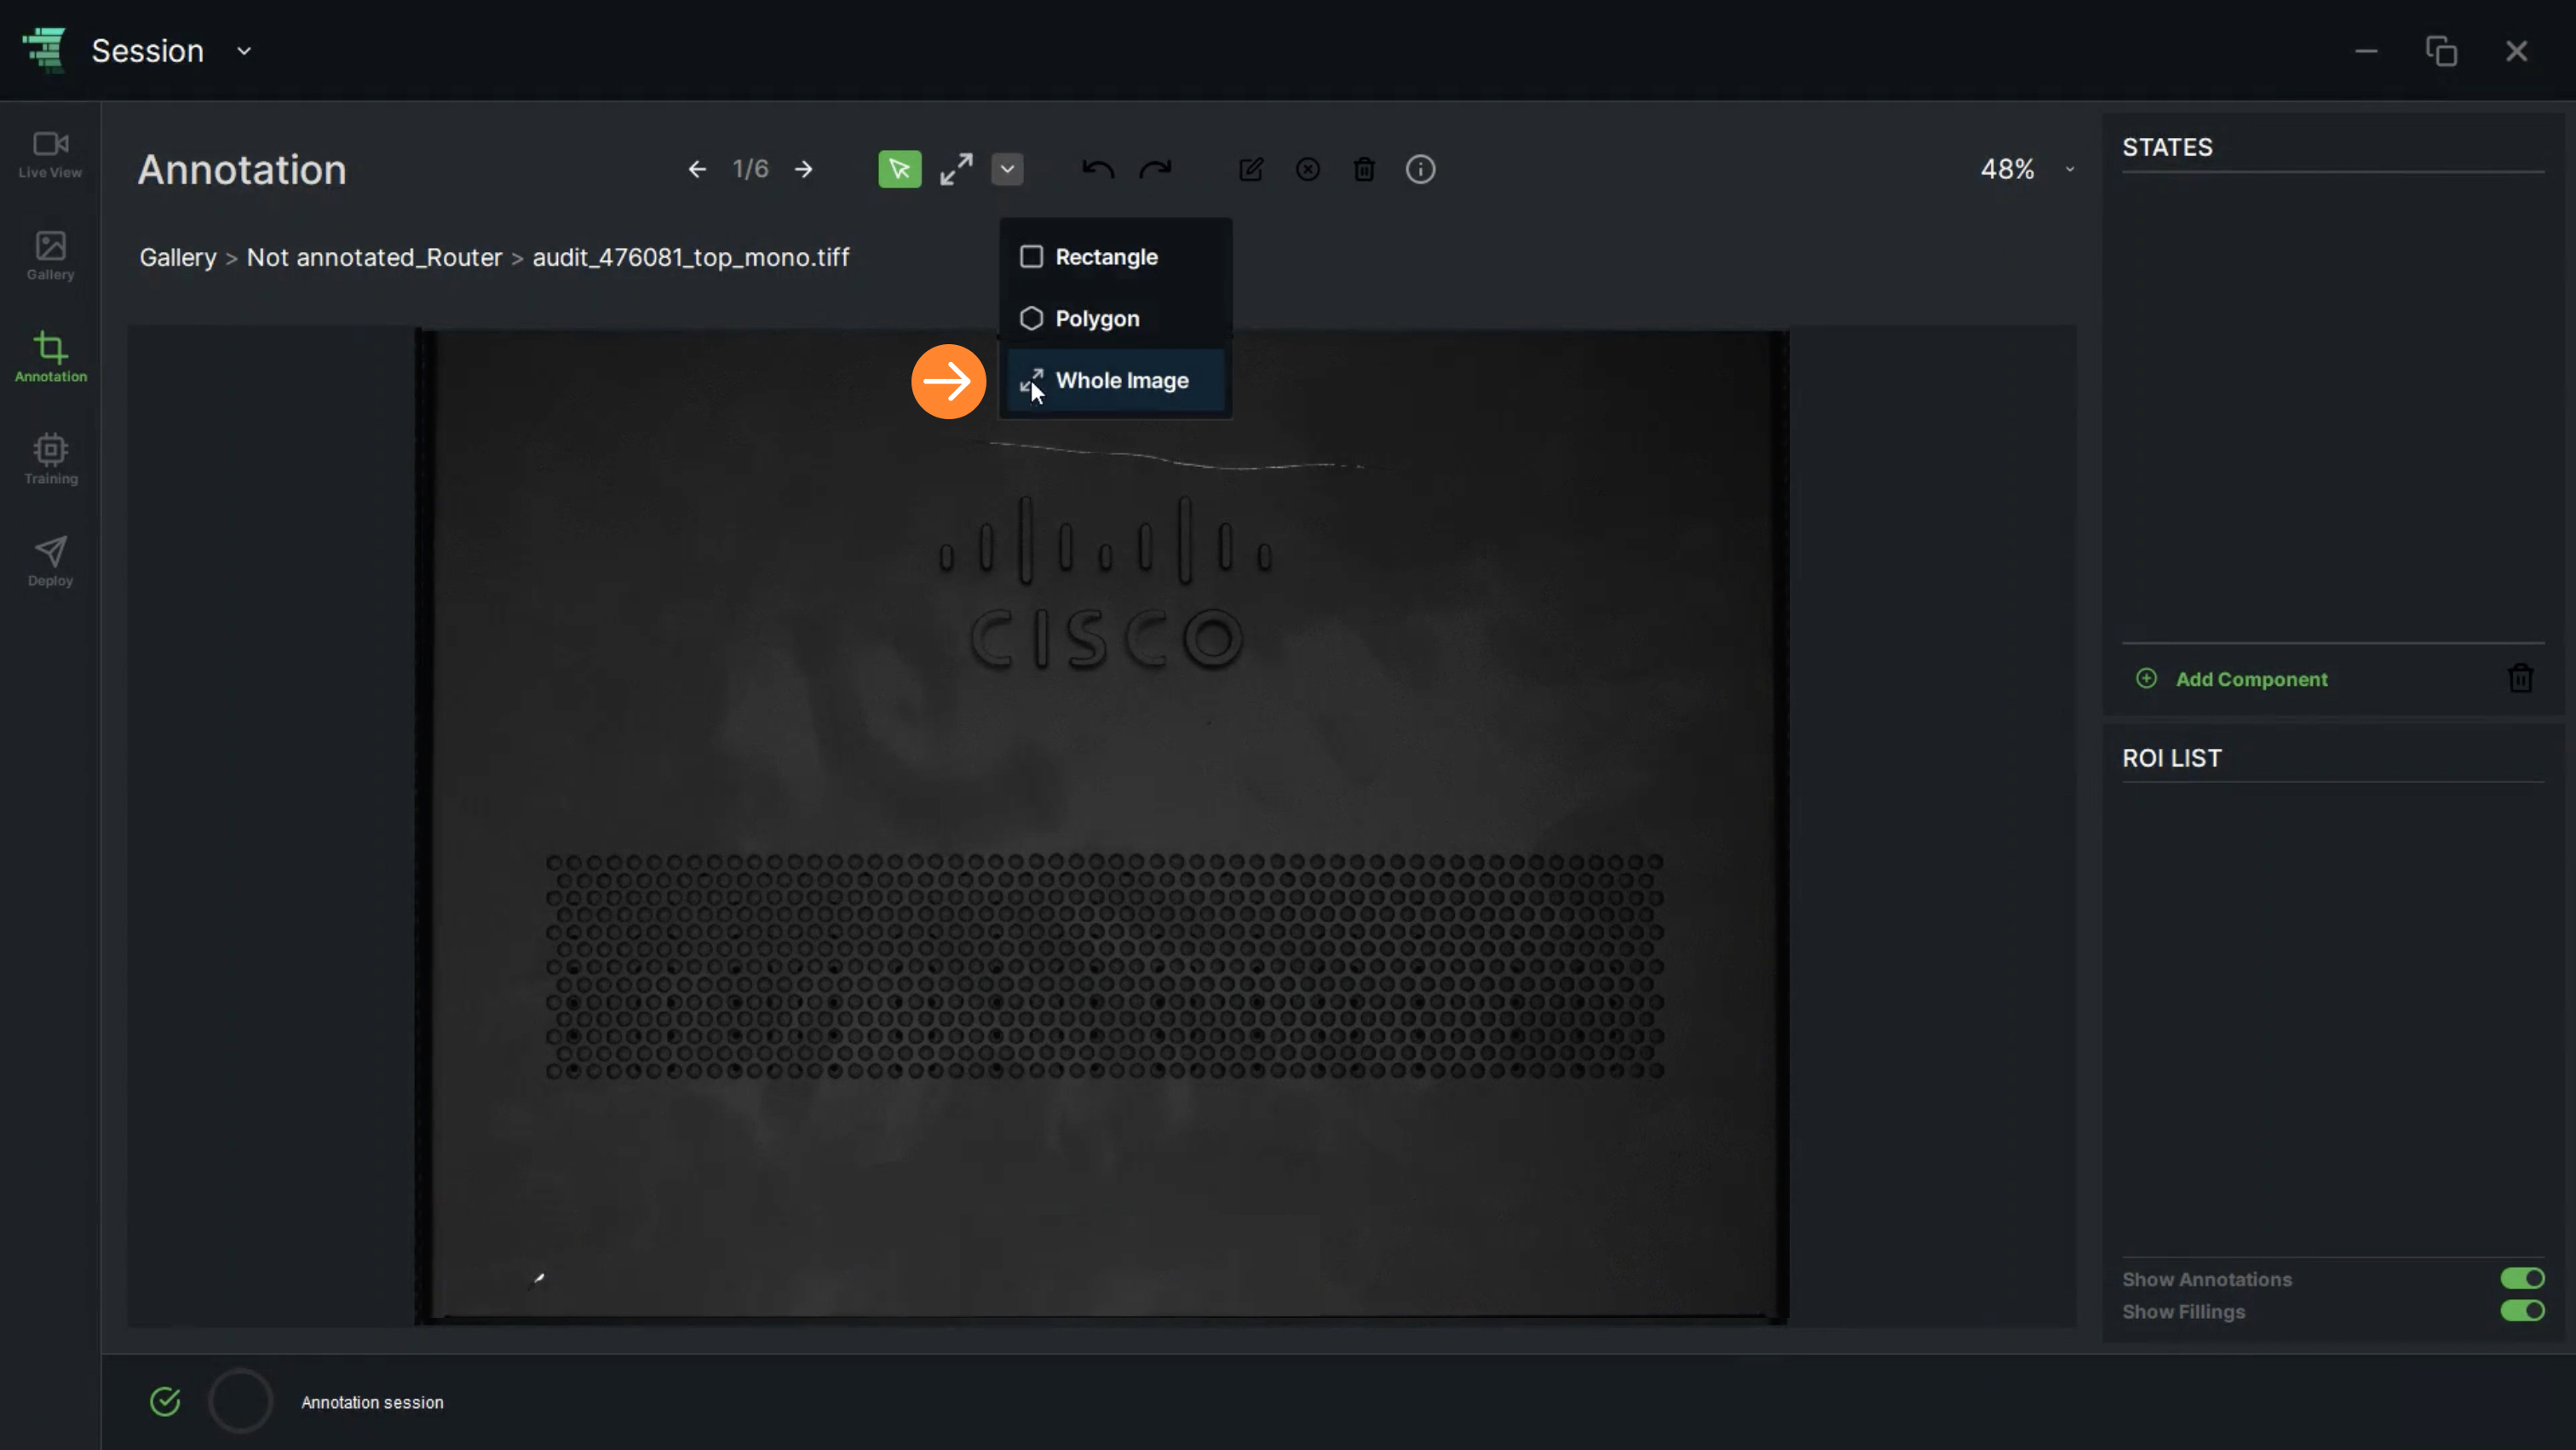
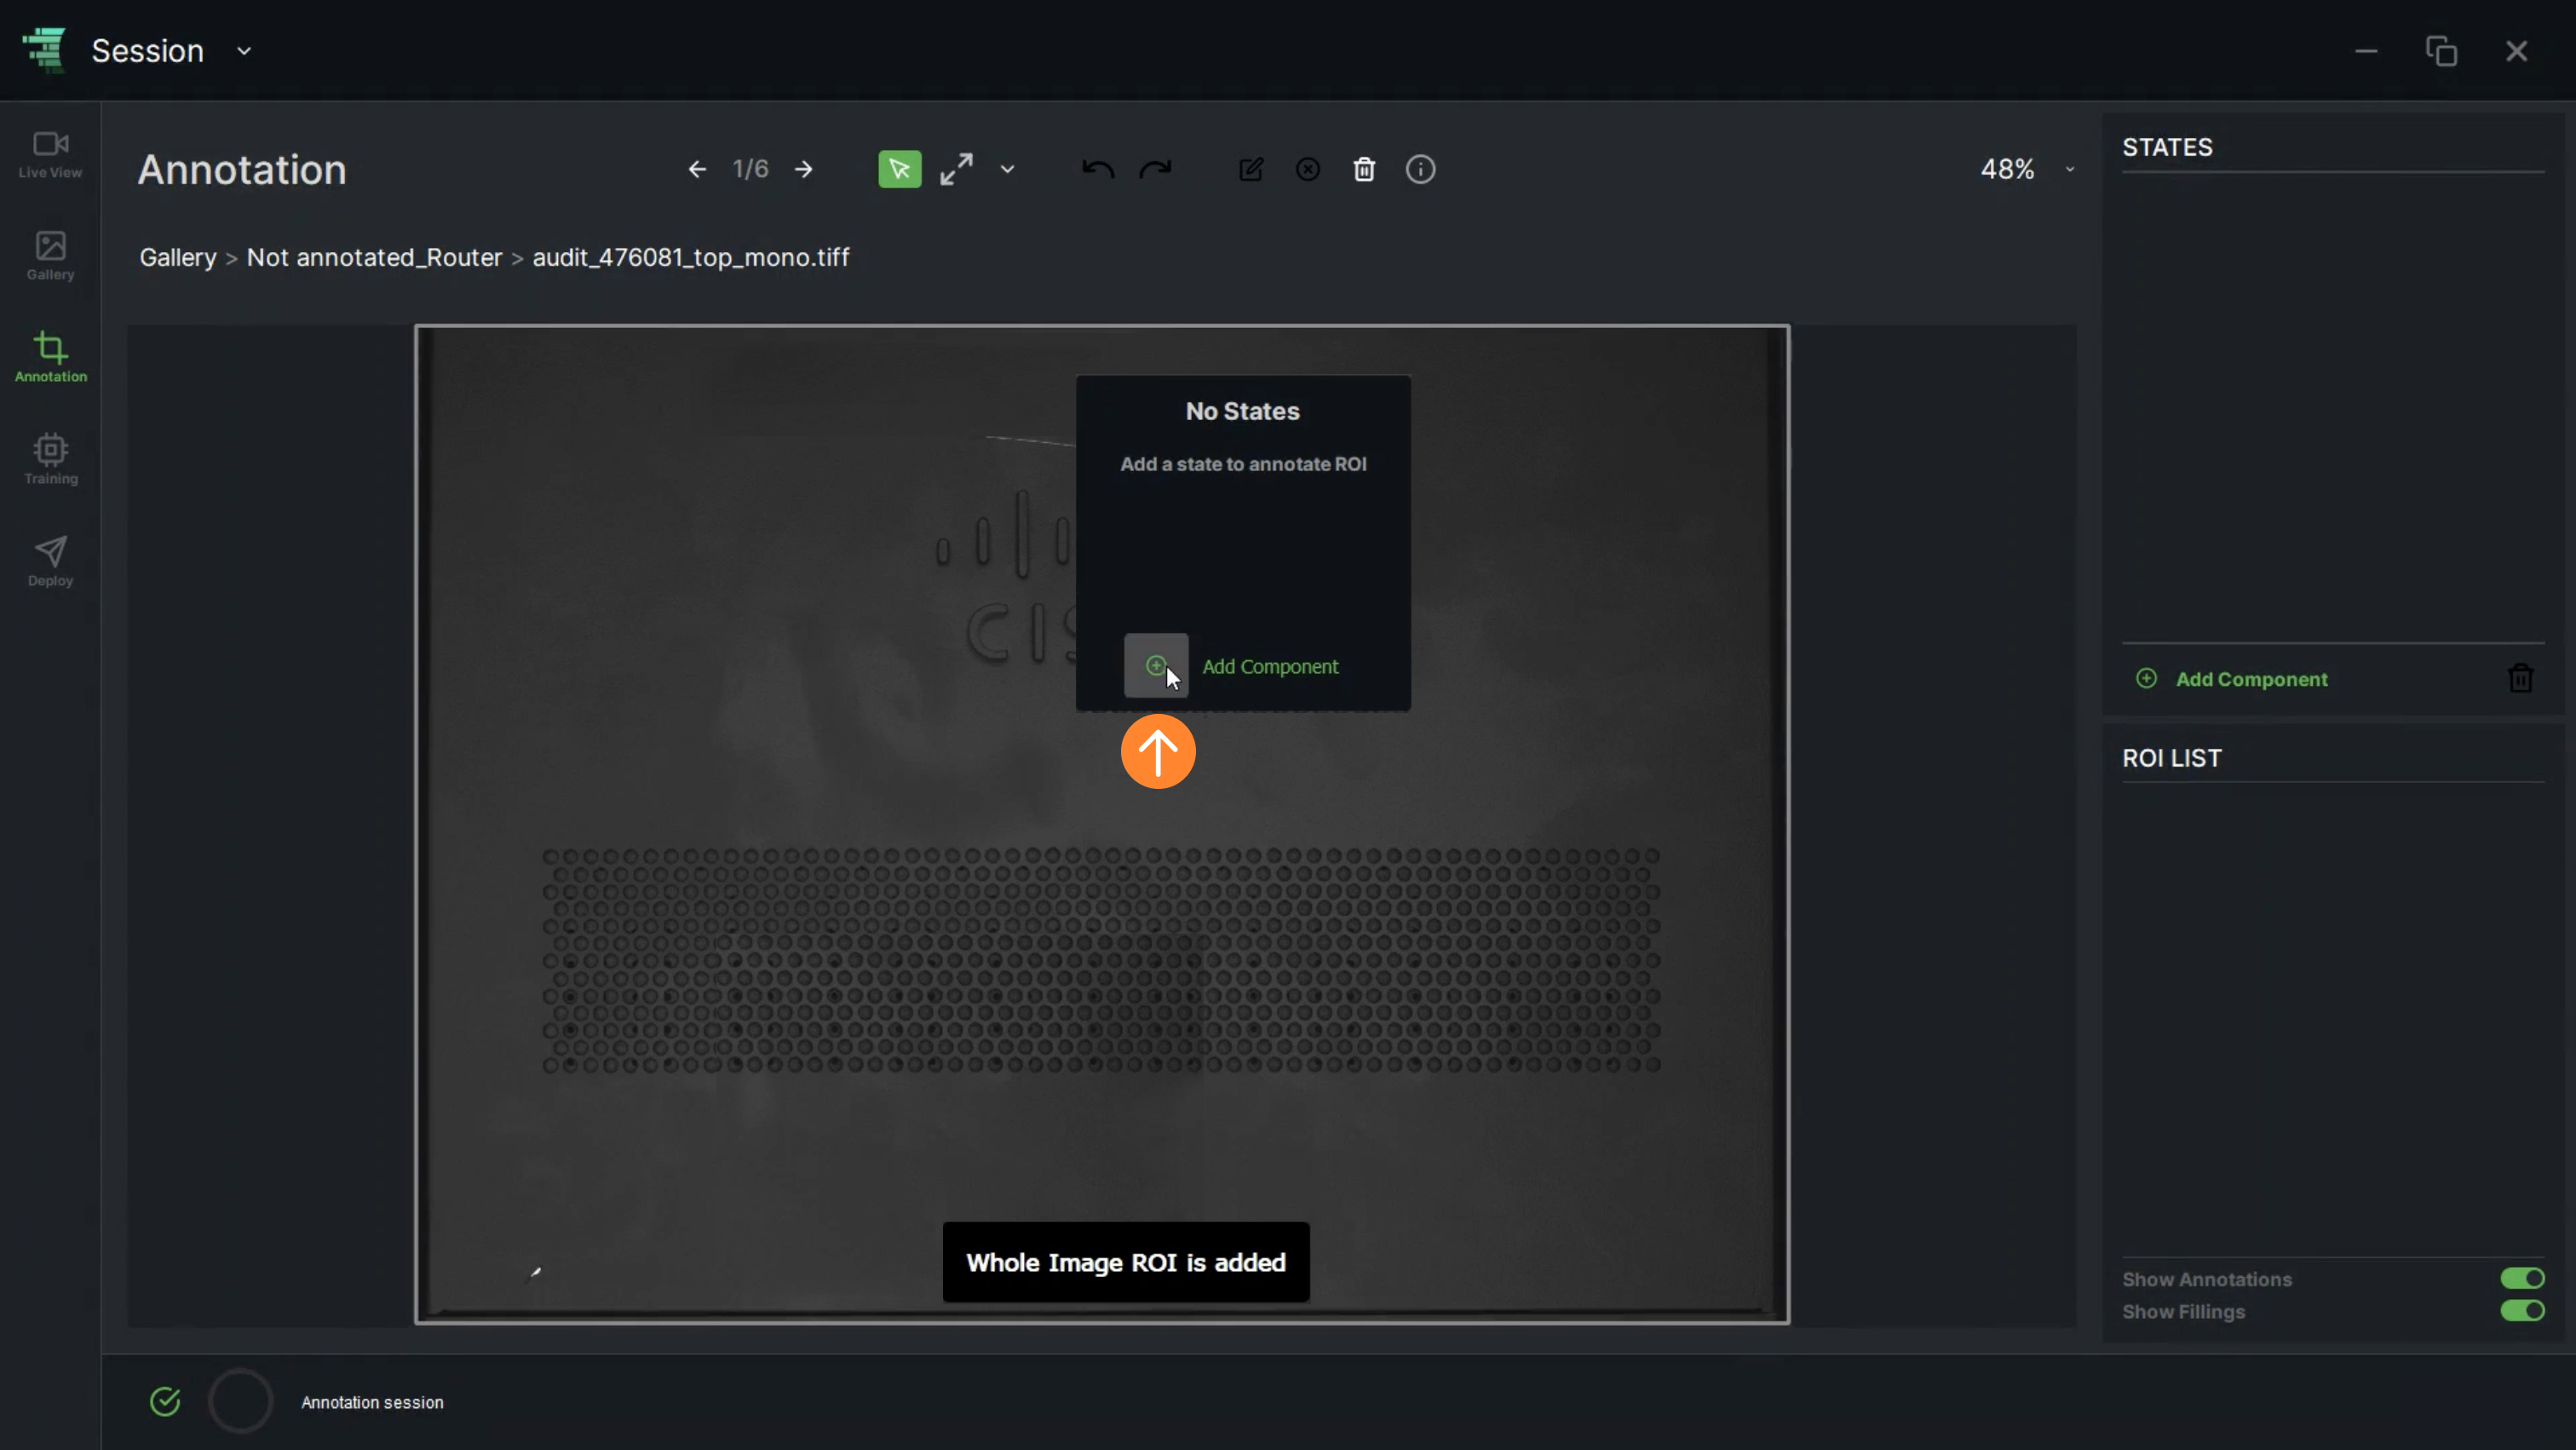
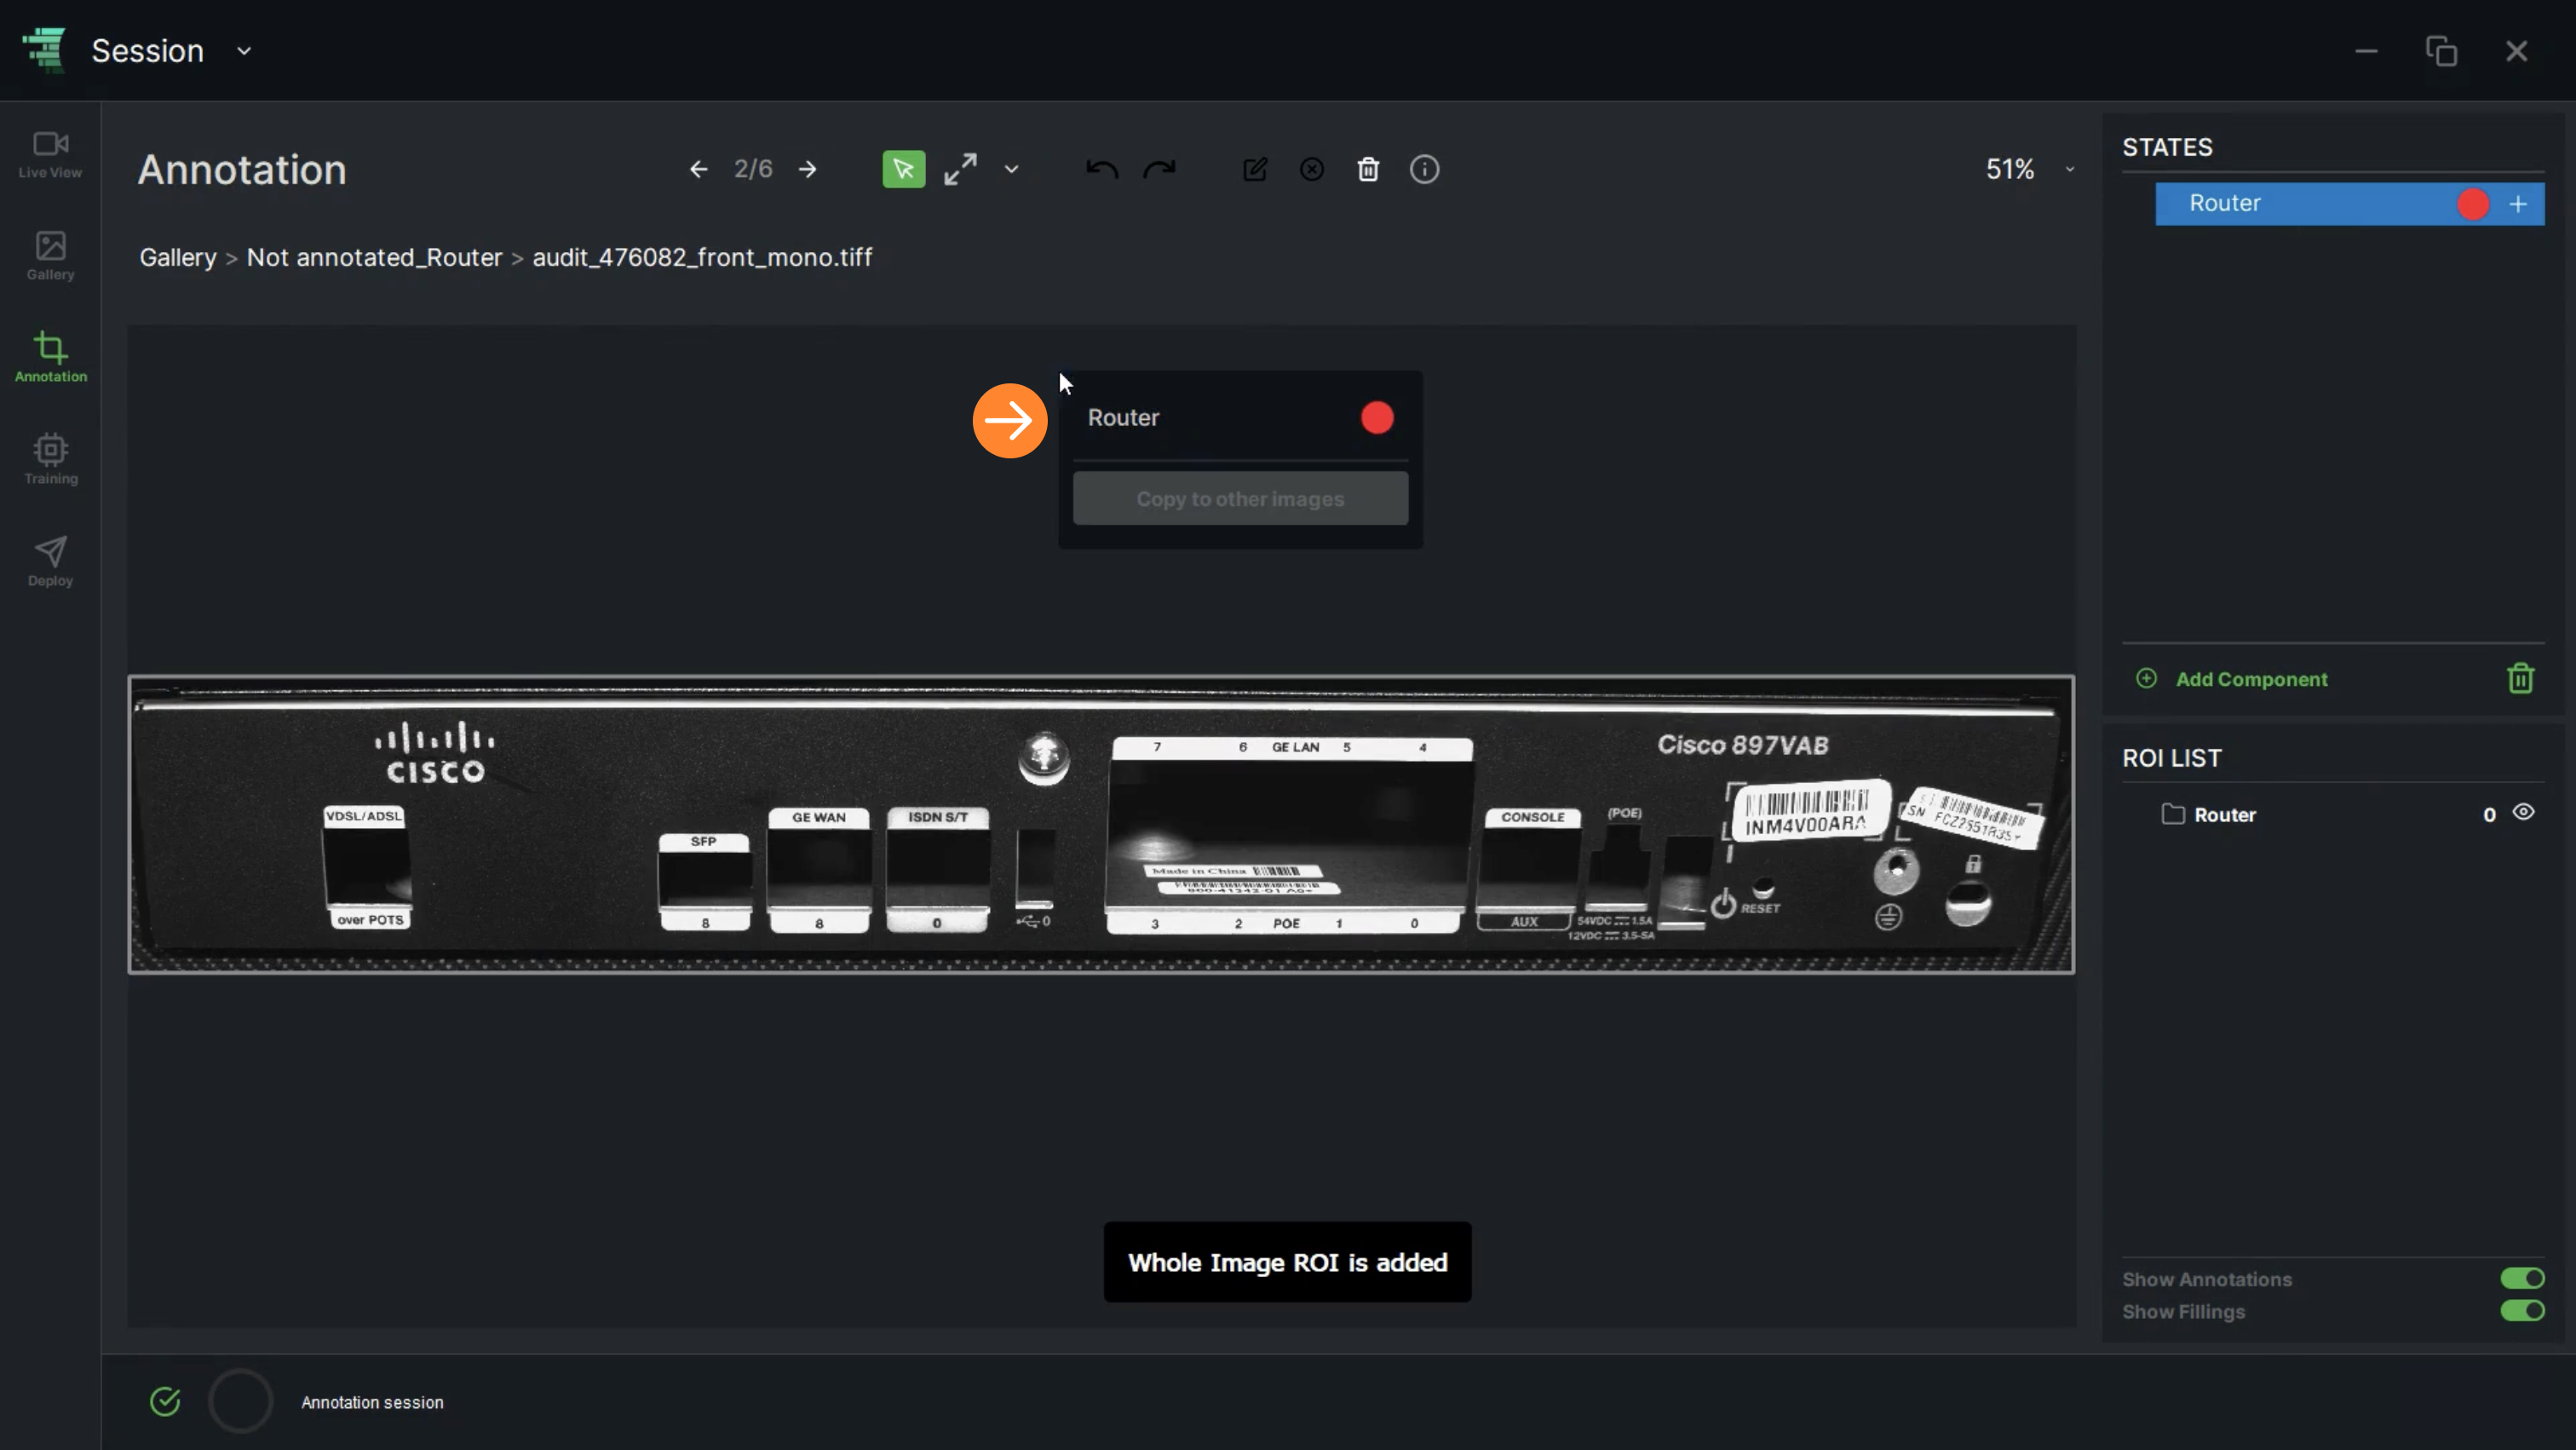
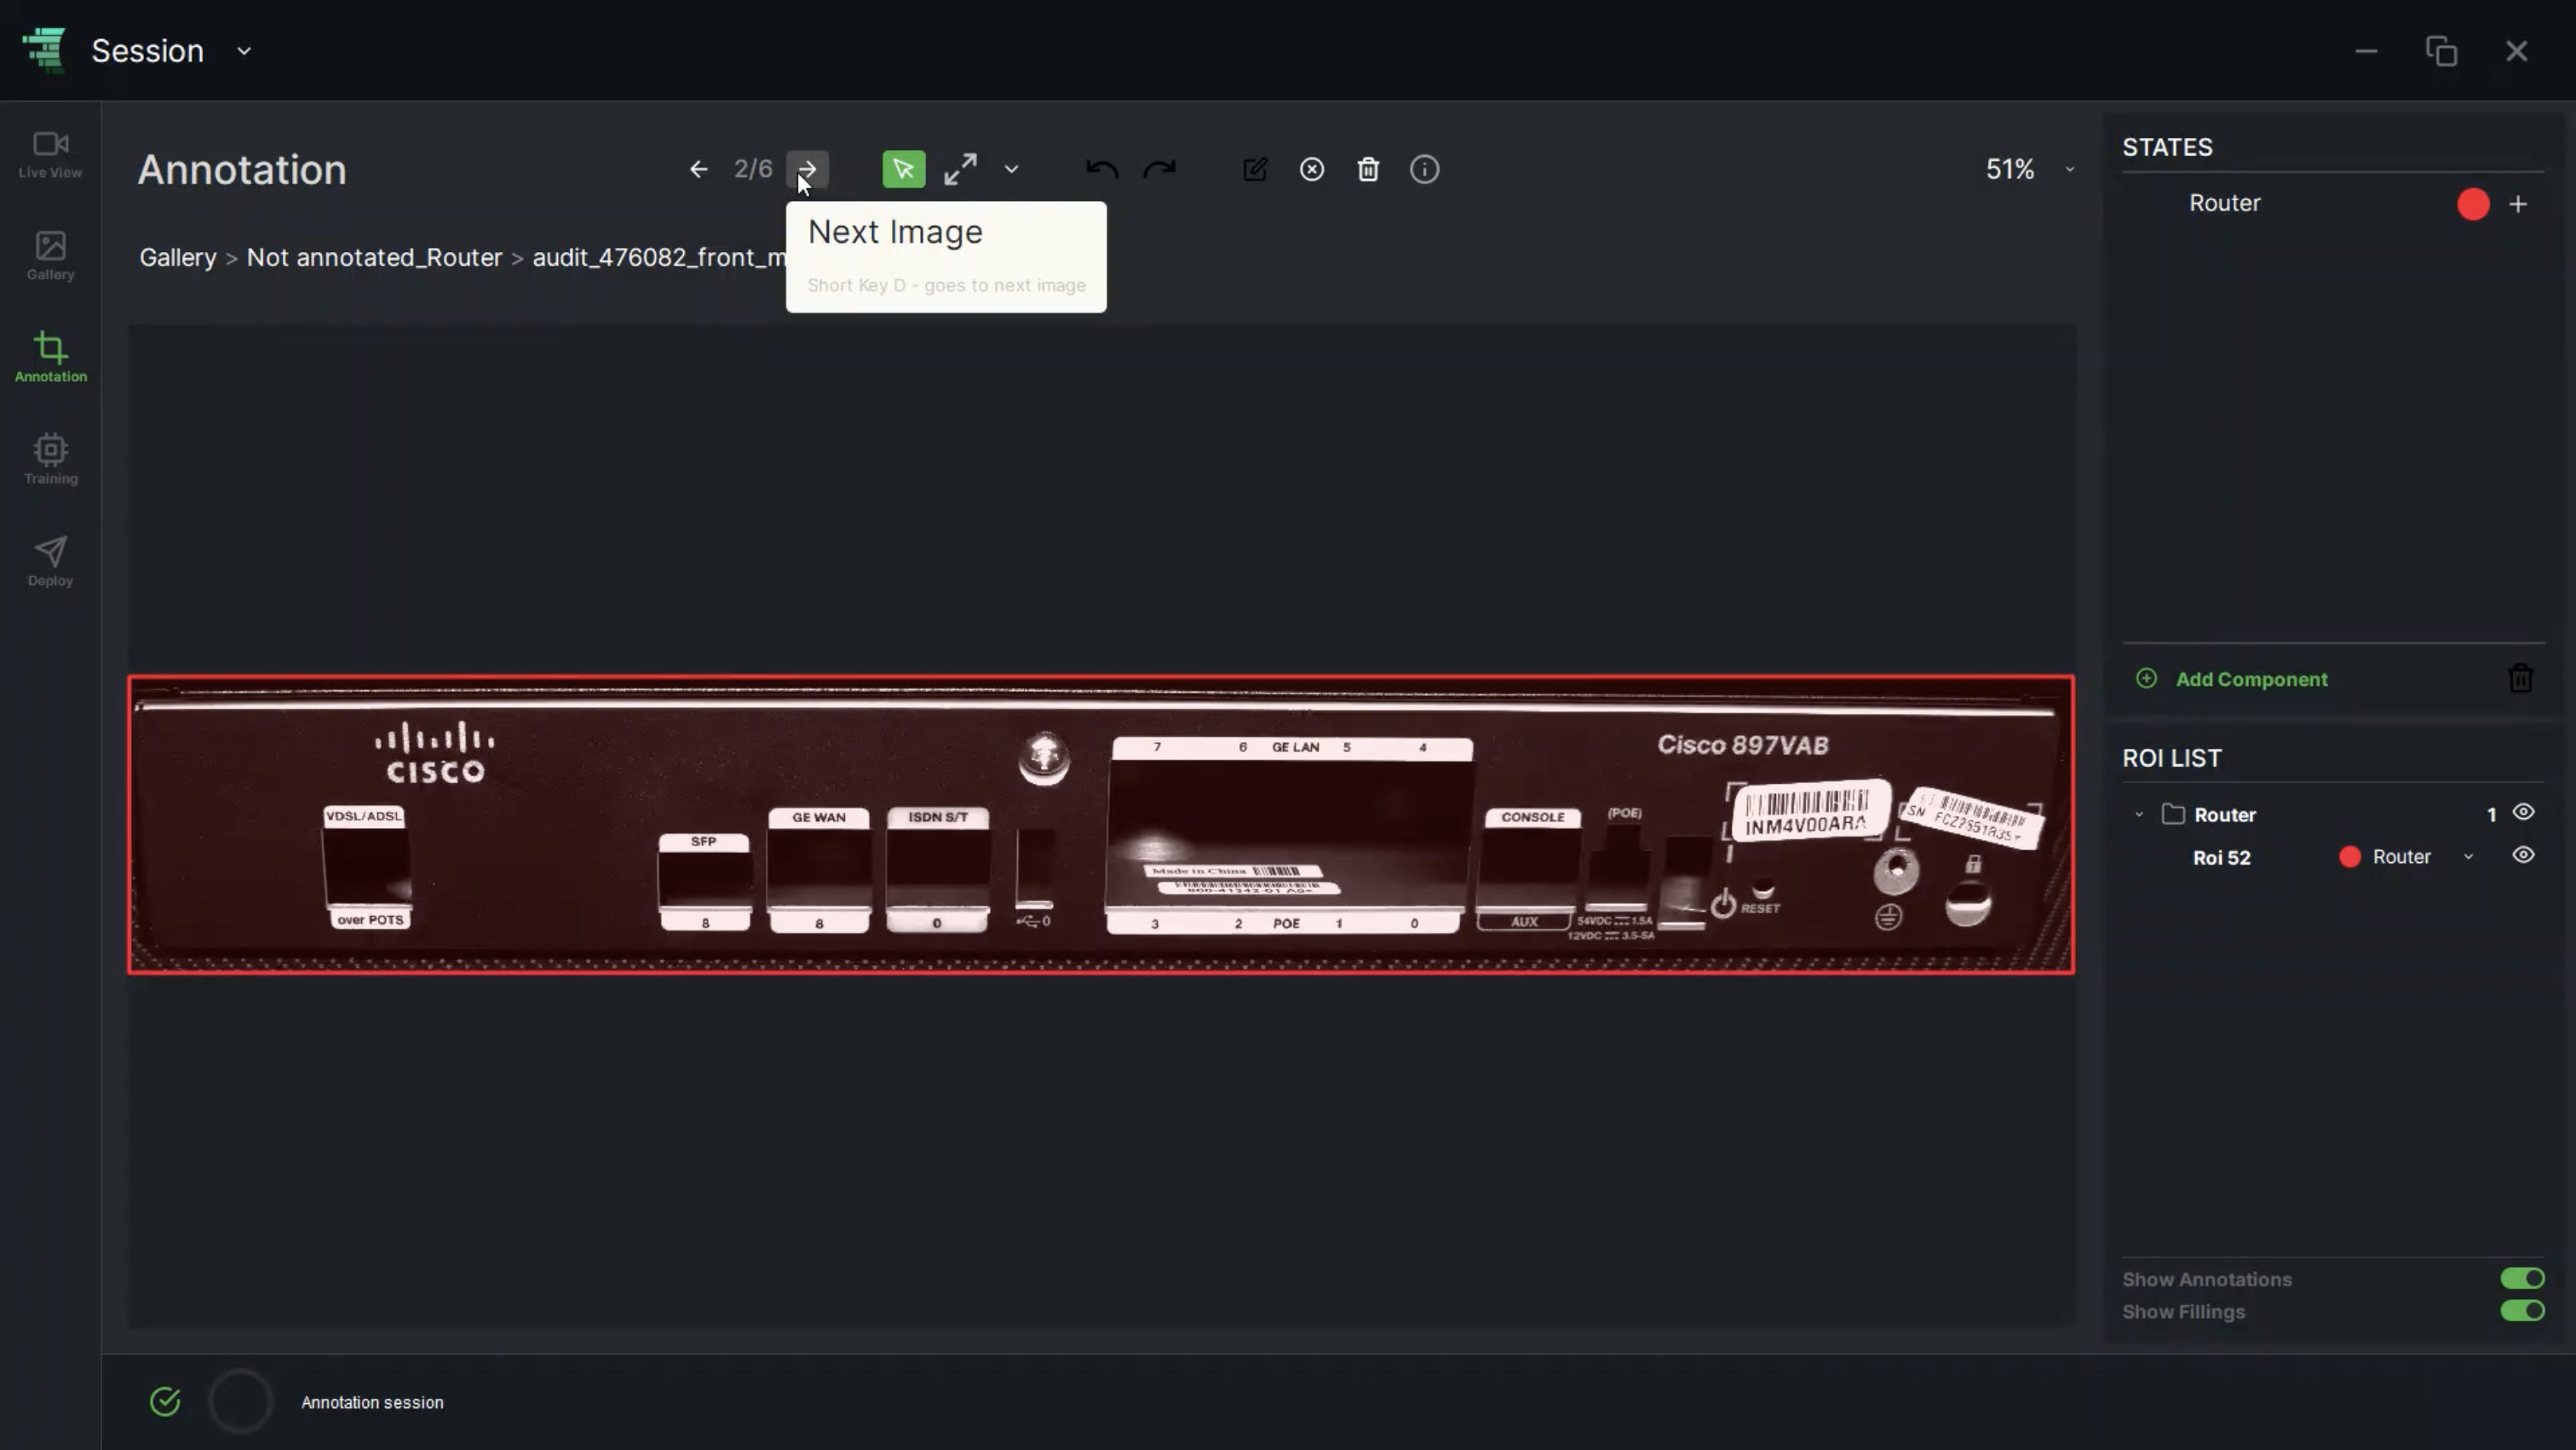
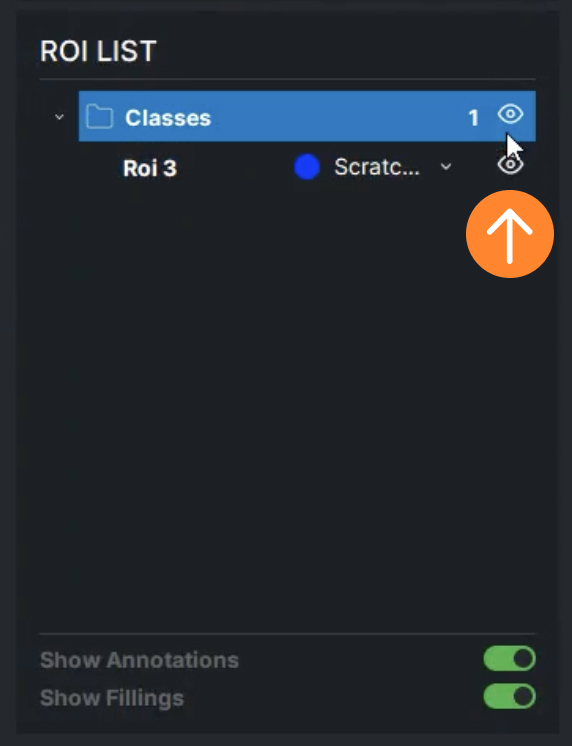
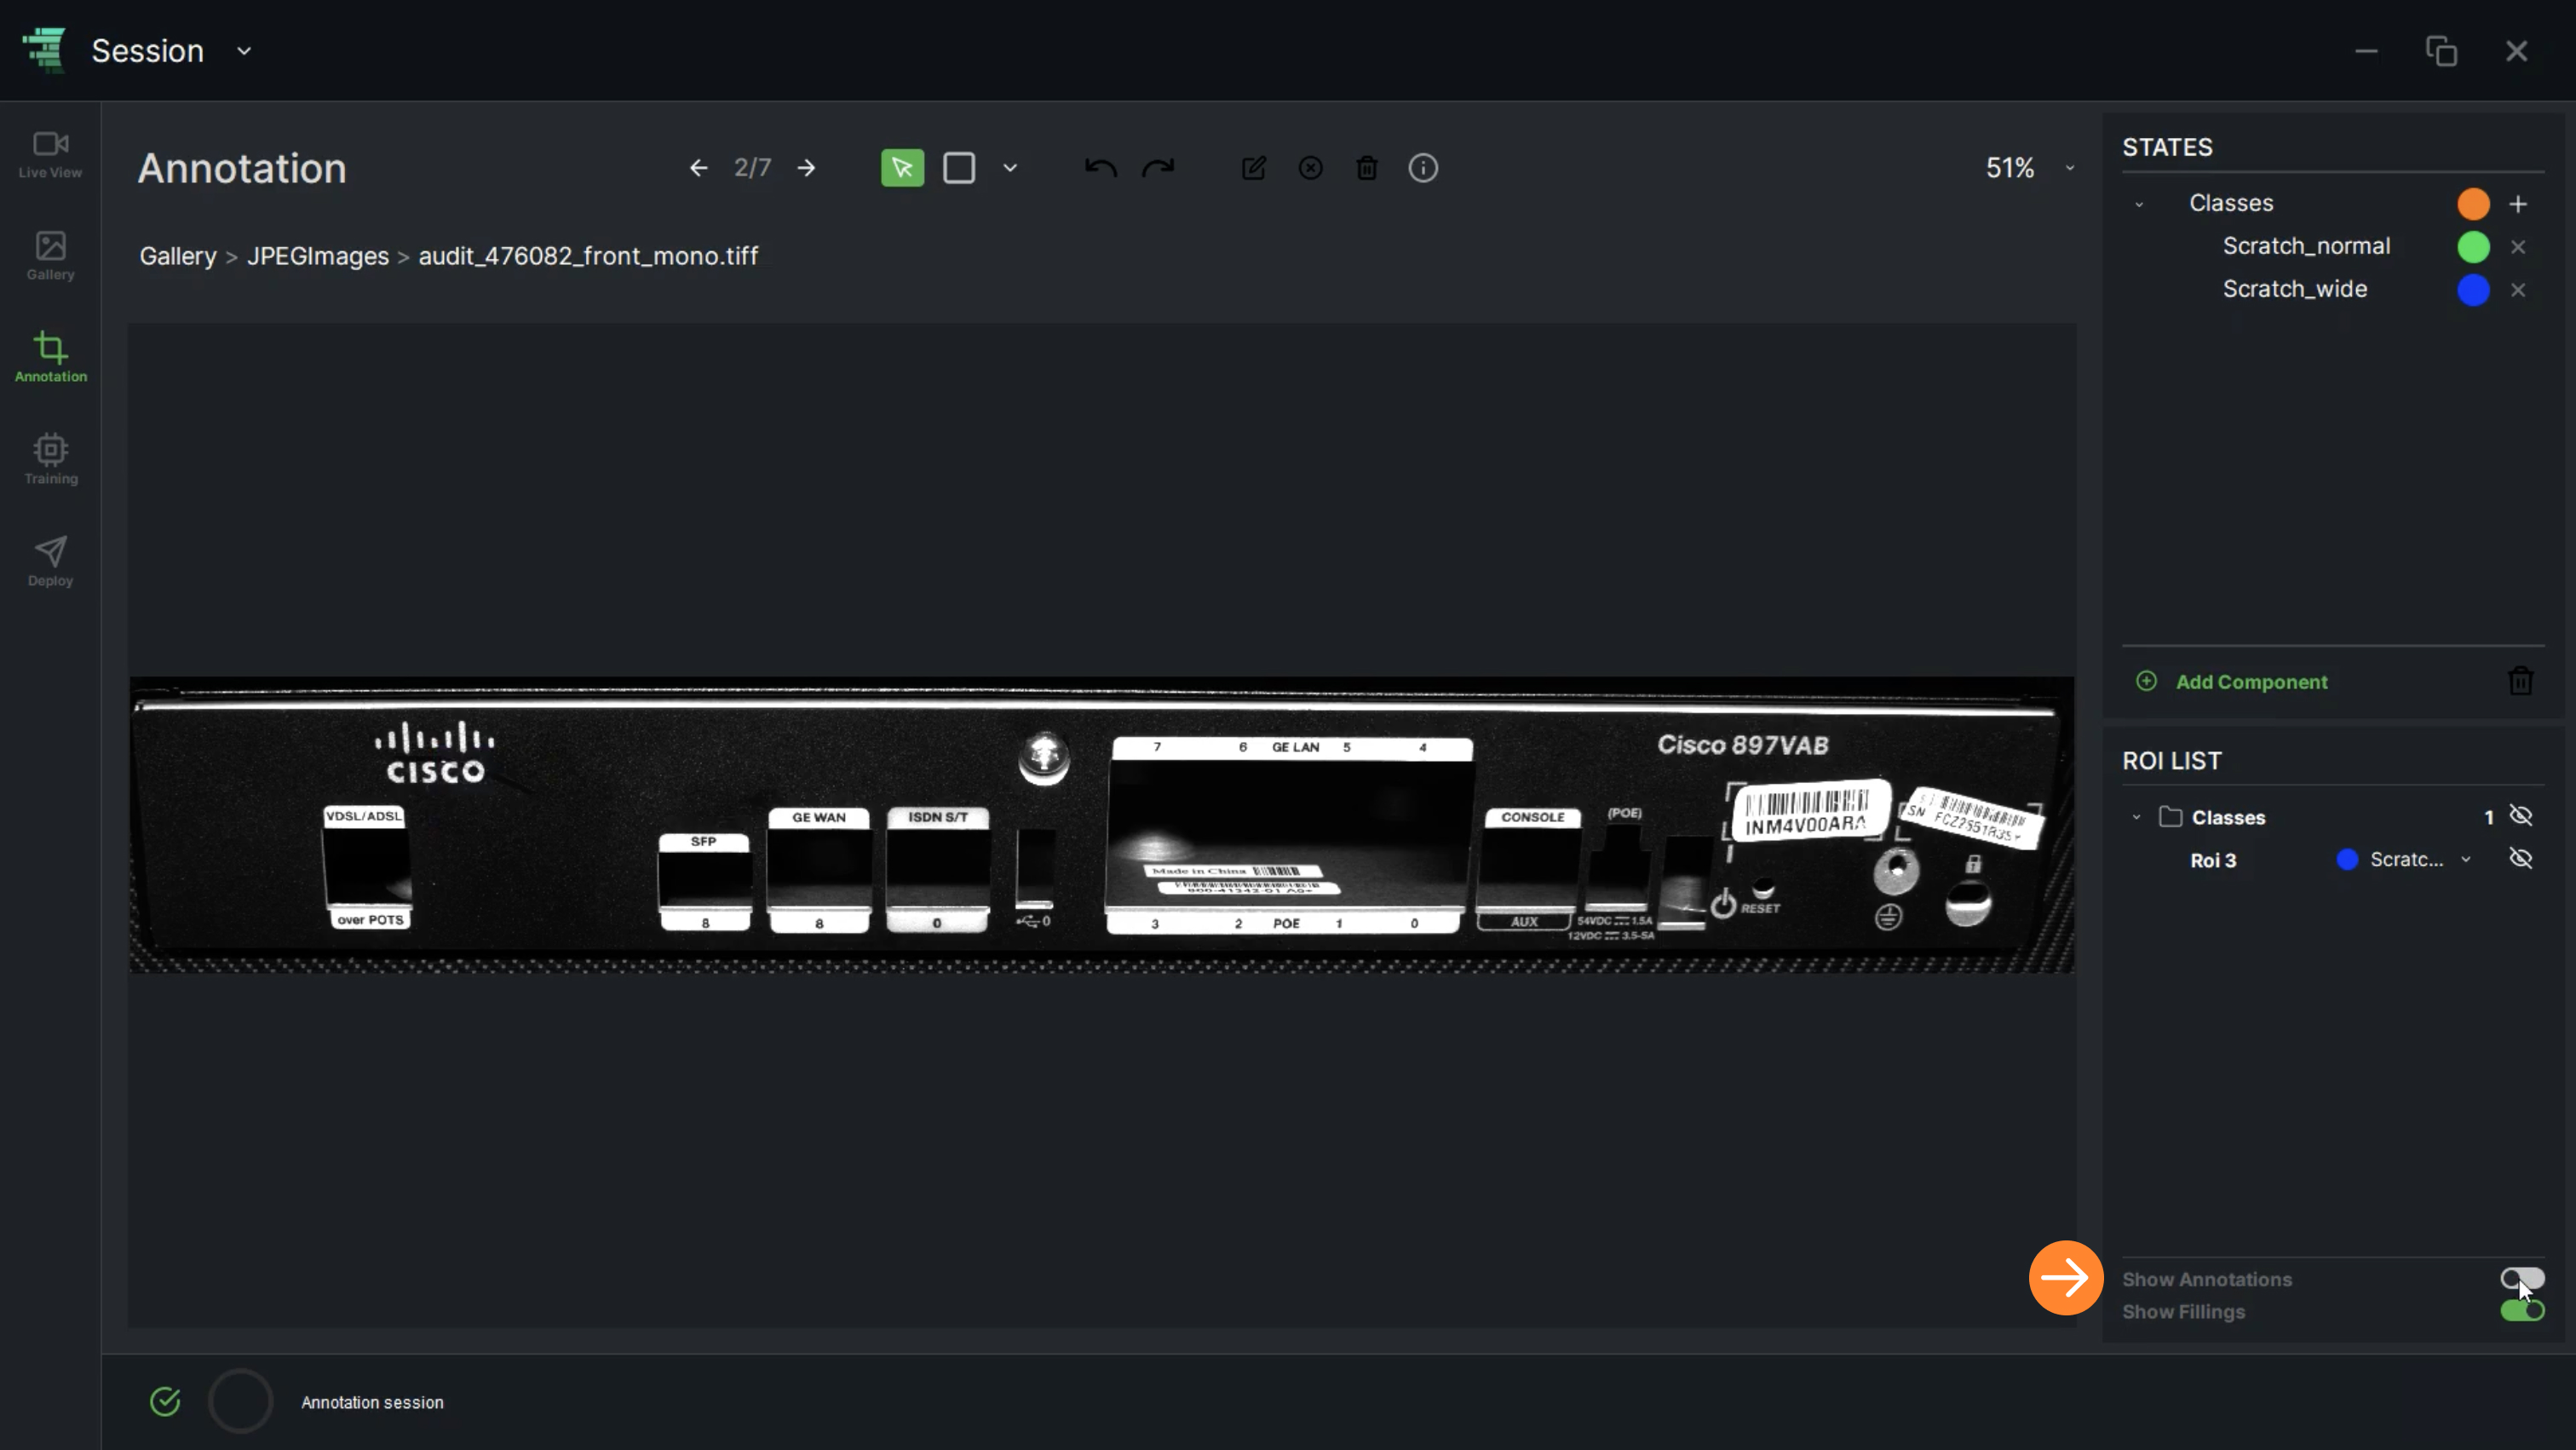
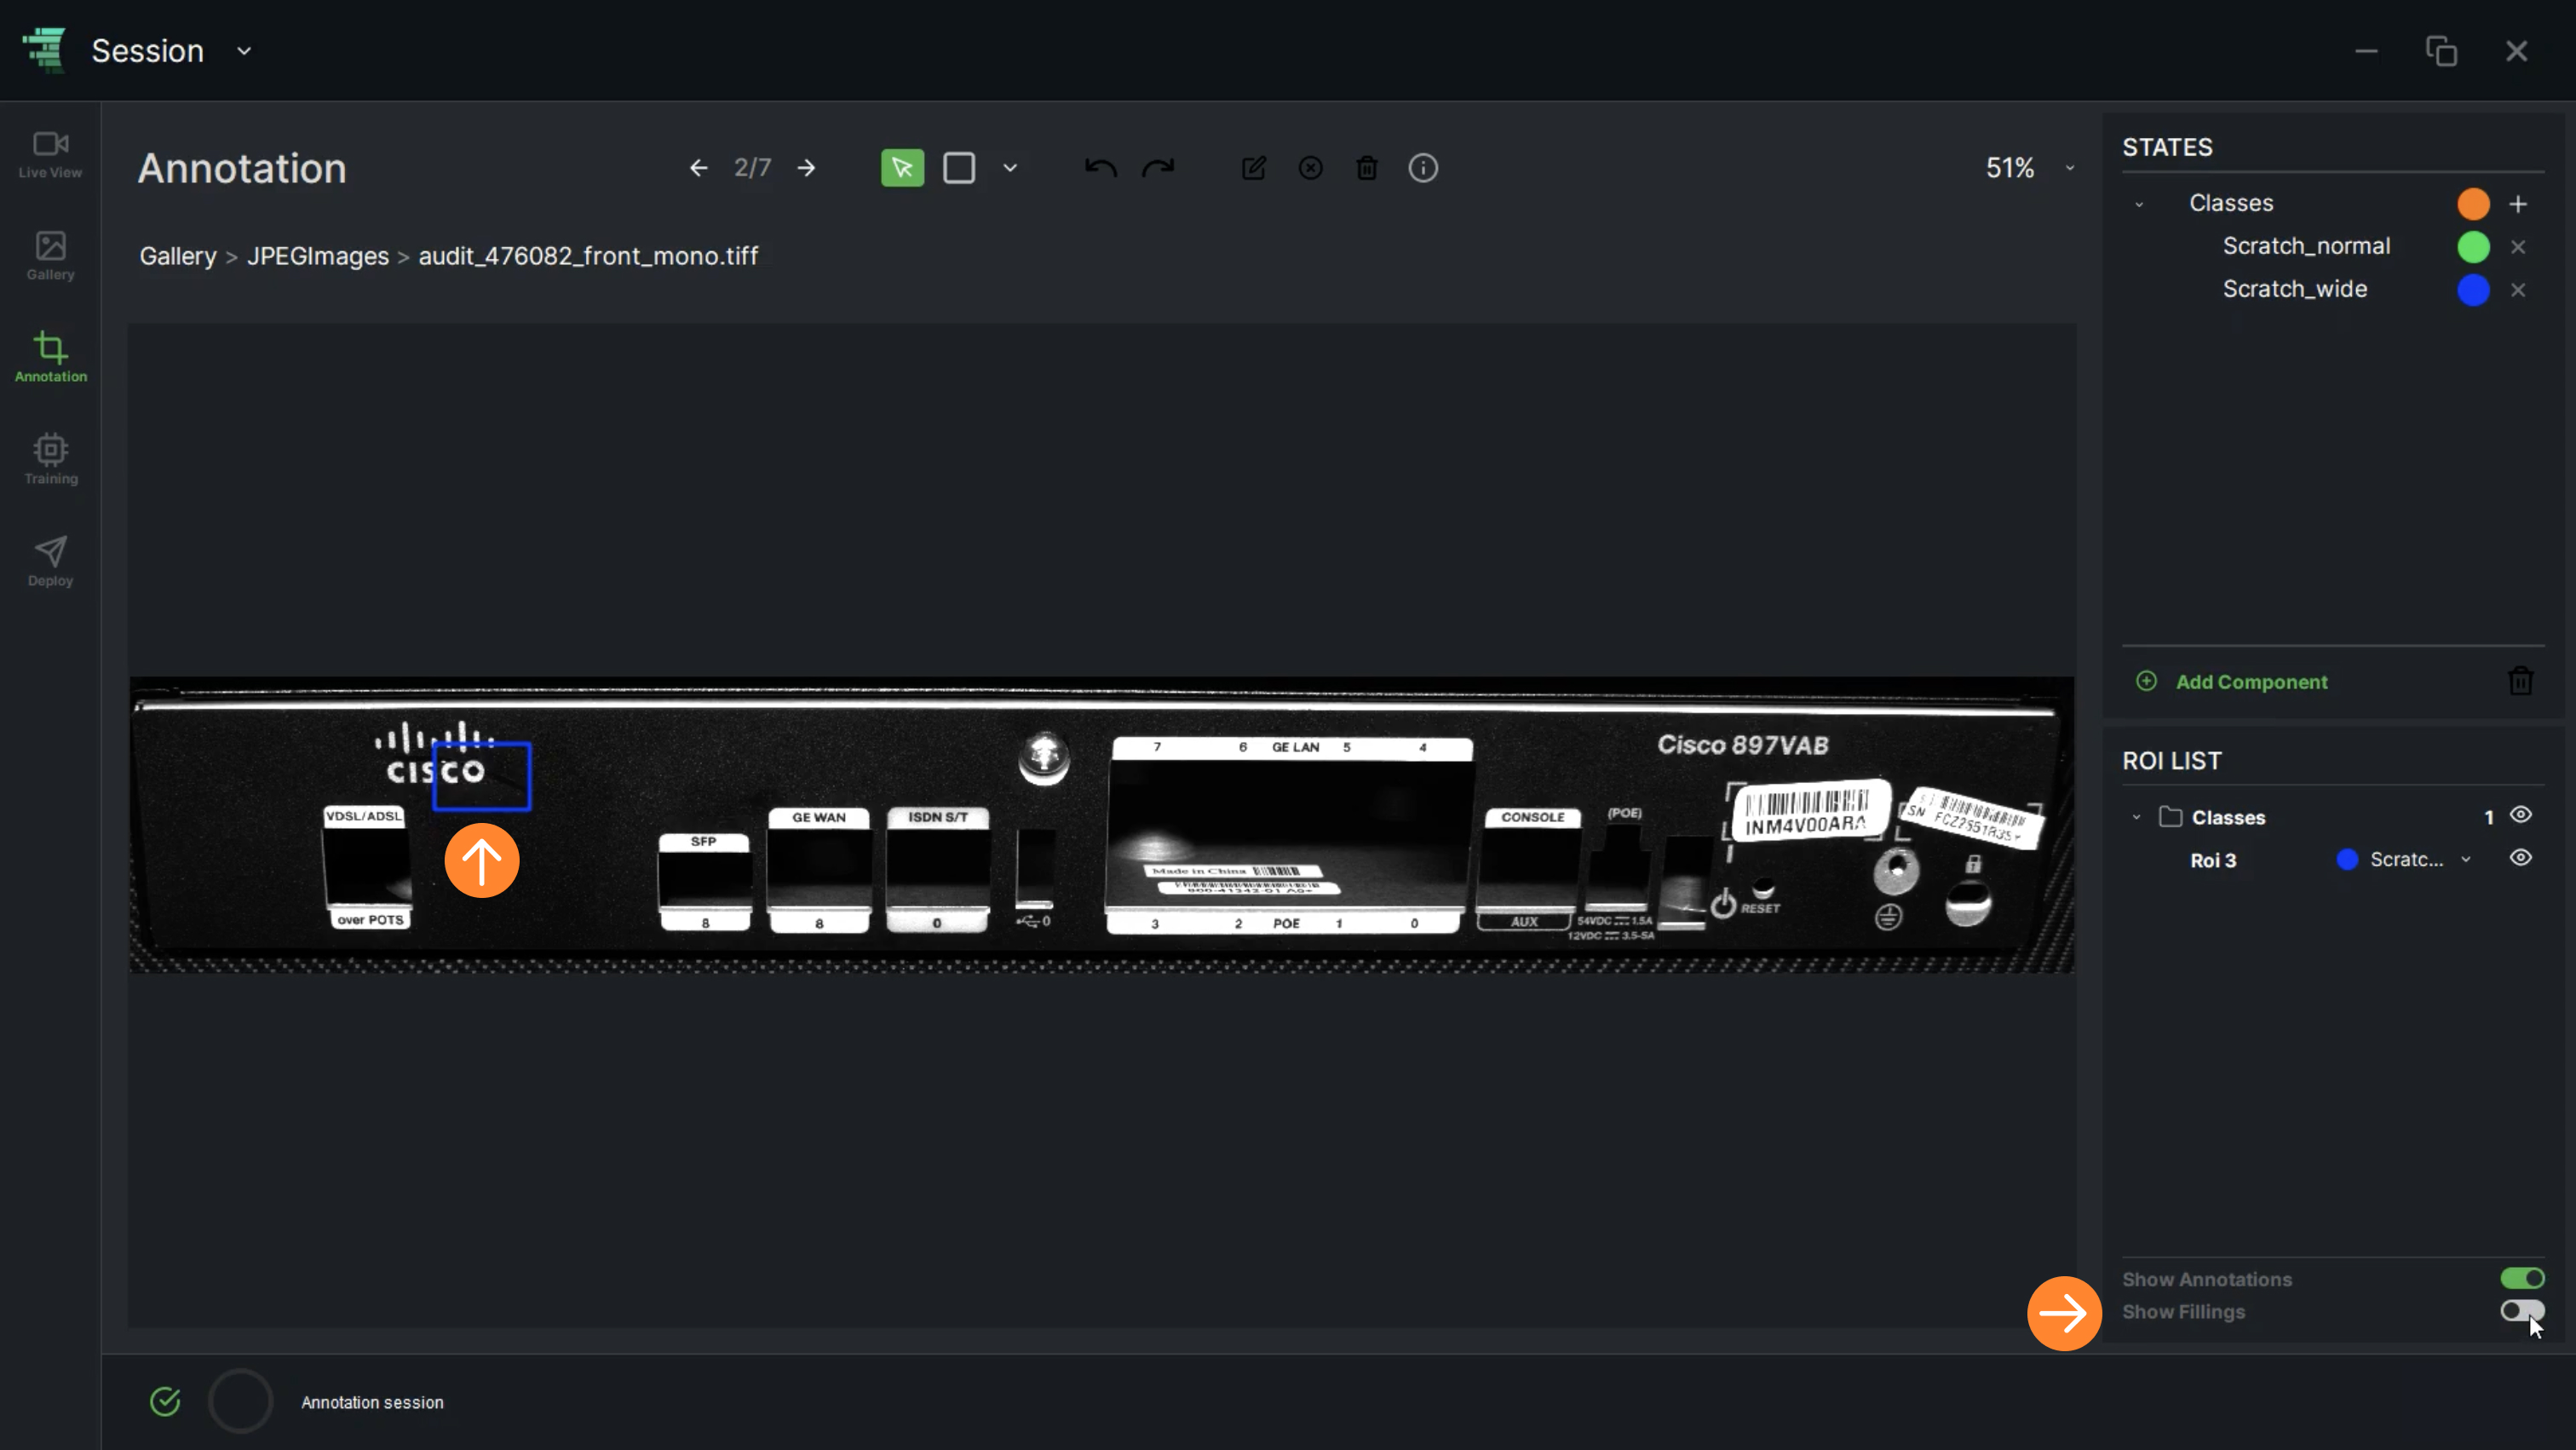
14. In the annotation screen, ROI LIST displays the defined Regions of Interest. The user has the option to switch the visibility of these ROIs by clicking on the “View” icon

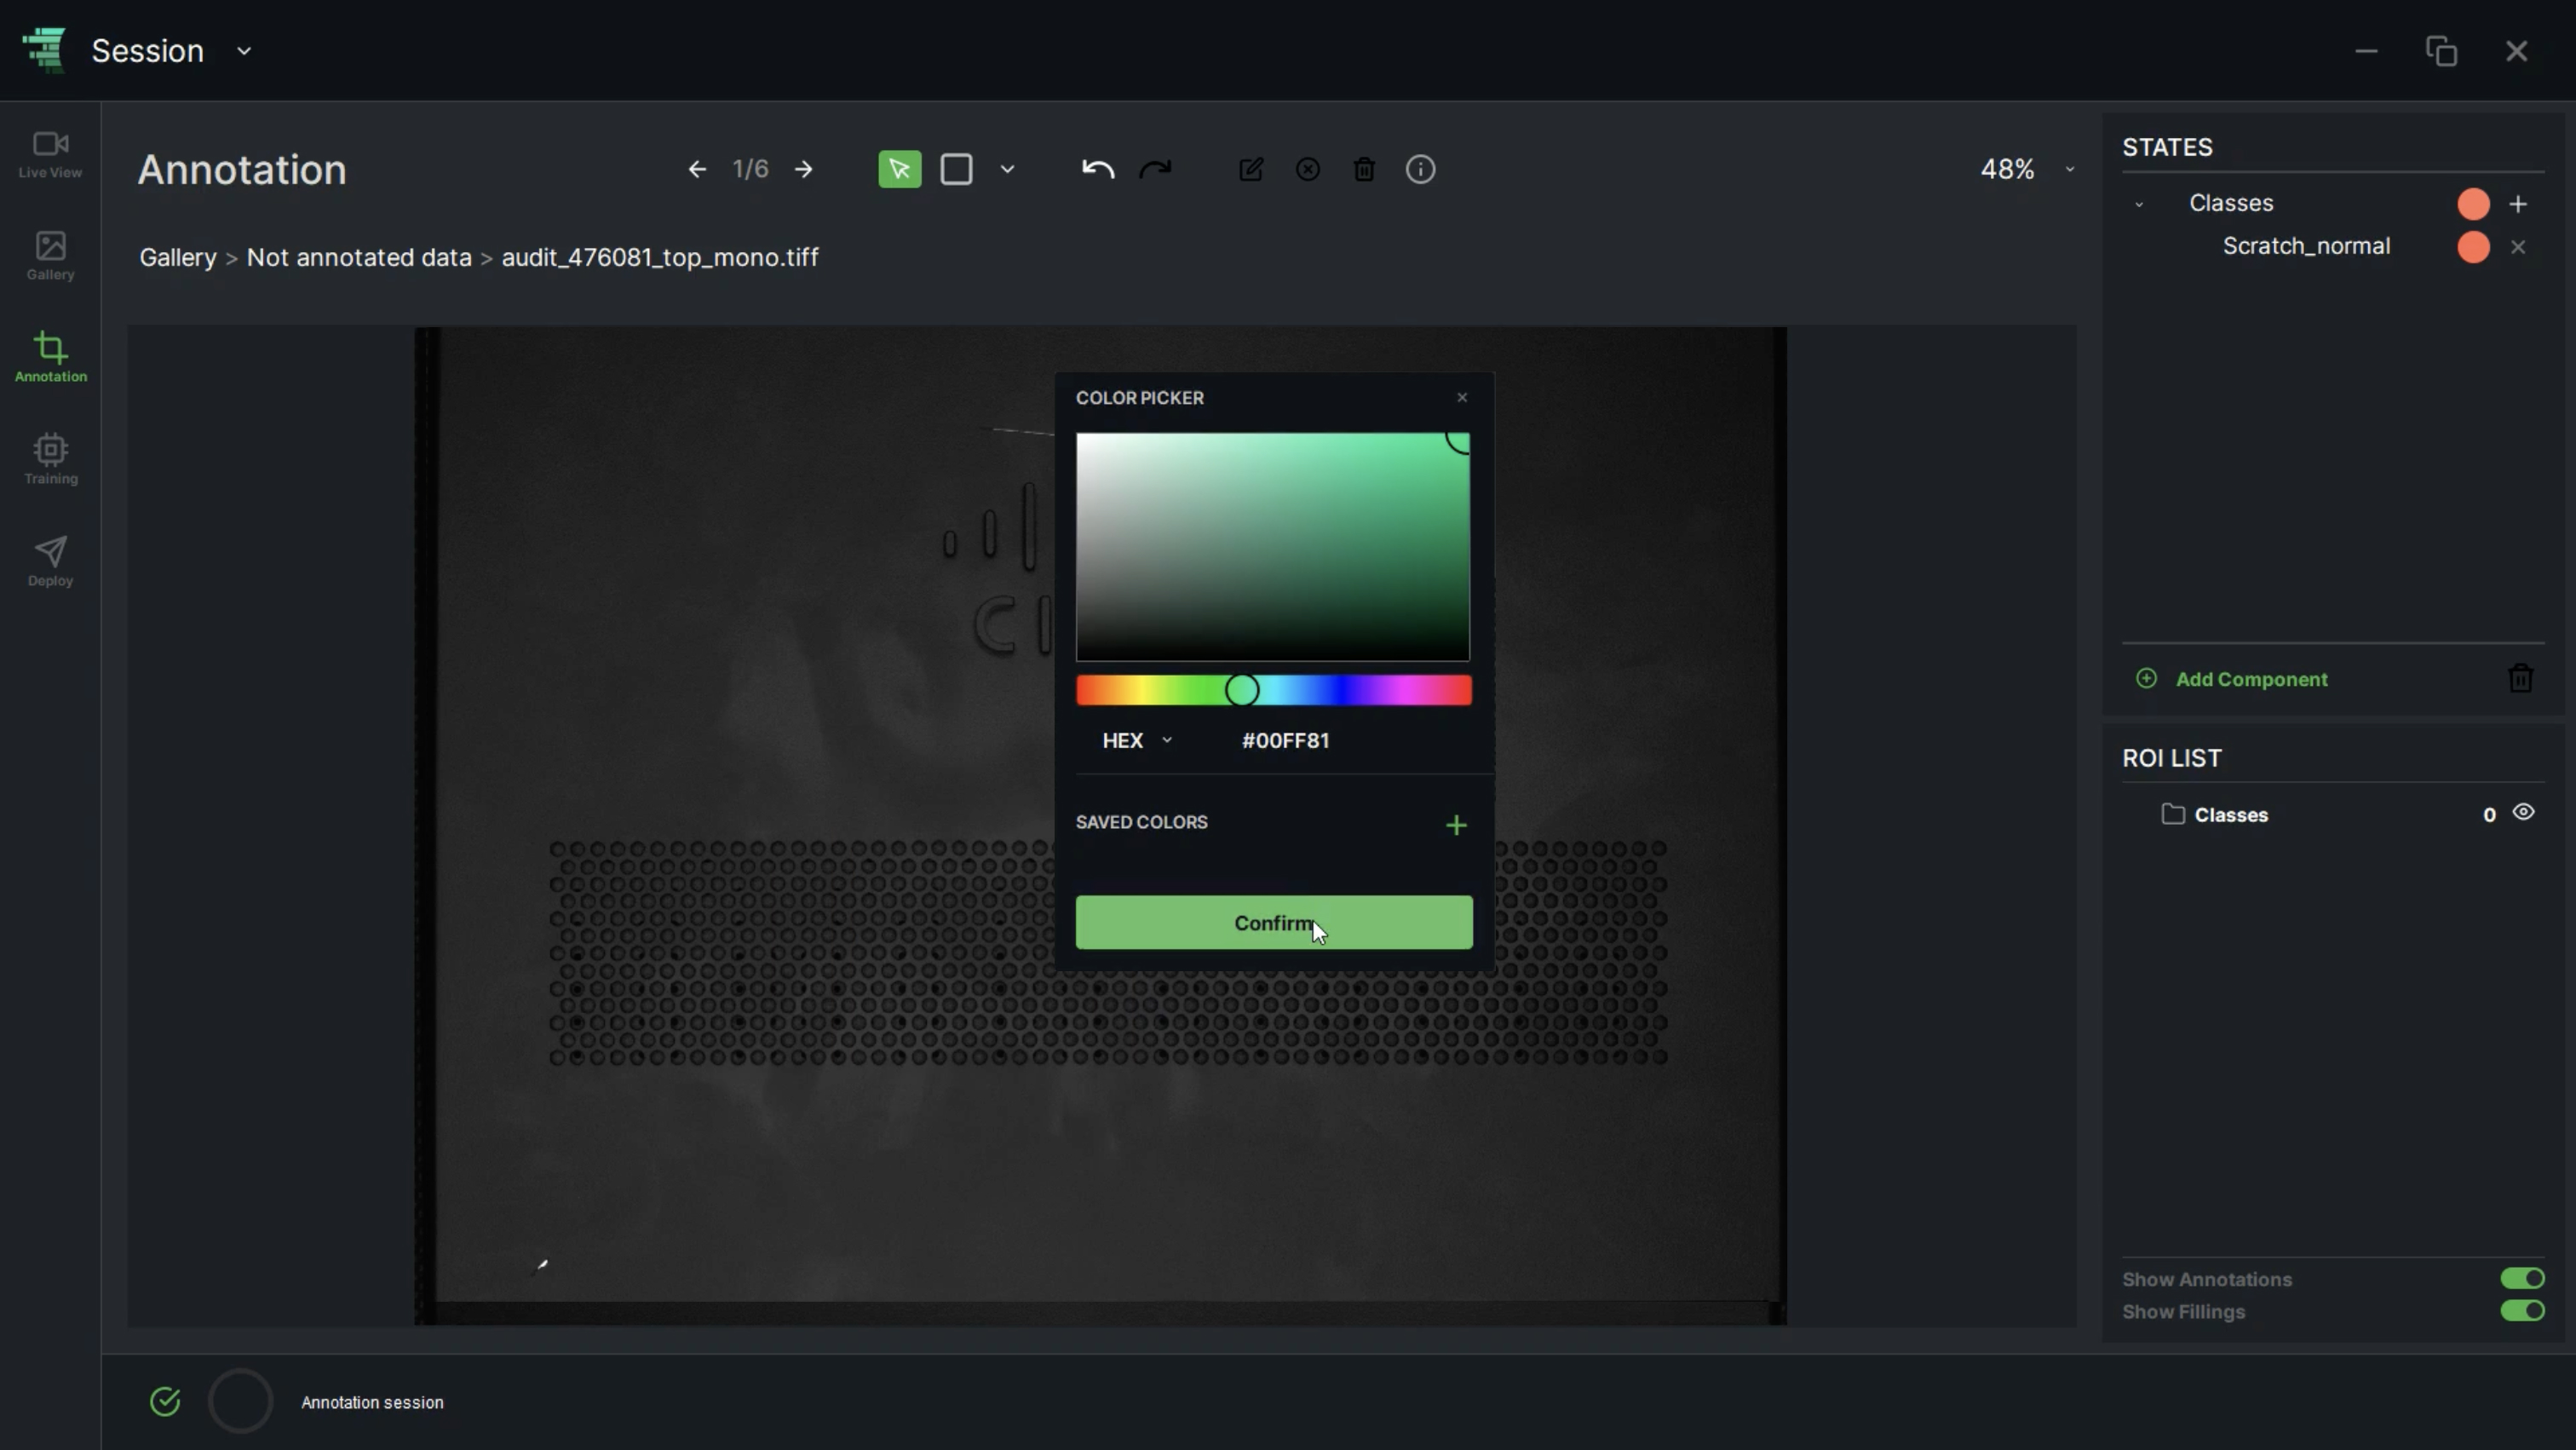
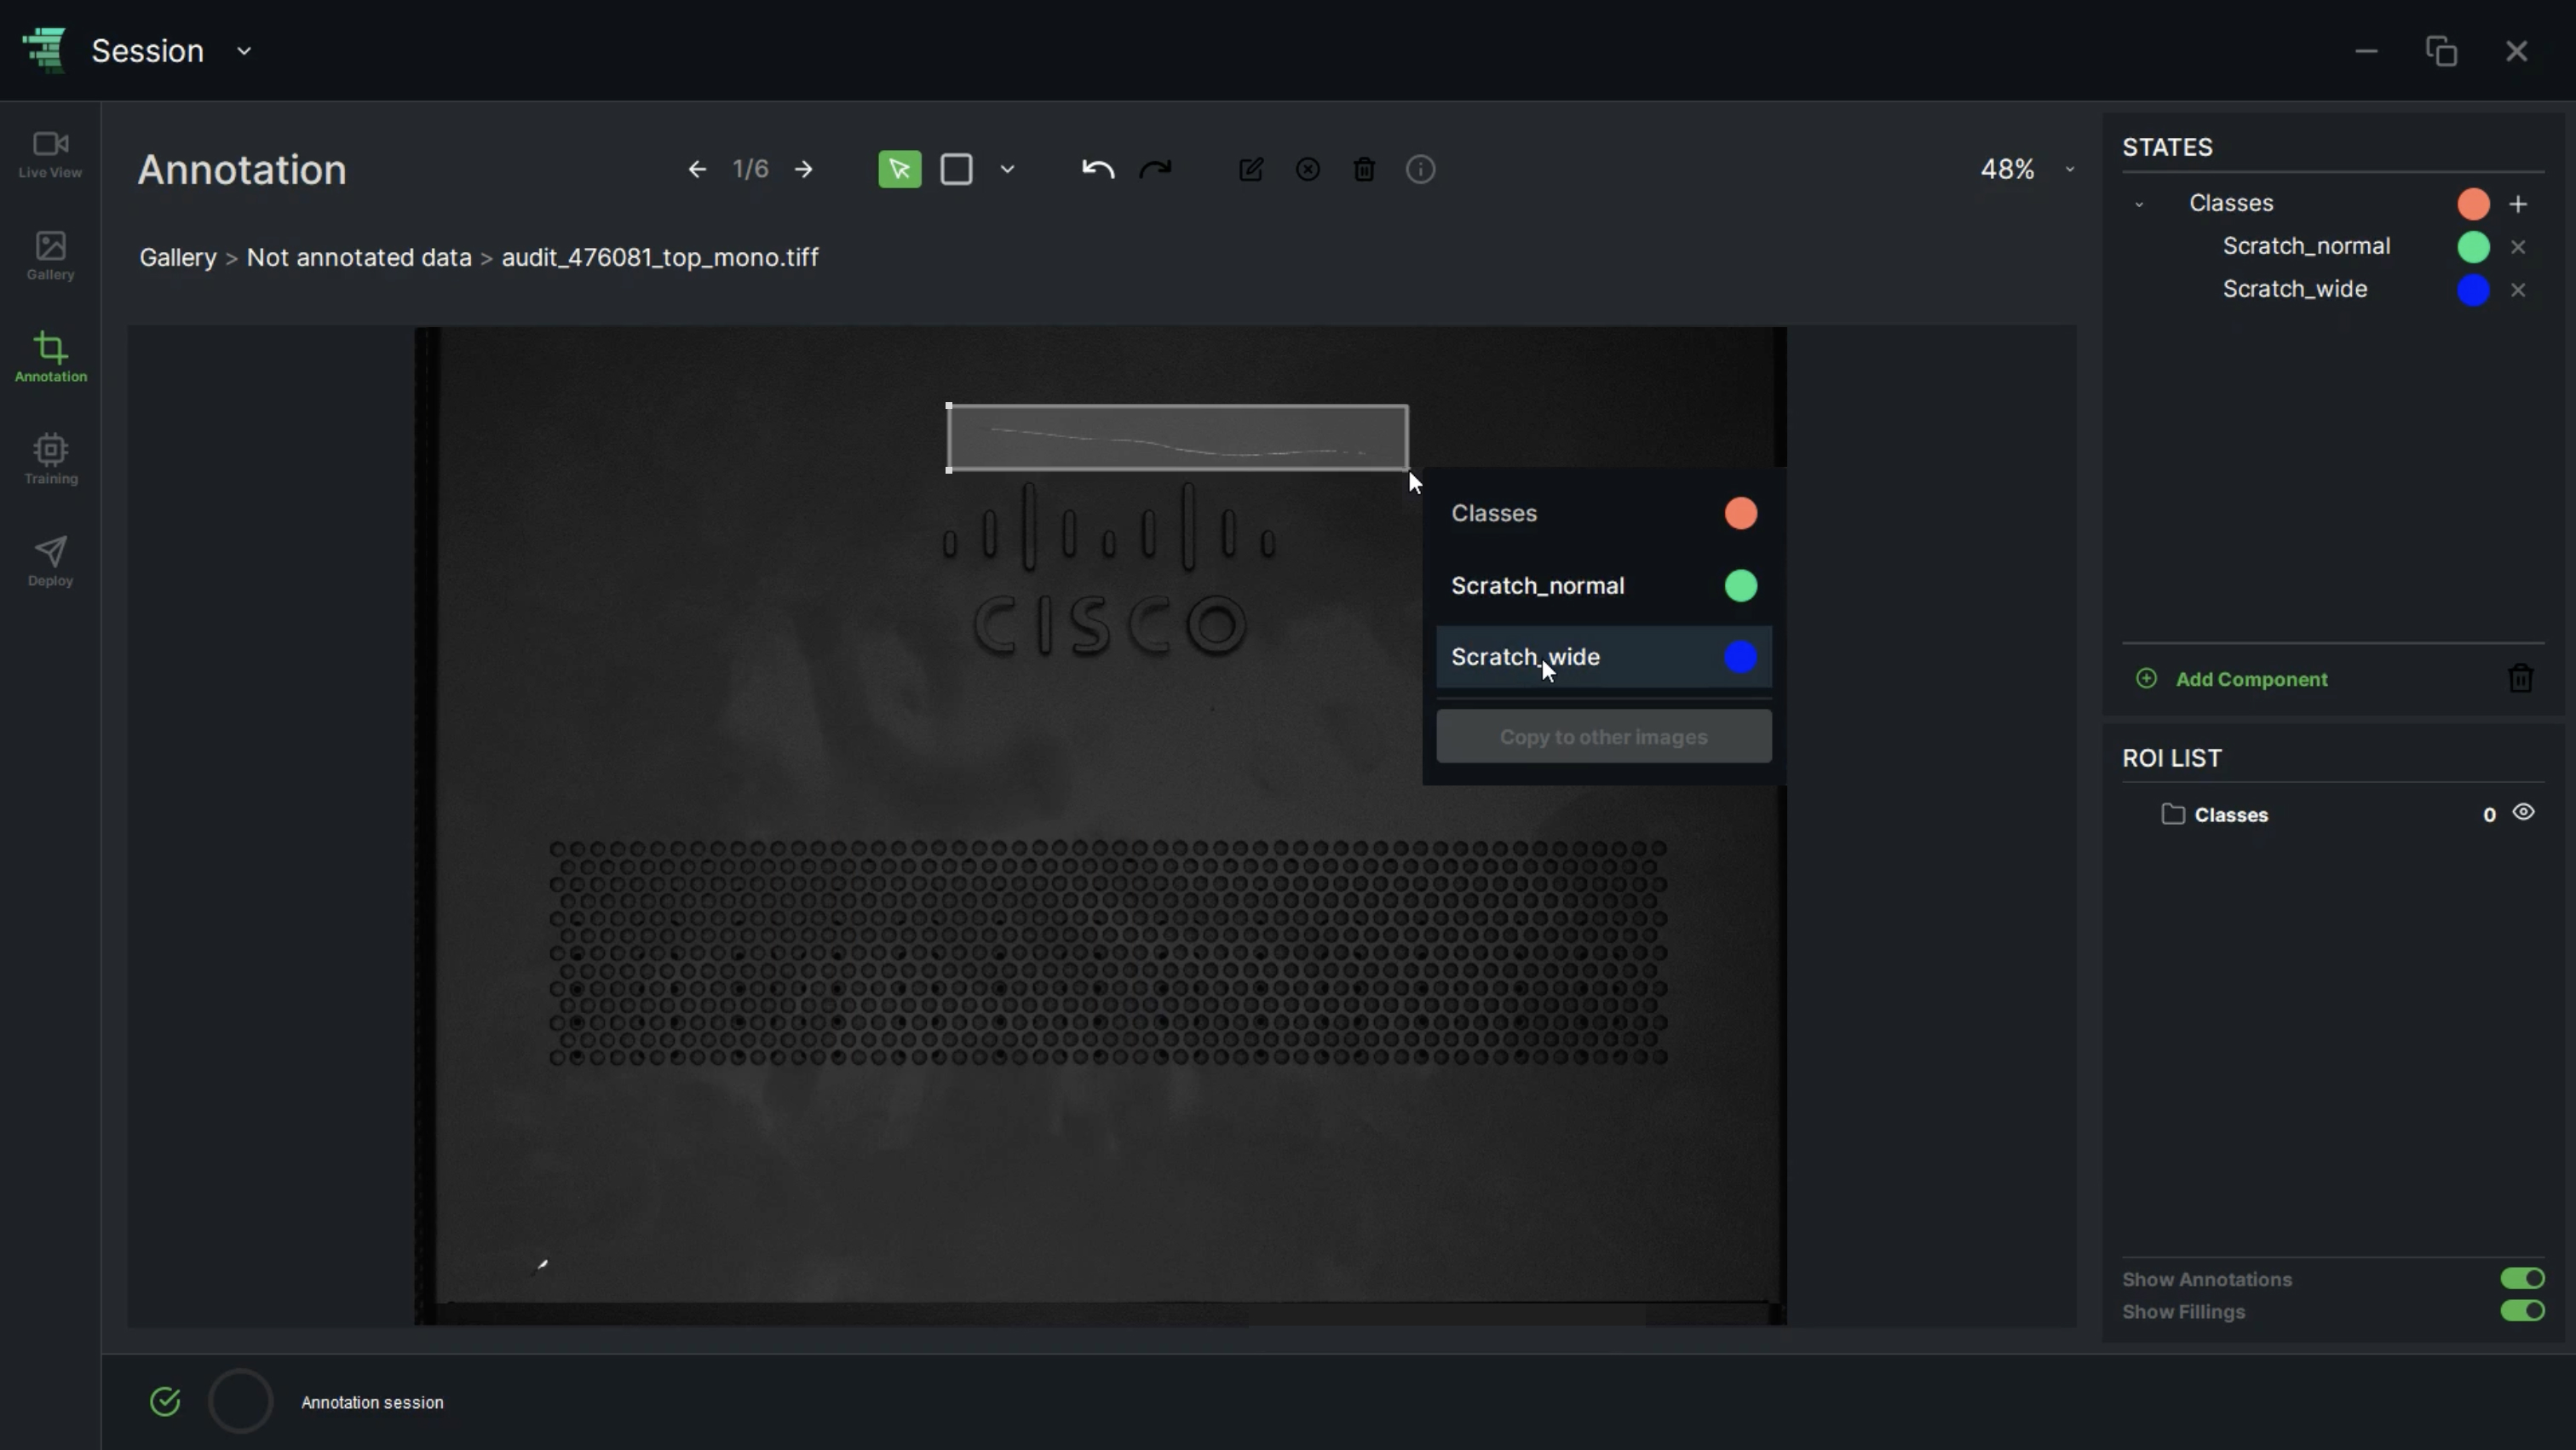
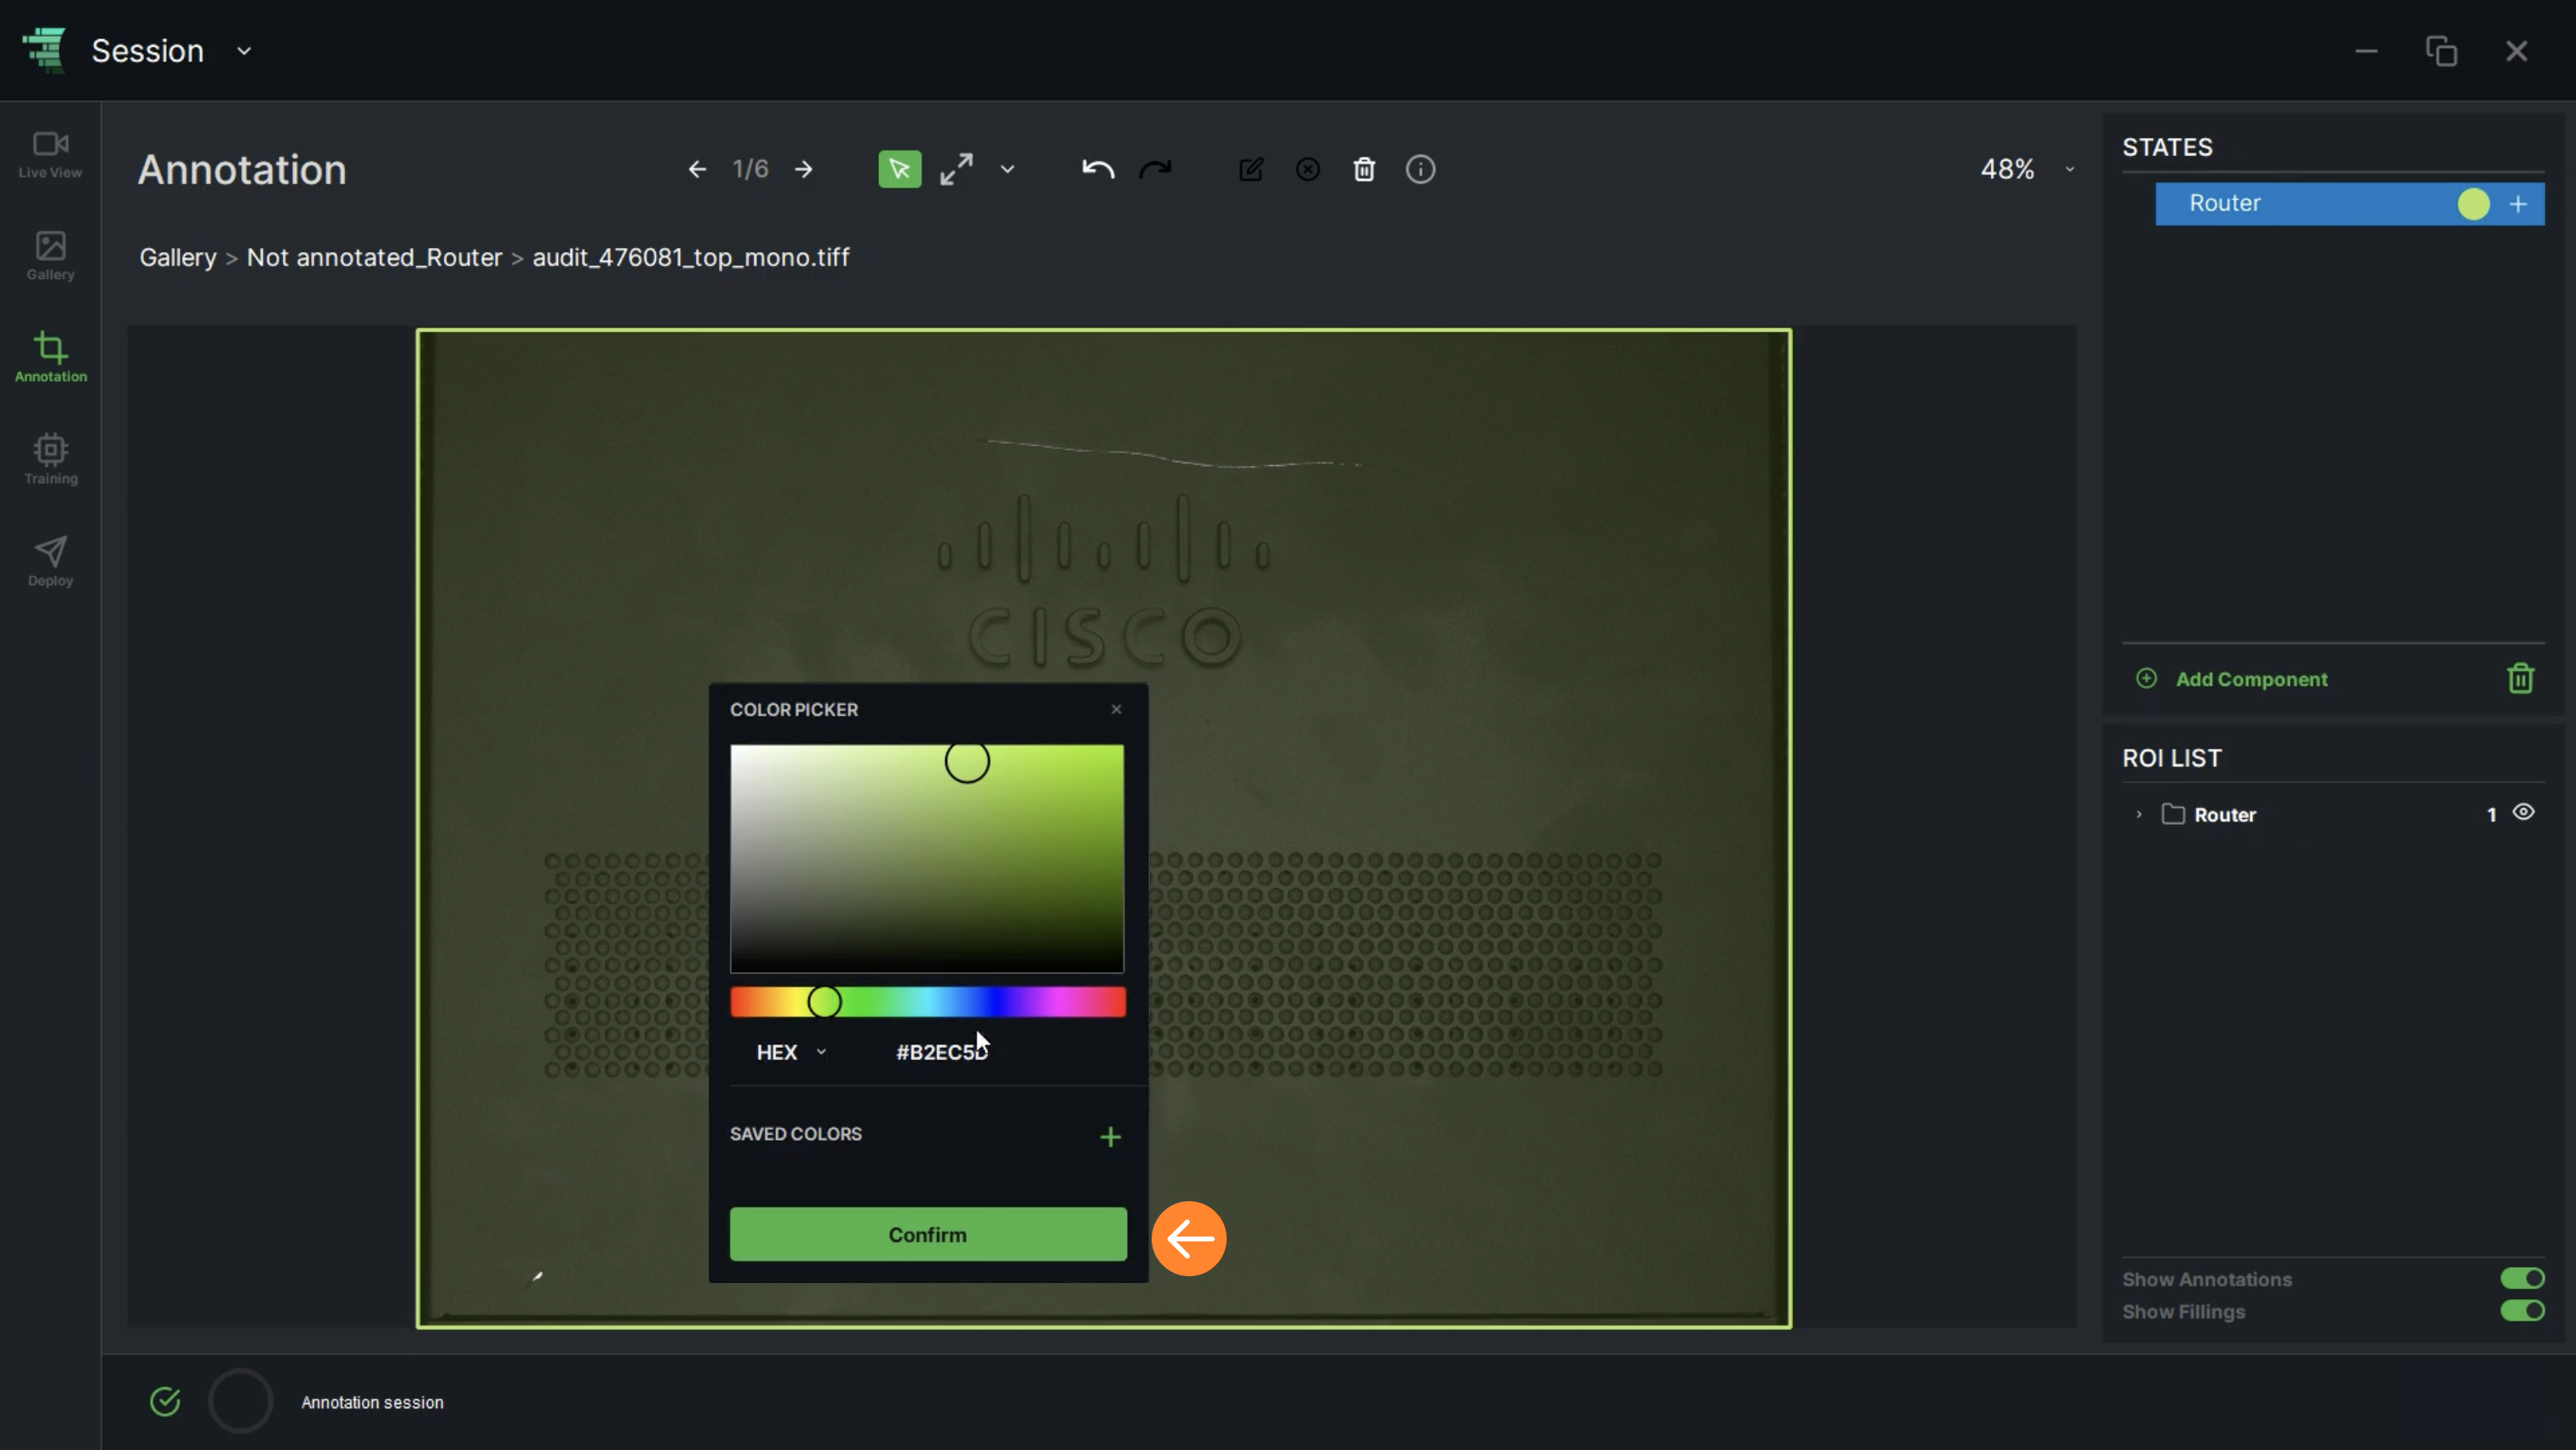
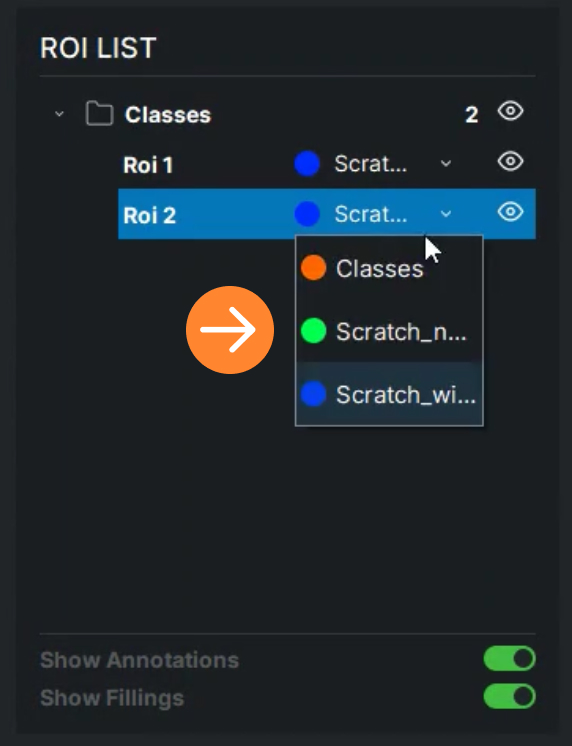
15. The user can change the ROI states by selecting options from the dropdown menu

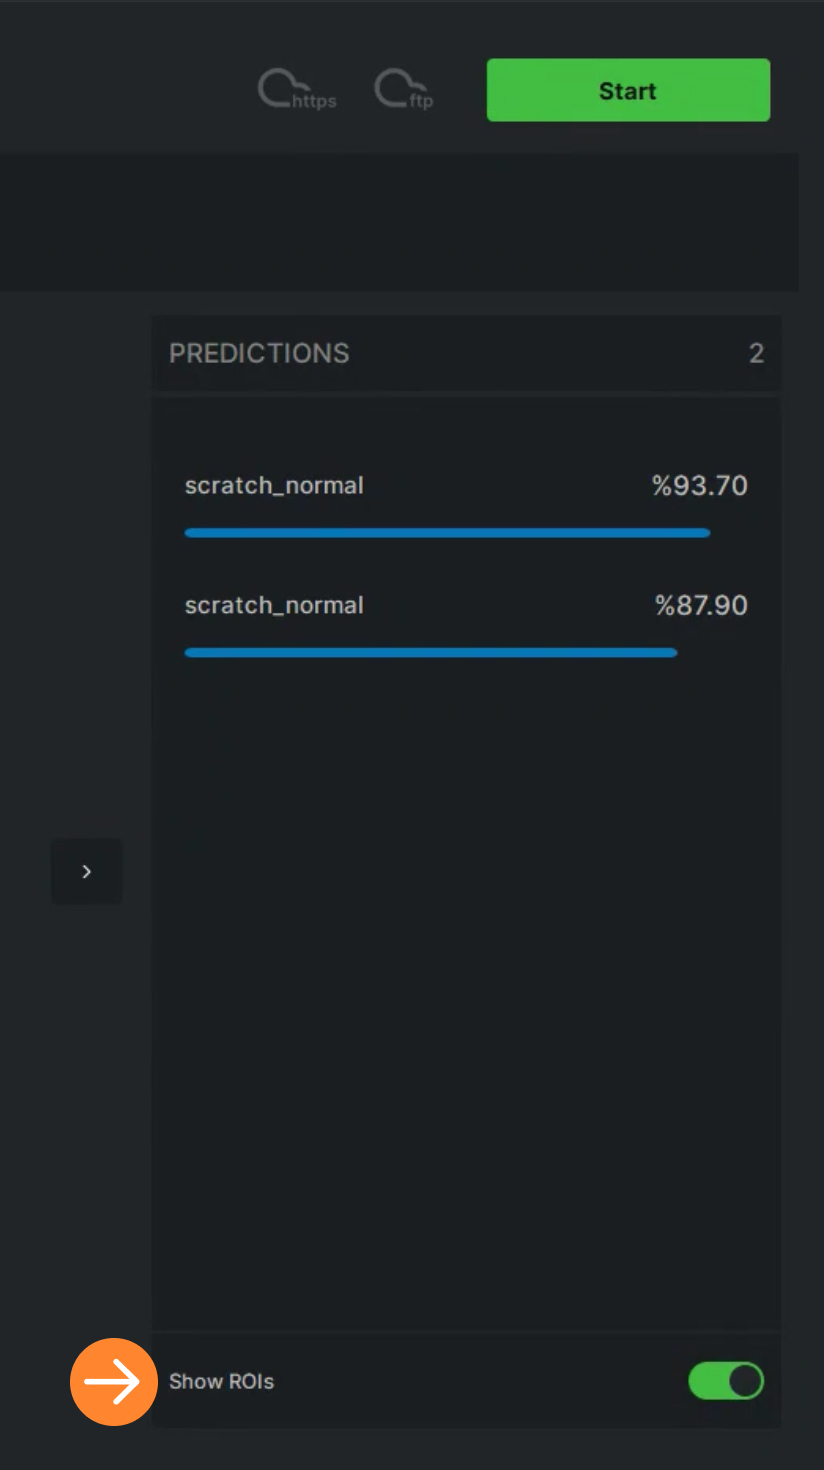
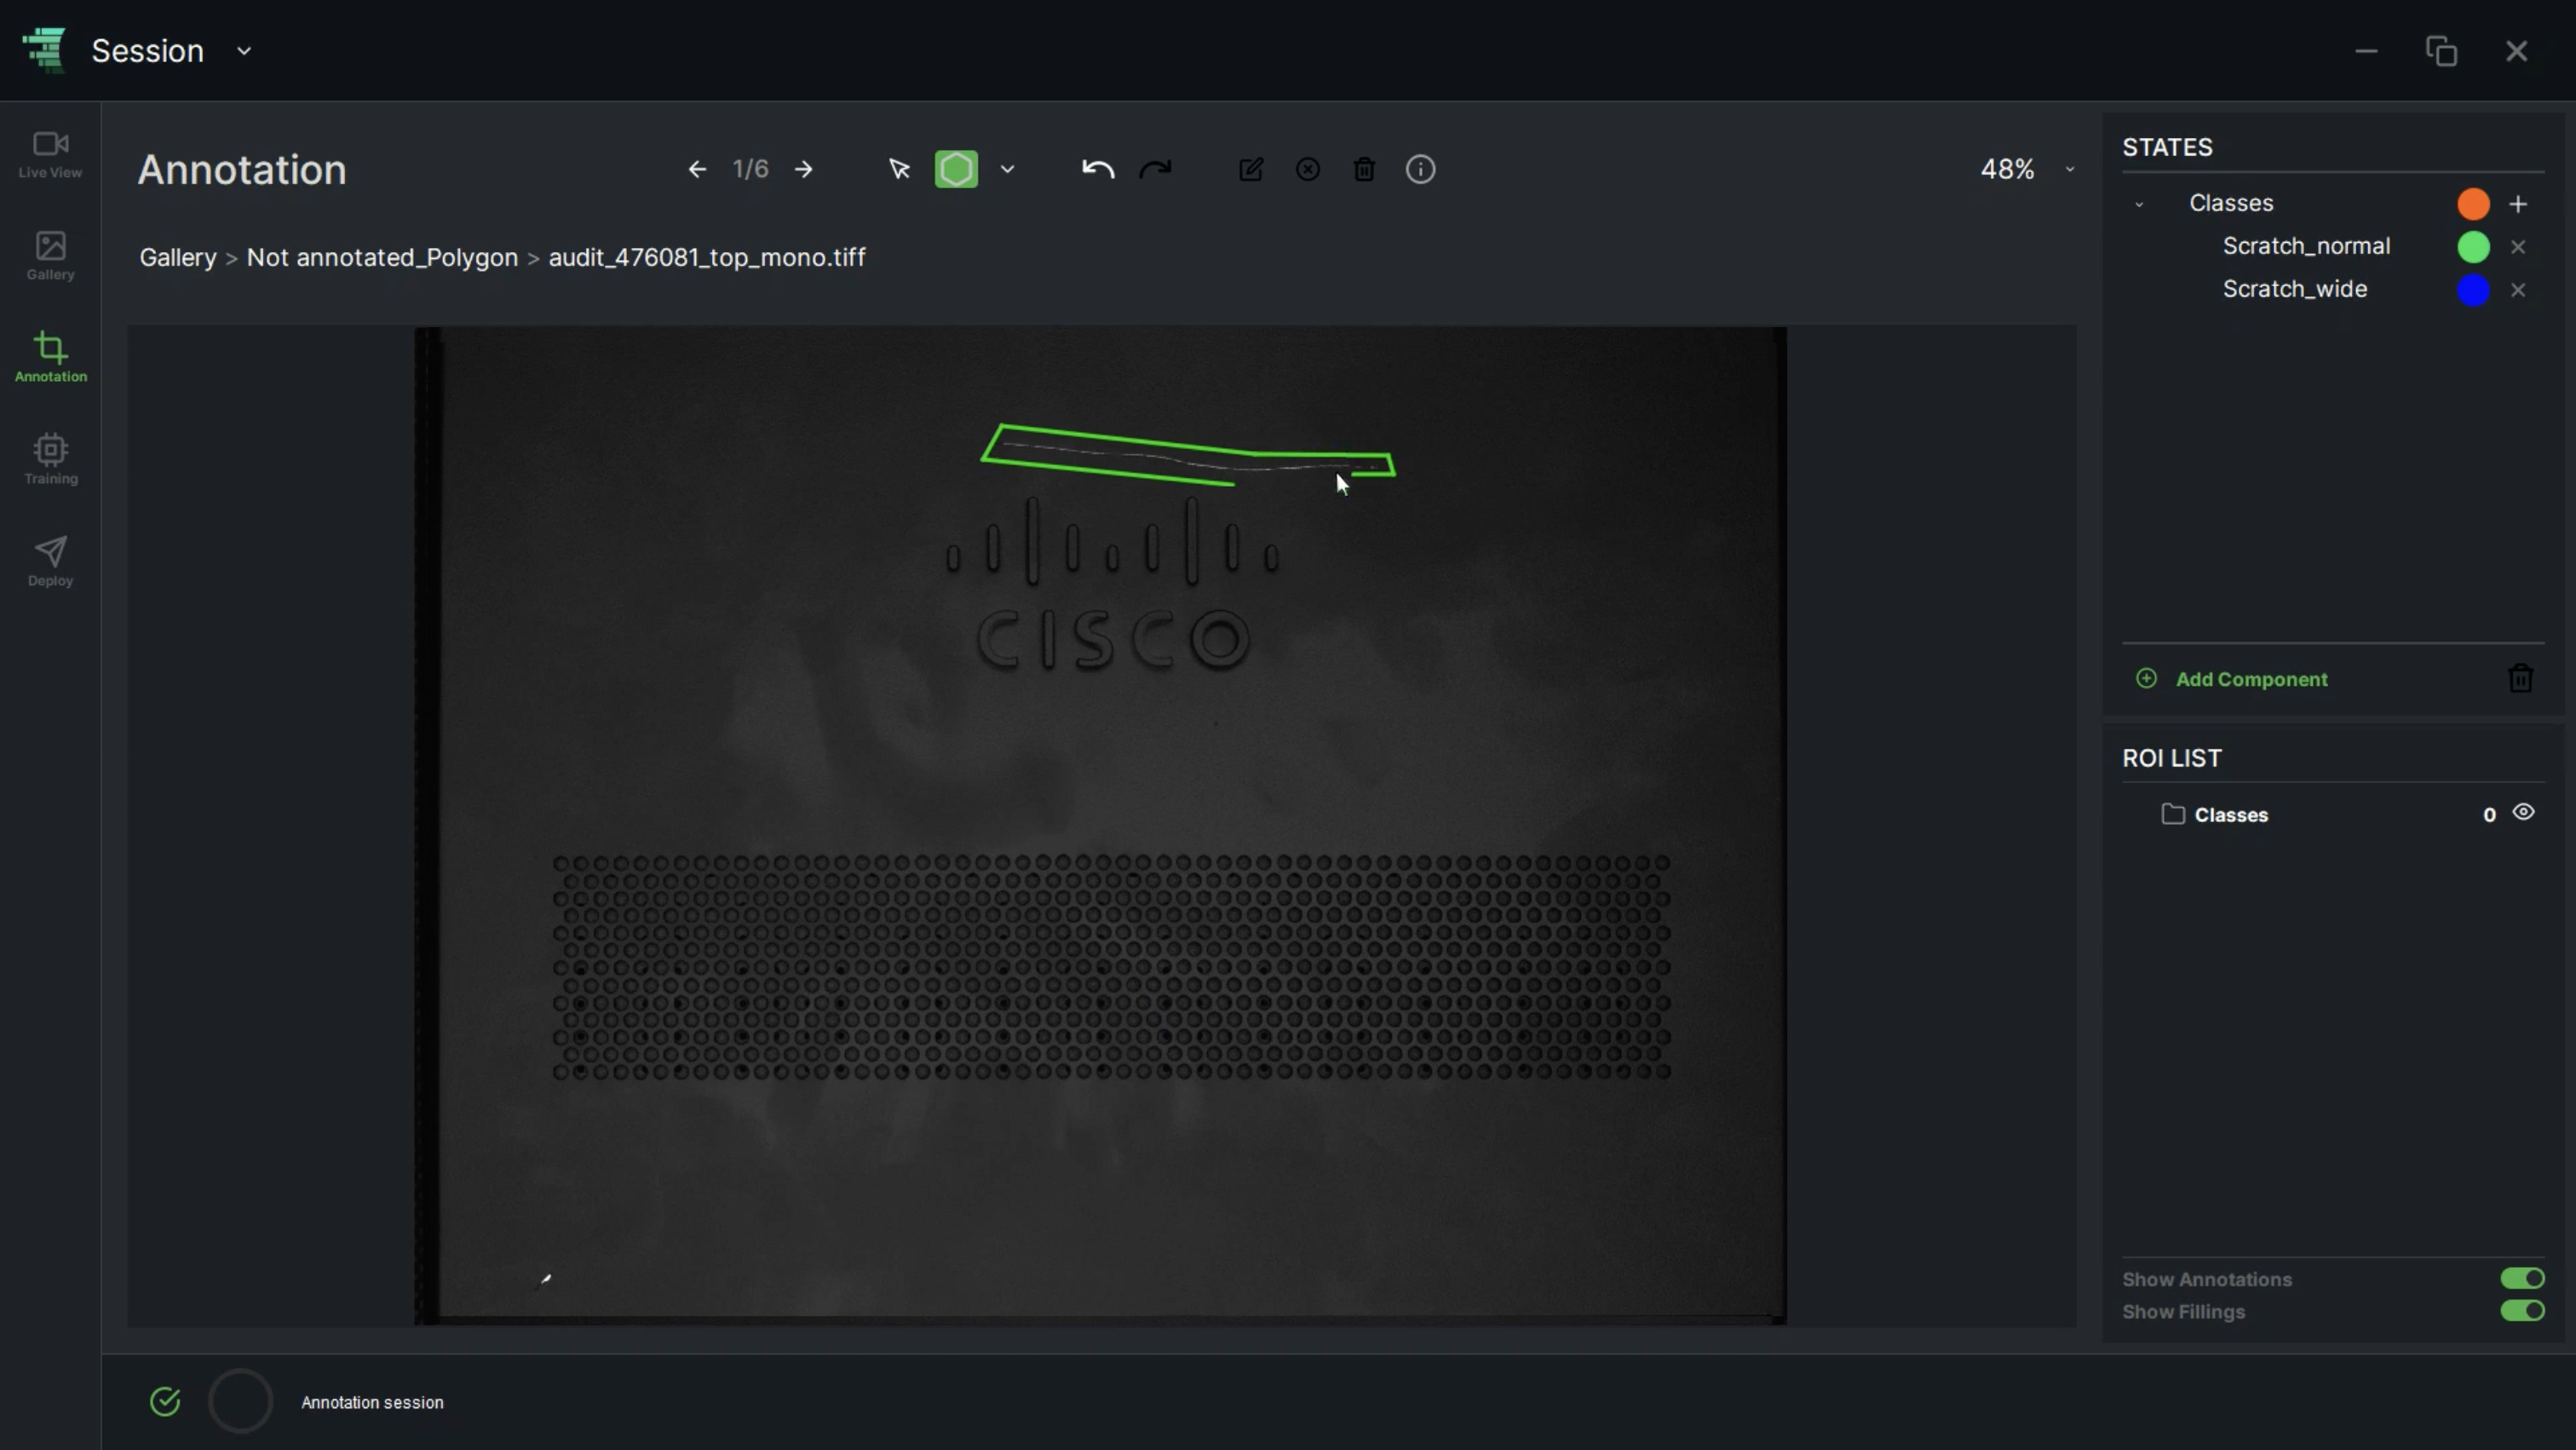
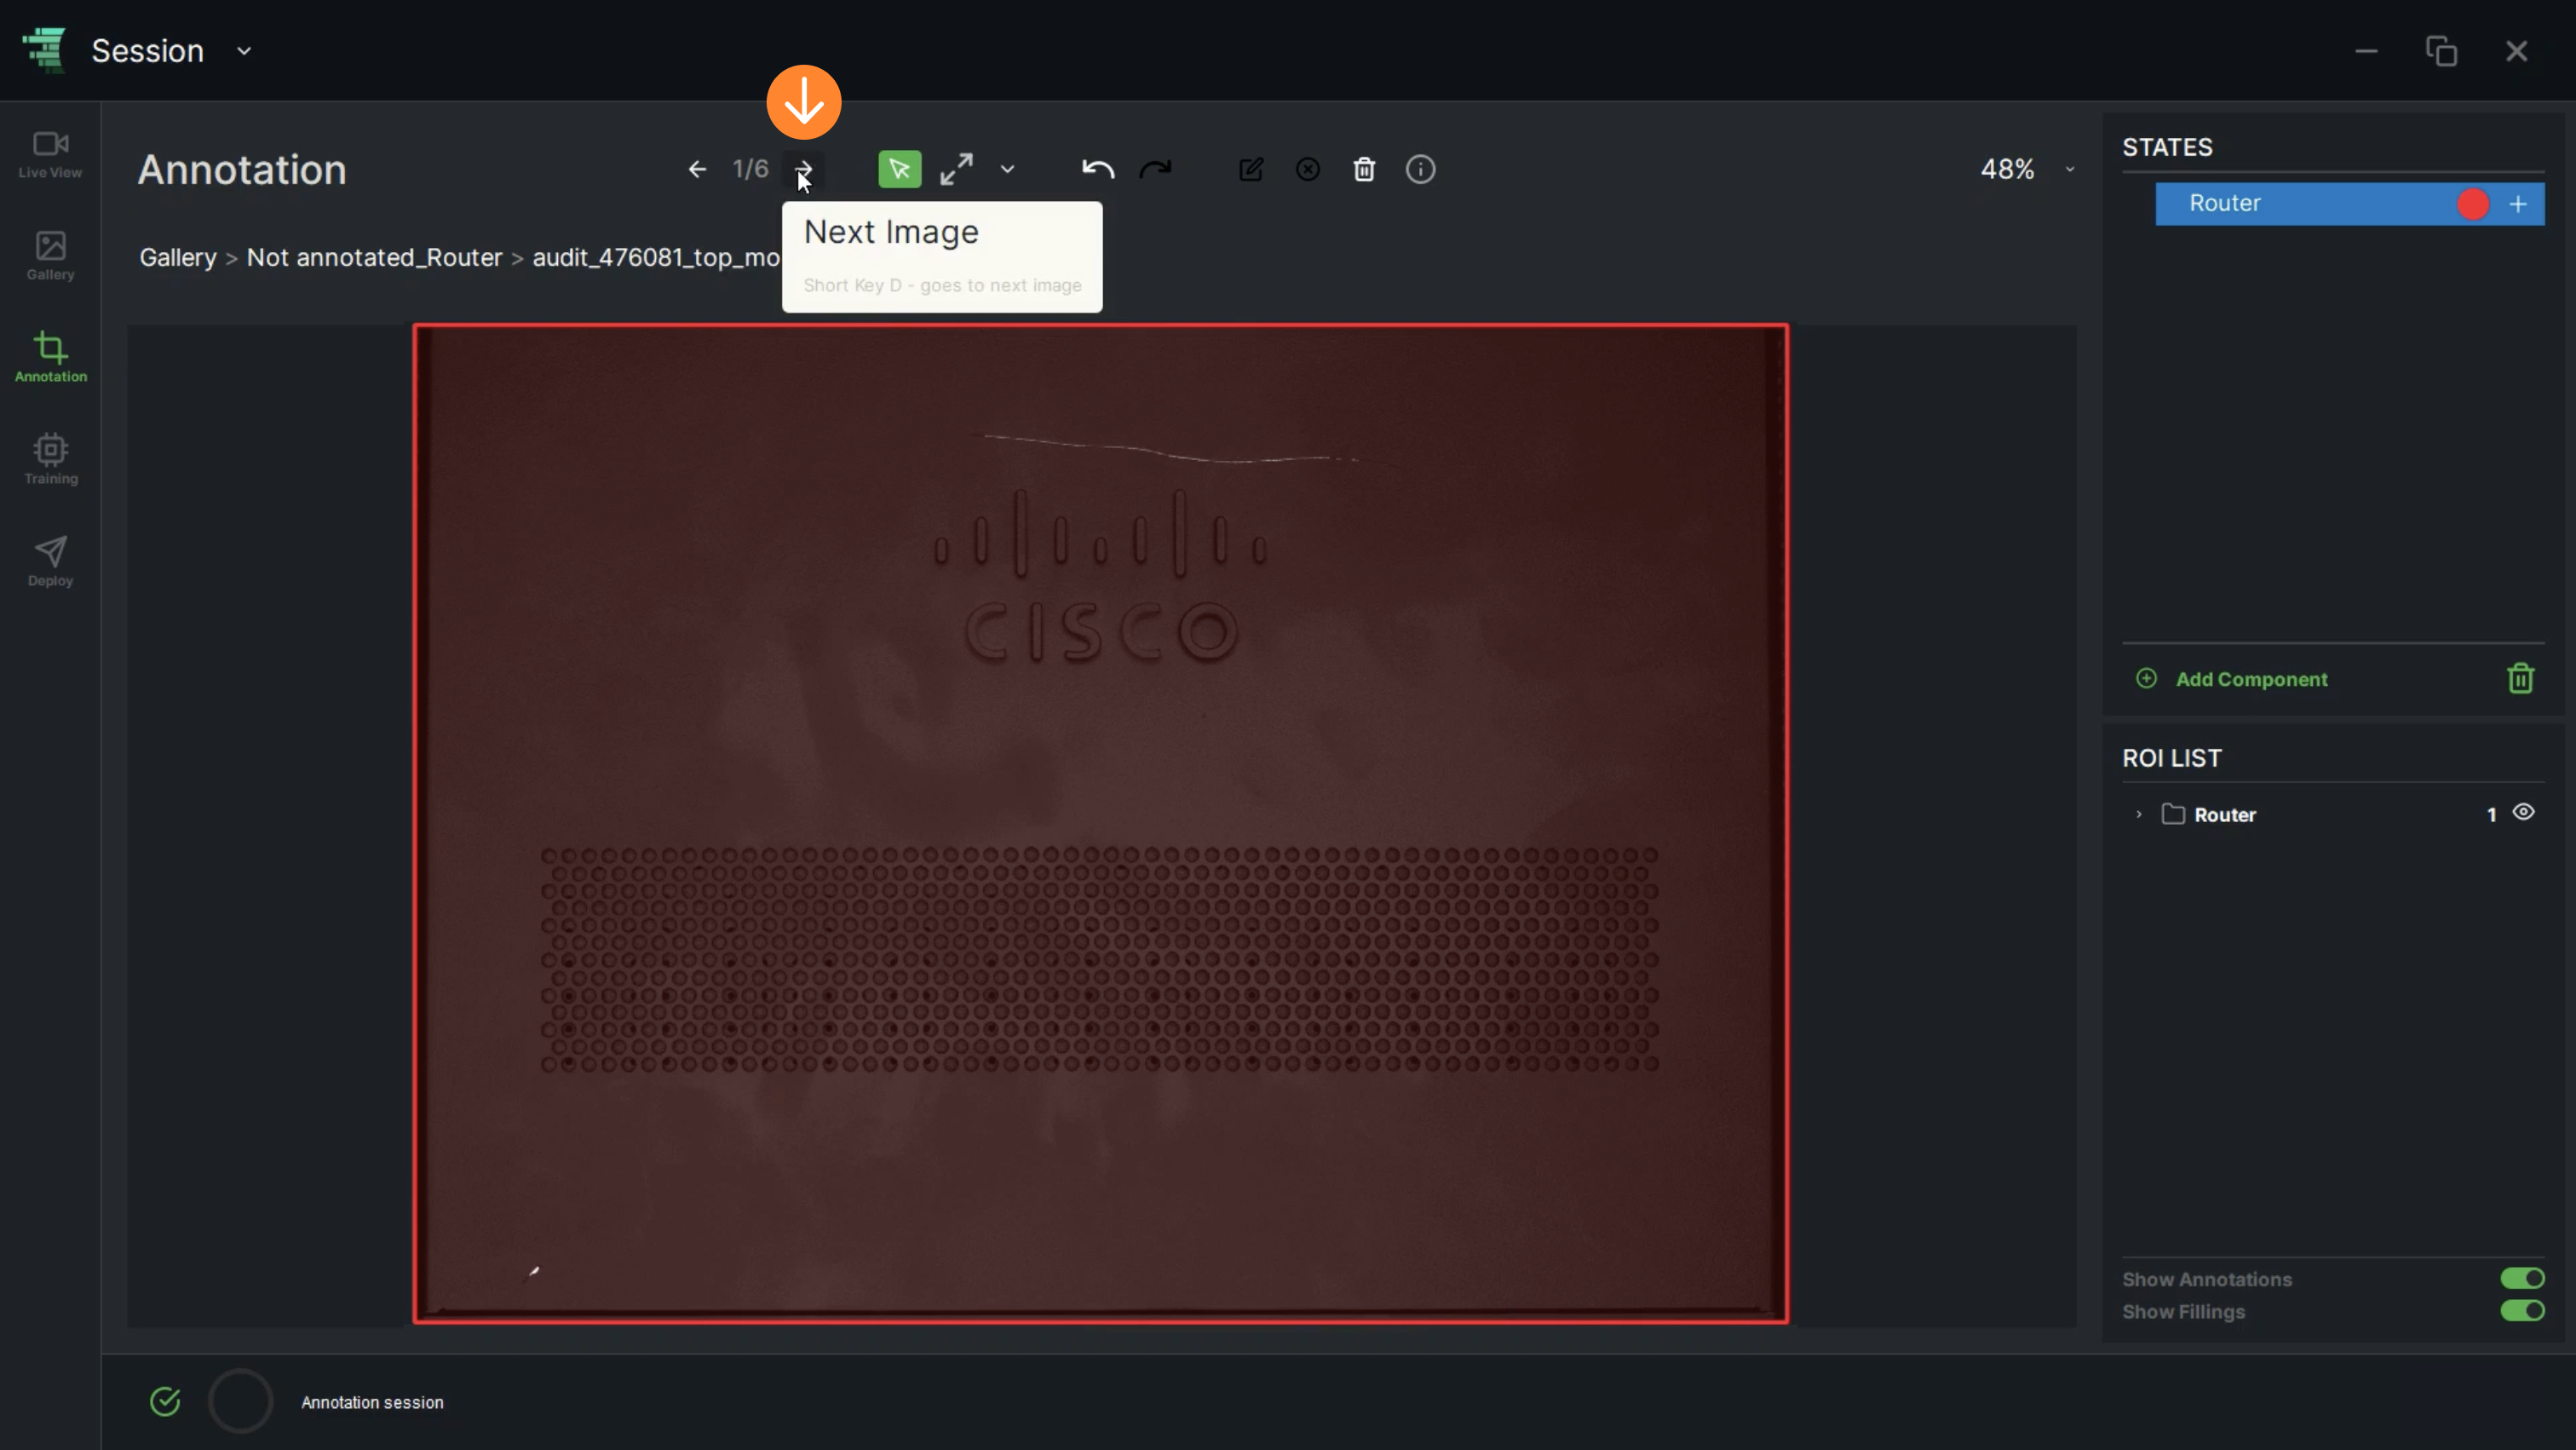
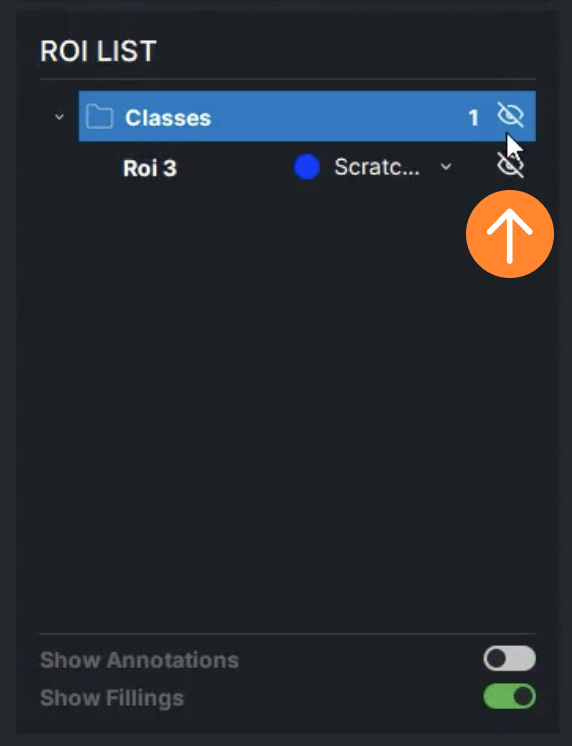
16. “Show Annotations” switch button allows the user to show/hide annotations

17. “Show Filling” switch button allows the user to show/hide the ROI fillings. If the fillings are hidden, only the edges will be displayed

Quality Automation with AI and Relimetrics

ReliTrainer: Design, Train, Deploy

Design-Train-Deploy functions of ReliTrainer module, available through ReliUI, provide AI powered solution designing, (re)training, testing and deploying services. These services are provided through the desktop application that communicates with the ReliTrainer module. The Live-view screen is for single camera image acquisition and automated inspections via manually running your solution on images acquired. The AI Block (re)training and testing involves model training and performance evaluation. The solutions are easily deployed to ReliAudit through the desktop application.

Training an AI block

  • Select a pre-implemented SoA AI model from ReliVision’s rich AI model library to train to perform supervised detection (based on YOLOv5, YOLOv7), classification (based on Resnet, Convnext, Mobilenet, GPUnet), semantic segmentation (Unet3Convnext4xDS).

  • Set the training hyperparameters (number of epochs, image resolution, learning rate, momentum, weight decay) or use the default values.

  • Select an annotated dataset and start training by simply hitting the “Train” button and monitor its progress via loss and accuracy curves. The system outputs the best performing model when the training is manually aborted or the maximum epoch number is reached. The validation set performance of the output model is reported in the Evaluation screen.

Testing an AI block

  • Select a trained AI module to run on any annotated dataset available in the data registry.

  • Run prediction and review individual outputs as well as summary performance metrics (IOU, mAP) in case there is a reference label set.

Deploying Your Solution

Re-training an AI Block

ReliTrainer: Design, Train, Deploy
Quality Automation with AI and Relimetrics

Live View

Choose a camera for live view and take images.

Build a dataset that can be annotated using Data Curation functions for training.

ReliTrainer: Design, Train, Deploy
Quality Automation with AI and Relimetrics

Training an AI Block

Select a pre-implemented SoA AI model from ReliVision’s rich AI model library to train to perform supervised detection (based on YOLOv5, YOLOv7), classification (based on Resnet, Convnext, Mobilenet, GPUnet), semantic segmentation (Unet3Convnext4xDS).

Set the training hyperparameters (number of epochs, image resolution, learning rate, momentum, weight decay) or use the default values.

Select a annotated dataset and start training by simply hitting the “Train” button and monitor its progress via loss and accuracy curves. The system outputs the best performing model when the training is manually aborted or the maximum epoch number is reached. The validation set performance of the output model is reported in the Evaluation screen.

1. In the Gallery screen, the user can check the images and the annotations before starting the training

2. In the left menu, go to “Training” and click on “Start” to train the model from the scratch

3. The user can make selections from the below options:

  • “First Training” allows the user to train a model from scratch
  • “Retraining” allows the user to retrain a previous model

4. “First Training” should be selected the first time the user is training the AI model. Then click on “Next” to continue

5. A Training Type should be selected from the options below:

  • “Detection” is utilized in the process of identifying and categorizing object regions
  • “Classification” is utilized for classifying regions of interest (ROIs)
  • “Semantic Segmentation” is utilized to precisely detect object shapes
  • “Instance Segmentation” is utilized to determine both the exact count and shape of objects

6. If an object detection model will be trained, the user should choose “Detection”. After selecting it, click on “Next” to proceed

7. If the imageset hasn't been split previously, it should be divided into a Train Set and a Test Set at this stage. Once the split is completed, the user can proceed by clicking the “Next” button

8. After selecting the component name, click on “Next”

9. Detecting the optimal architecture for the training is done automatically. Settings can be reconfigured from “Advanced Options” if needed

10. The user can select a network architecture between the “Advance Options” options:

  • “ReliNetDet-Lite” can be chosen for a small-size network
  • “ReliNetDet” can be chosen for a normal-size network

Once it is selected, click on “Next” 

11. The user should define a model name (e.g. Scratch_Detector) according to the use case, then click on “Next”

12. “Load Defaults” button allows the user to set the training parameters automatically. Additionally, the user has the option to manually input custom parameters

13. The user can add the additional training parameters by clicking on the “Load Defaults” button. Then, simply click on “Next” to proceed

14. The user should synchronize the data before training by clicking on “Synchronize” button

15. When the data synchronization is done, click on the “Start Training” button

16. In the Status tab, Model Loss and Mean Average Precision plots can be checked in real-time

  • Model Loss Curve: This is a graphical representation that illustrates how the loss of the model changes over epochs during both the training and validation phases. The loss curve provides valuable insights into the model's performance and convergence throughout the training process
  • Training Loss Curve: This curve shows how the loss decreases during the training phase. It provides information on how well the model is fitting the training data (blue curve)
  • Validation Loss Curve: This curve shows how the loss changes during the validation phase, using data that the model hasn't seen during training. It helps assess the model's generalization ability (green curve)
  • mAP: This is the mean or average of the AP values calculated for each object class. It provides a single measure of the model's performance across all object classes. Higher mAP values indicate better overall performance
  • Accuracy: It measures how often the model correctly identifies objects (both true positives and true negatives) out of all objects present in the image. It is the ratio of correct predictions to the total number of predictions

17. The user can monitor the progress of the training by checking the Status bar

18. Once the training has finished, click on “Evaluation” tab to see the training statistics:

  1. Total number of images
  2. Accuracy
  3. Mean IoU

19. Mean IoU can be changed by moving the slider

  • “Mean IoU” is the average of IoUs
  • “IoU” measures the overlap between the predicted bounding boxes and the ground truth bounding boxes
  • The mispredicted images and their corresponding Mean IoU scores are displayed in the table view
ReliTrainer: Design, Train, Deploy
Quality Automation with AI and Relimetrics

Testing an AI Block

Select a trained AI module to run on any annotated dataset available in the data registry.

Run prediction and review individual outputs as well as summary performance metrics (IOU, mAP) in case there is a reference label set.

1. In the training screen, the “PREDICTION” tab enables the user to start a testing process on a model by simply clicking on “Start” button

2. The user should select a model for prediction and click on “Next”

3. The user should select the Imageset that will be used for prediction and then click on “Next”

4. The user should synchronize the data before the prediction by simply clicking on “Synchronize” button

5. When the data synchronization is done, click on “Start Prediction” button

6. The user can review the model's prediction results by checking the list of images on the left side along with the corresponding region predictions and their respective precision values on the right side

7. “Show ROIs” switch button on the bottom allows the user to show/hide annotations

8. Prediction results alongside the annotations can be reviewed from the Gallery, by clicking on the dataset

9. The image displays both the predictions and the annotations, which are clearly marked

10. In the “STATES” column, the user can check the defined classes alongside the prediction results generated by the trained model (E.g. ScratchDetector)

11. In the “ROI LIST” column, the user has the ability to review the ROIs for both classes and the trained model results

12. The user can hide/show the classes or the prediction results’ ROIs by clicking on the “View” icon

ReliTrainer: Design, Train, Deploy
Quality Automation with AI and Relimetrics

Deploying Your Solution

1. The user should click on “Set Deployment” button and enter the Audit Backend & ReliTrainer URLs to start the deployment

2. New tasks can be created from the MVS tool. Once a task is created, it will be displayed as a new task in the Deploy screen. In the Deploy screen, the user can;

  • Check existing tasks and filter them by their training types;
  • Classification
  • Object Detection
  • Semantic Segmentation
  • Instance Segmentation
  • Search a task by entering the name in the search bar
  • Compare tasks according to given details; training type, active model, training statics and audit statics
  • Edit deployment settings
  • Retrieve Audit Images for further retraining

3. If the user double-clicks a task, a relevant model list and their details will be displayed. In the task detail, the user can;

  • Check the list of trained model results;
  • Model name
  • Date of activation
  • Train mAP50
  • Eval mAP50
  • Accuracy
  • Inference Speed
  • Reviewed and Processed Images Overview
  • Status
  • Activate any model by pressing “Activate Model” button on the status column
  • Delete the model from “More” icon () on the top right
  • “Deploy New Model” by clicking on the top right button

4. If the user clicks on the “Activate New Model” button, the status will be changed to “Activated”. New model will be processed in ReliAudit

5. If the user clicks on the “Deploy New Model” button, a pretrained model list will be displayed. The user can select any model from the list. Once a model is selected, click on “Deploy”

6. Deploying a new model may take a while. Once deployment is completed, click on “Close” (X) icon on the top right

7. Selected model will be activated automatically and it will be added to the model list

8. “Retrieve Audit Images” button allows the user to retrieve images from ReliAudit

9. Once it is clicked, a pop up will be shown. The user can filter the time by clicking on the “Time” dropdown. The available options are;

  • Today
  • Last week
  • Last month
  • Last 3 months
  • Last 6 months
  • Last year
  • All time
  • Custom range

10. “Disputed images only” selection allows the user to import disputed images from ReliAudit. “Image Acquisition” selection allows the user to retrieve all images

11. First, click on the “Synchronize”, then “Retrieve” button to proceed

12. Once synchronization is done, go to “Gallery” and check the dataset. The user can use the selected dataset for further retraining

ReliTrainer: Design, Train, Deploy
Quality Automation with AI and Relimetrics

Re-Training an AI Block

1. To retrain a pre-trained model, the user should go to Training tab and click on “Start”

2. Select “Retraining” option and click on “Next

3. Select Training Type from the provided options:

  • “Detection” is utilized in the process of identifying and categorizing object regions
  • “Classification” is utilized for classifying regions of interest (ROIs)
  • “Semantic Segmentation” is utilized to precisely detect object shapes
  • “Instance Segmentation” is utilized to determine both the exact count and shape of objects

4. If an object detection model will be retrained, choose “Detection” and click on “Next” to proceed

5. Select the model (E.g. Scratch Detector) that will be used for retraining and click on “Next”

6.  Select the imageset and click on “Next”

7. After selecting the component name (E.g. Classes), click on “Next”

8. Detecting the optimal architecture for the retraining is done automatically. The user can reconfigure settings from “Advanced Options”

9. The user can select between the “Advanced Options”:

  • “ReliNetDet-Lite” can be chosen for a small-size network
  • “ReliNetDet” can be chosen for a normal-size network. Once it is selected, click on “Next”

10. Assign a model name (E.g. Retraining_session_v6)

11. “Load Defaults” button allows the user to set the retraining parameters automatically. Additionally, the user has the option to manually input custom parameters (E.g. Epoch: 700)

12. If “Load Defaults” button is clicked, default retraining parameters are set automatically

13.  Click on “Synchronize” button

14. When the data synchronization is done, click on the button “Start Training”

15. While retraining processes, the user can see the Model's Loss and Mean Average Precision (mAP) plot in real time

16. Check the retraining process in the Status bar

17. Once the retraining has finished, click on “Evaluation” tab to see the retraining statistics: Total Number of Images, Accuracy and Mean IoU

18. The mispredicted images and their corresponding Mean IoU scores are displayed in the table view

19. After the retraining process, the model becomes accessible among the trained models, allowing the user to utilize it once more for retraining

Quality Automation with AI and Relimetrics

ReliAudit: Shop-Floor Integration

ReliAudit is the optional edge module of ReliVision for automated QA system integration on the shop-floor, built on the RMIE engine. It natively communicates with ReliTrainer over secure VPN connections to receive ready-to-deploy AI powered solutions (pipelines), solution updates and to send audit results and statistics. It also has a built-in web HMI to review audit results right on the shop-floor. 

The ReliAudit tasks are:

  • Running preconfigured QA pipelines through automated triggering on images fetched/received from shop-floor sensors/cameras

  • Keeping QA results and statistics presented through the web HMI dashboards

  • Allowing shop-floor QA review functions with accept/dispute capabilities to be exploited for AI model maintenance through model retrainingAllowing shop-floor QA review functions with accept/dispute capabilities through the web HMI, for AI model improvements

Each production / manufacturing process has its own peculiarities, constraints and needs. ReliAudit has been built with a flexible generic architecture that allows it to be integrated with shop-floor systems with ease. A native configuration tool (MCT) is provided to define/modify QA tasks in ReliAudit. Nevertheless, the module can also be used through a custom integration over the two end-points provided to receive data (images) to be analyzed with the proper trigger to run the right solution and to output inspection results. Relimetrics offers optional system integration services and consultancy services for customized integrations.

Relimetrics also offers optional pre-configured shop-floor imaging systems covering a wide variety of use cases, namely ReliScanner and ReliMVS (both static and robotic versions):

  • ReliScanner - A scanning solution most suitable for high resolution inspection of flat surfaces

  • ReliMVS - A static/robotic multi-camera system for single/multi view inspections ranging from configuration and assembly checks to cosmetic/structural defect checks

ReliScanner in action

ReliAudit: Inspect, Monitor and Control
Quality Automation with AI and Relimetrics

Inspect & Monitor

Running and Monitoring a deployed (pipeline) solution

Under construction
ReliAudit: Inspect, Monitor and Control
Quality Automation with AI and Relimetrics

Sample & Review

Sampling & Reviewing (accept/dispute) inference outputs

Under construction
Quality Automation with AI and Relimetrics

Manufacturing Company Performing QA with ReliVision

User Profile: A hardware and/or service vendor without manufacturing but with a rich portfolio of manufacturing customers.

Sample Storyline: Following the system installation and hardware integration

  • The customer’s R&D team is briefed about a QA automation task by the production engineers.
  • The R&D team collects images from the shop floor either totally remotely or by using the operators in the field and pulling the images from the shop floor.
  • The R&D team either annotates the data or delegates annotation task to annotators registered in the system.
  • The R&D team reviews the annotated data.
  • The R&D team divides the data into training and testing sets.
  • The R&D team builds a solution pipeline and uses the prepared training dataset to train the AI block(s) in the solution pipeline. The training is evaluated automatically using a validation set determined at random as a (user specified sized) subset of the training data.
  • The R&D team runs experiments with different AI models selected from the AI model library, different hyperparameter settings, (if available) different training sets and compare their performances on the spared testing set.
  • The selected AI solutions are incorporated into the solution pipeline and deployed remotely.
  • The deployed solution runs in the shop floor while logging outputs.
  • Field operators check the manufacturing process and find no problem.
  • Field operators sample and review the system outputs to accept/dispute the results.
  • The R&D team pulls the disputed results and retrains the AI blocks in the solution pipeline.
  • The improved solution is compared with the existing solution and is deployed remotely

User Profile:  A manufacturing company without its own R&D team but with vast shop-floor operations

Sample Storyline: Same scenario but with Relimetrics team remotely providing the R&D services for the customer if/when needed.

Quality Automation with AI and Relimetrics

Partner Company Offering ReliVision to its Customers

User Profile: A hardware and/or service vendor without manufacturing but with a rich portfolio of manufacturing customers.

Sample Storyline:

  • The partner’s support team presents the sample solution, that they had pre-built on sample data (w/o Relimetrics support), to their customers.
  • The partner’s customer is interested and wants to try ReliVision. So, the partner’s support team organizes a training session on how to use the pre-built solution.
  • The customer asks for a customization of the pre-built solution.
  • The partner’s support team acquires data from the customer, anotates it, trains a custom solution for their customer and deploys, all without any coding.
  • The partner’s customer uses the solution in conjunction with the partner’s hardware and/or services.
  • After some time, the partner’s customer comes up with a totally new use case and asks the partner for a solution.
  • The partner’s support team offers to train their customer on how to design and train a solution on their own:
  • The customer agrees and a training session is organized by the partner, with support from Relimetrics.
  • OR
  • The customer wants a turn-key solution, so the partner’s support team designs, trains and deploys a new solution, all without any coding. The partner’s support team consults Relimetrics if/when needed.
Quality Automation with AI and Relimetrics

ReliVision Released Versions

Request A tRIAL
  • ReliUI (F_RV_Ver2.1.Beta): ReliTrainer Client App for data curation and model training/testing/deployment (Preconfigured to connect to Relimetrics Berlin servers via VPN access by RM users. Works with ReliTrainer Engine Ver A and ReliAudit Engine Ver A) - Last update: Aug 23, 2023

    Download
    (internal use only)
  • ReliUI (F_RV_Ver2.0): ReliTrainer Client App for data curation and model training/testing/deployment (Preconfigured to connect to Relimetrics Berlin servers via VPN access by RM users. Works with ReliTrainer Engine Ver A and ReliAudit Engine Ver A) - Last update: Oct 11, 2023

    Download
    (internal use only)
  • ReliTrainer Engine (B_RV_Ver_A): ReliTrainer Engine  - Last update: Aug 23, 2023

    Download
    (internal use only)
  • ReliAudit Engine (B_RV_Ver_A): ReliAudit Engine with web HMI - Last update: Aug 23, 2023

    Download
    (internal use only)
Quality Automation with AI and Relimetrics

Demo Tools and Materials

  • ReliUI (v2.0): (Preconfigured for demo purposes to connect to demo server  where the demo cases are preloaded.) - Last update: Oct 11, 2023

    Silicon wafer defect detection dataset: The task is to inspect microscopy images of a silicon wafer with a lattice of in-silico structures to detect and classify these structures as OK / NOK and determine the type of defect. The data is in gray-scale and annotated with labelMe. - Last update: Aug 13, 2023

  • X-ray airport luggage security check dataset: The task is to inspect pseudo-colored x-ray images of luggage to detect knives, hammers, guns and scissors in a luggage. The data is colored and unannotated. - Last update: Aug 13, 2023

  • Cosmetic surface scratch detection on electronic devices dataset: The task is to detect cosmetic imperfections (scratches, bumps, spots, imperfect decals, misaligned labels) on the surfaces of an electronic device at the end of production line. - Last update: Aug 17, 2023

  • Electronic device Component check dataset: The task is to detect latches in servers and classify as open/closed. The data is annotated with YoloV3. - Last update: Aug 17, 2023