

Detection of Defects on Tiles
This playbook demonstrates how to detect defects and contamination on ceramic tiles, including cracks, dye, oil, and glue, without distinguishing between their types. A segmentation model is used to identify all affected areas under a single class, Defect. The model is used in a single inspection pipeline.
The dataset
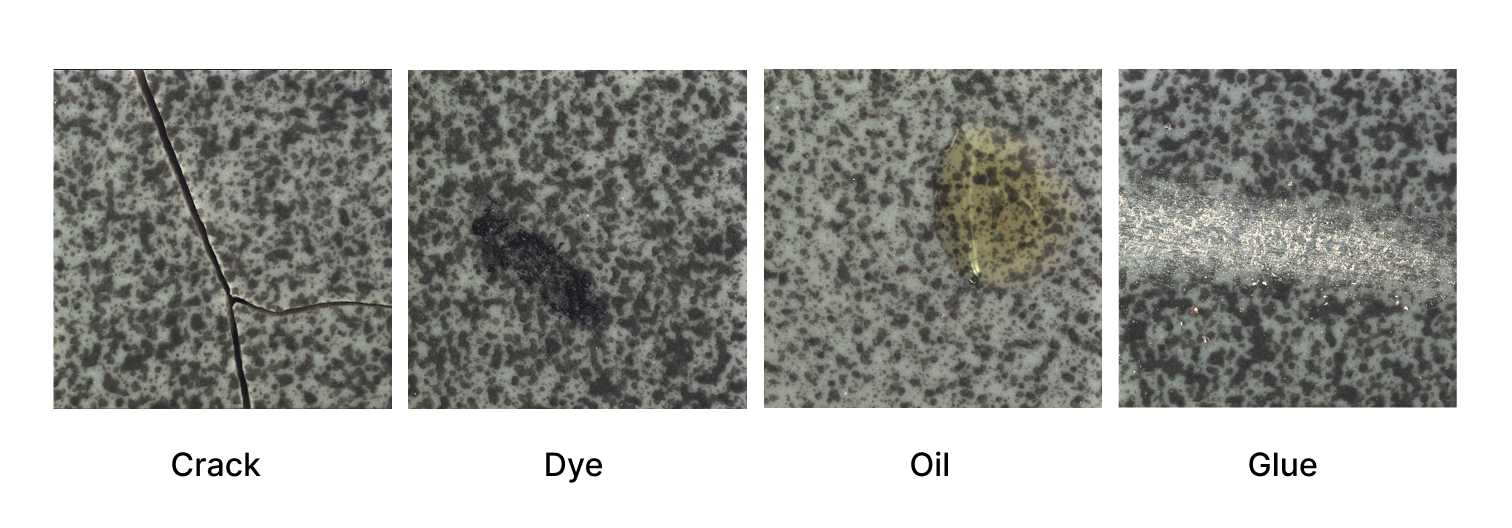
The dataset contains 84 defective or contaminated tiles and 33 normal tiles. The four kinds of defect are all annotated in LabelMe format, as shown below.
Load the annotated dataset
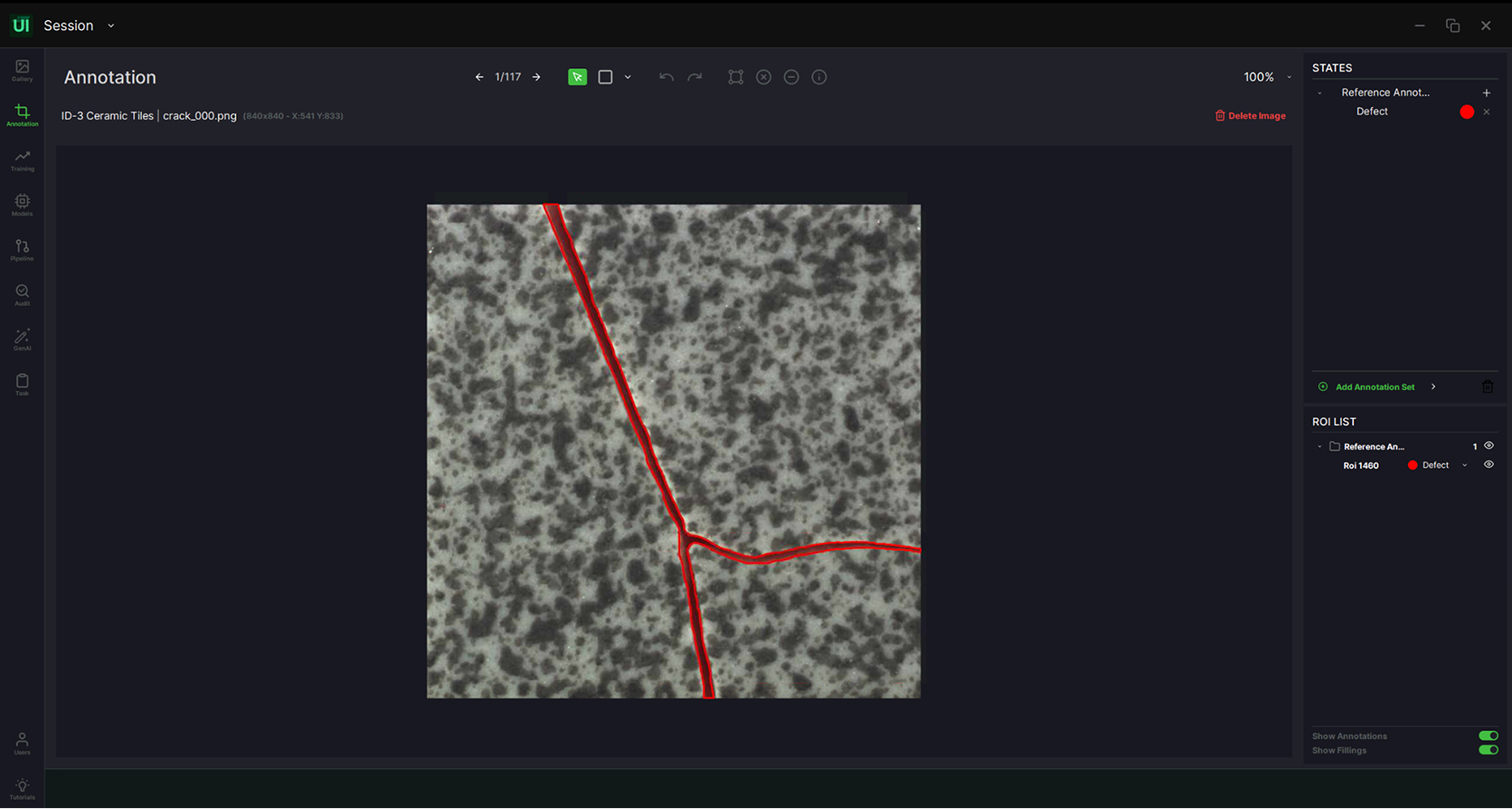
- Request access to ReliVision Learning Center and download the tile image set and its LabelMe annotation files.
- In ReliUI, import the image set with Import Data.
- Import the annotation file for each image folder with Import Annotated Dataset, choosing the LabelMe annotation format.
- Your annotated dataset is now available in the Gallery.
Train the segmentation model
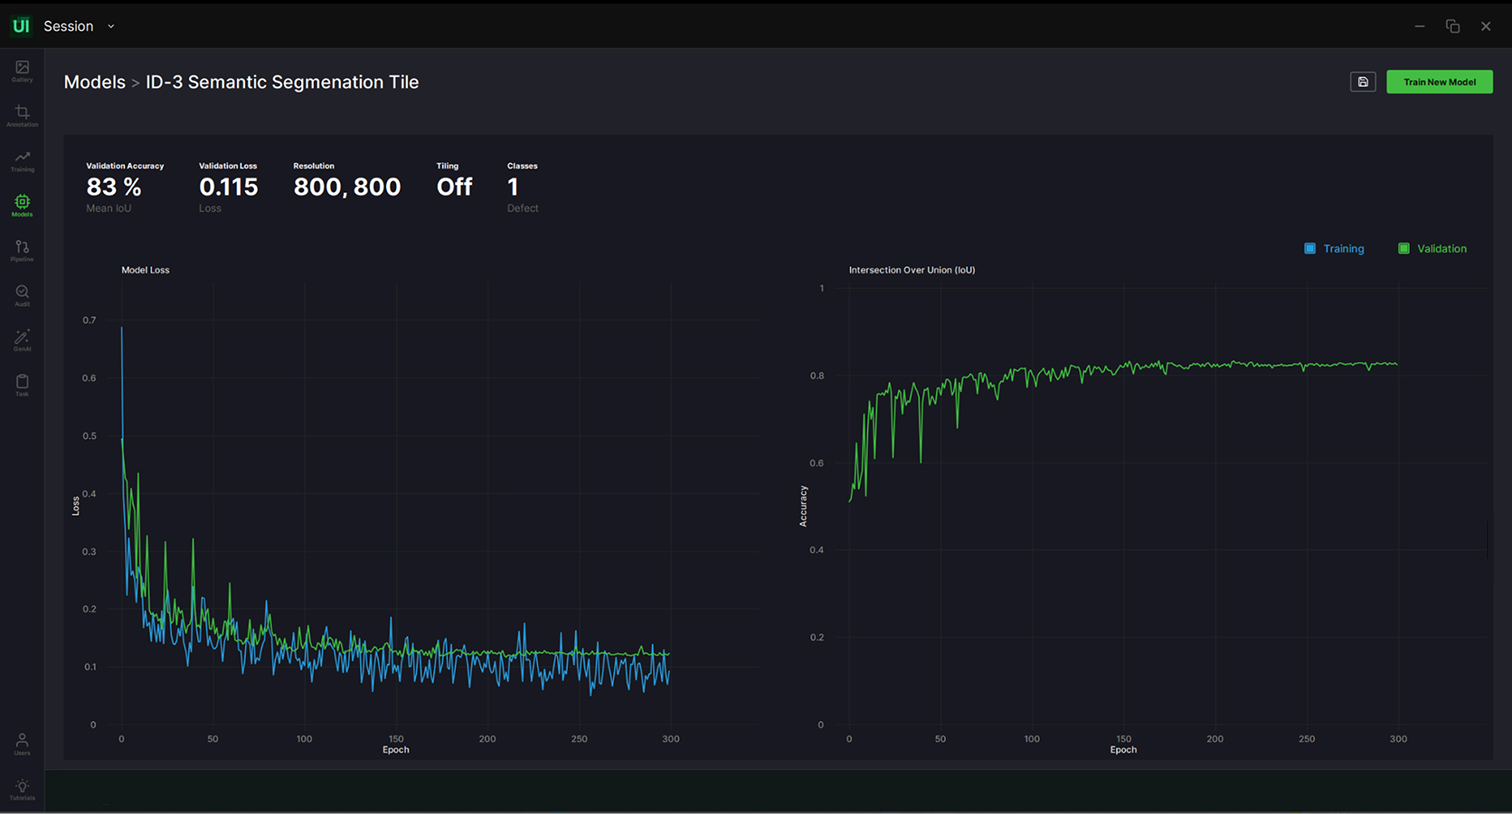
In ReliTrainer, train an AI block for tile defect segmentation. The main steps are:
- Select Semantic Segmentation as the model type.
- Select your annotated tile dataset.
- Split the data into train and test sets, automatically or manually, to hold back some data for validation.
- Set the hyperparameters and start training.
Hyperparameters used in this use case
- Epochs: 300
- X-Y resolution: 800
- Learning rate: 0.01 (default)
- Momentum: 0.937 (default)
- Weight decay: 0.0005 (default)
Build and run the pipeline
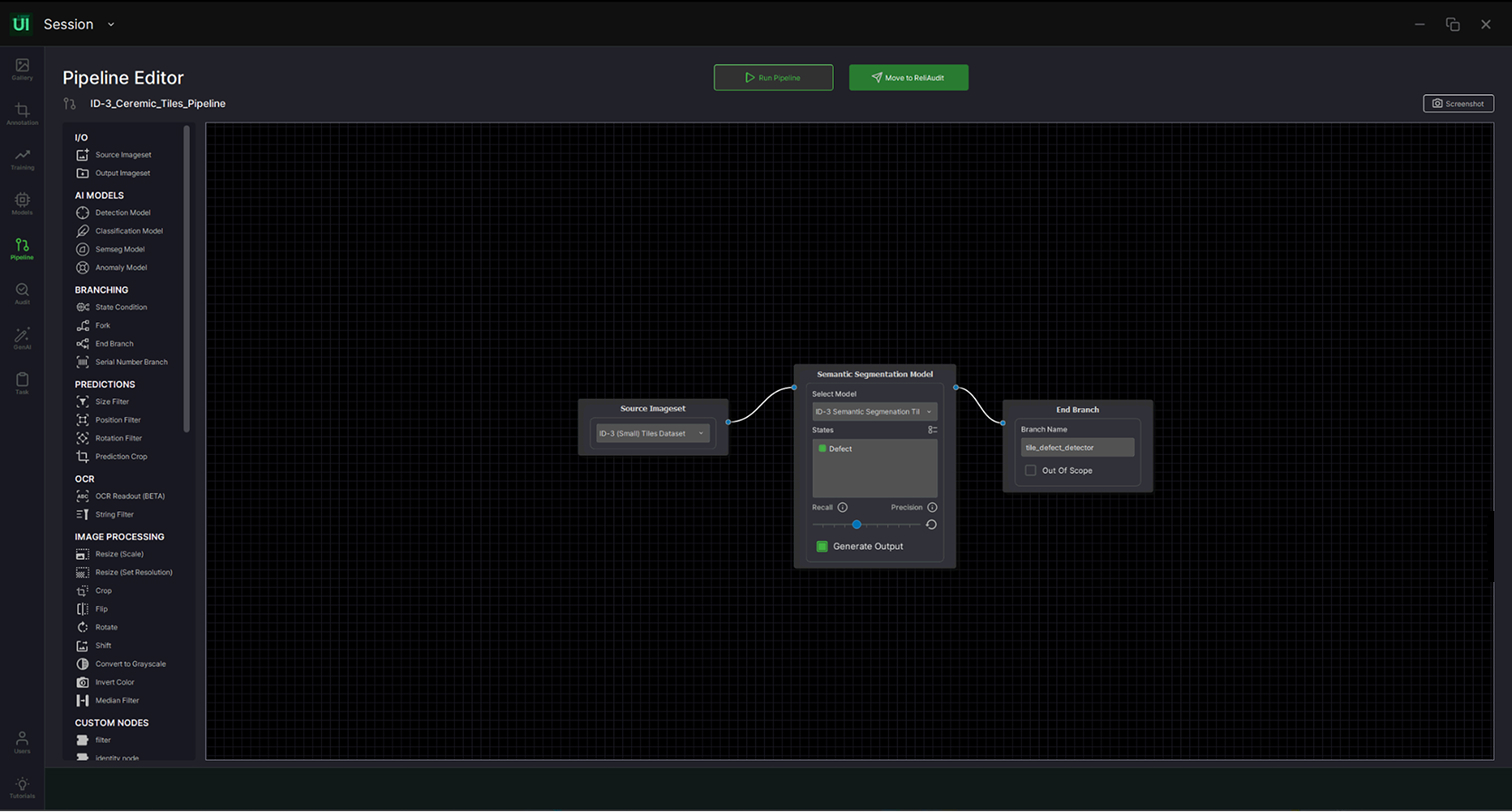
Use the pipeline editor to build the pipeline by dragging and dropping AI and basic blocks. For this use case you need an input data source and a semantic segmentation AI block connected in series.
- Open the pipeline editor.
- Add an input data source and point it at your raw tile image set.
- Add the semantic segmentation AI block you trained and connect it after the input.
- Add an Output Imageset or End Branch block, depending on the desired output: generate an Imageset file from the executed pipeline or proceed to the audit stage.
- Run the pipeline with the execute button at the top.
Review the results
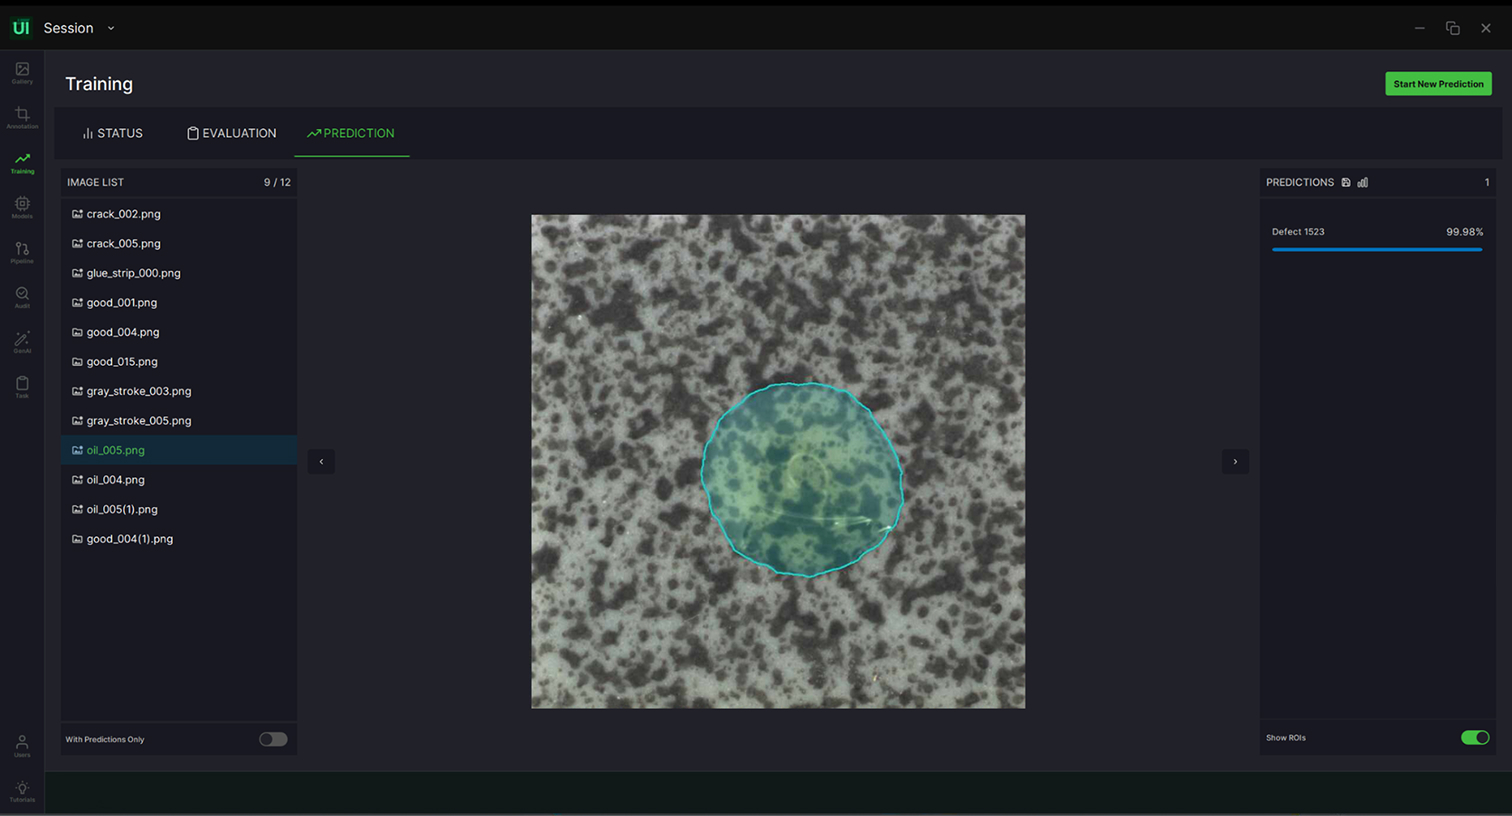
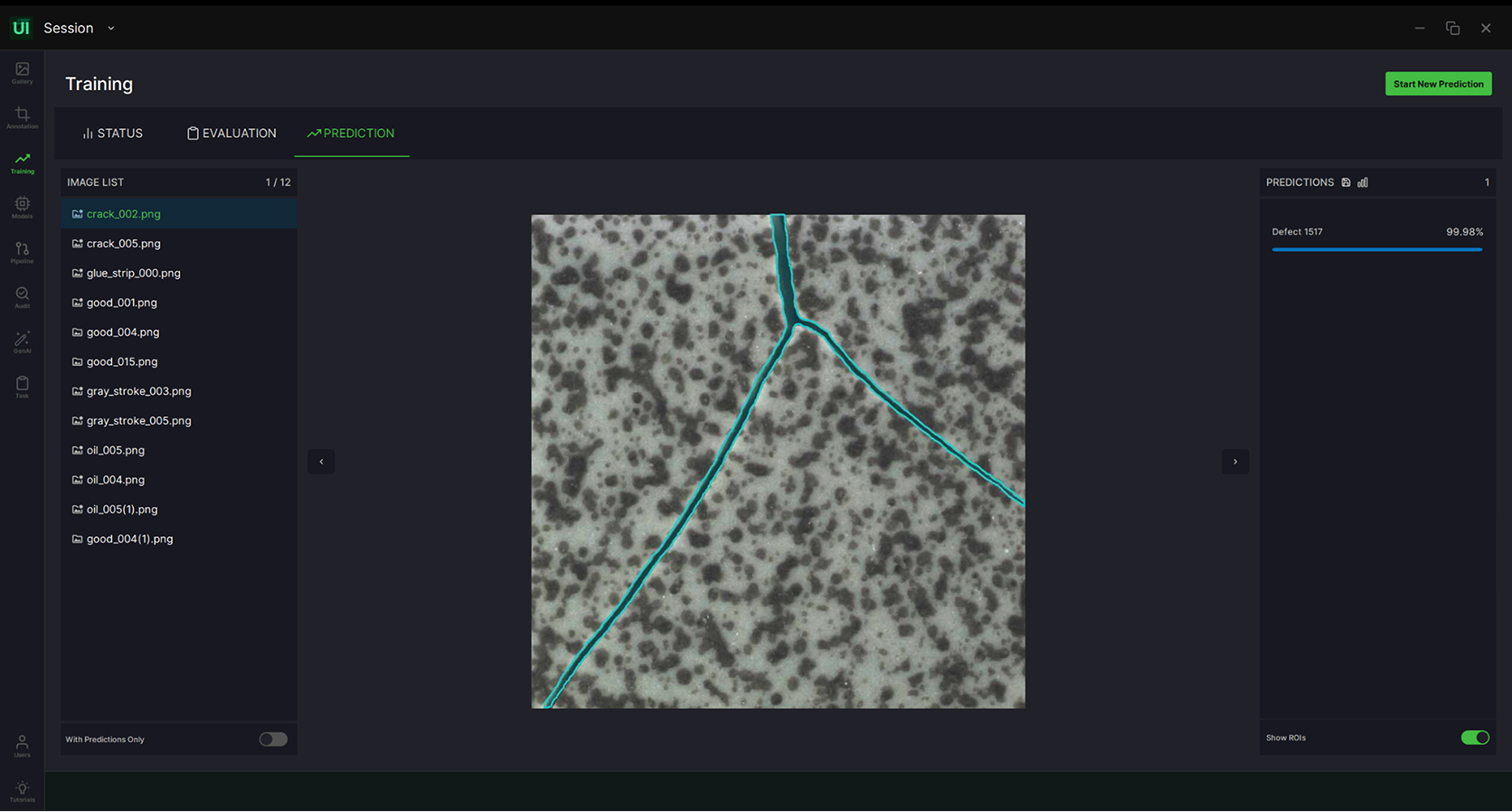
Review the results in the ReliUI data annotation interface. The pipeline saves its outputs as a separate set of annotations for each image it runs on, so you can compare predictions against your labels image by image.
Oil contamination
Crack
Related User Guide sections
- Import a raw dataset
- Import annotated data
- ROI annotation
- Training an AI block
- Create and edit a pipeline
Try it yourself
Download ReliVision to run this playbook on your own tile images, or browse the other
use cases.


